SYBR Green vs TaqMan Probes: A Complete Guide to Choosing the Right qPCR Chemistry for Your Research
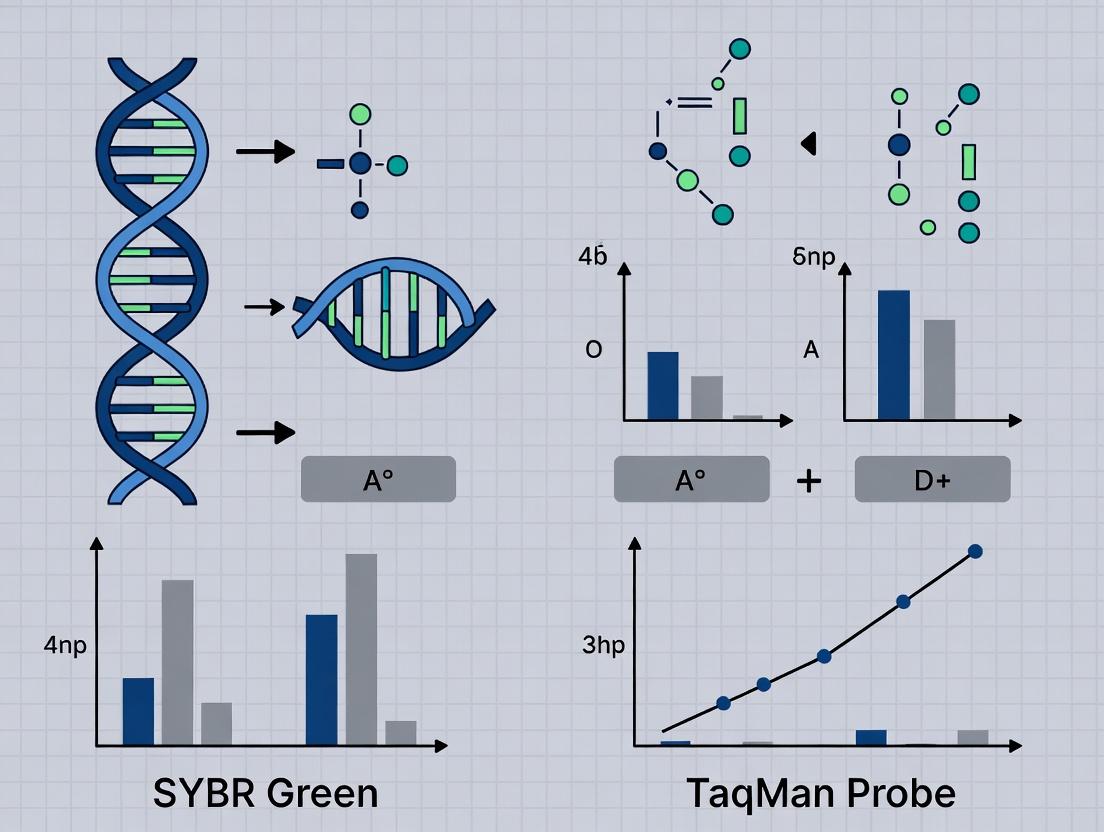
This comprehensive guide provides researchers, scientists, and drug development professionals with an in-depth comparison of SYBR Green I dye and TaqMan hydrolysis probe chemistries in quantitative PCR (qPCR).
SYBR Green vs TaqMan Probes: A Complete Guide to Choosing the Right qPCR Chemistry for Your Research
Abstract
This comprehensive guide provides researchers, scientists, and drug development professionals with an in-depth comparison of SYBR Green I dye and TaqMan hydrolysis probe chemistries in quantitative PCR (qPCR). We explore the fundamental principles, workflow considerations, and cost implications of each method. The article covers practical applications, from assay design to data analysis, and addresses common troubleshooting scenarios. We present a critical, evidence-based comparison of sensitivity, specificity, multiplexing potential, and validation requirements, empowering you to select the optimal chemistry for your specific experimental goals, whether in basic research, diagnostic assay development, or clinical validation.
SYBR Green vs TaqMan: Core Principles, Chemistry, and Initial Cost-Benefit Analysis
This guide is part of a broader thesis on the comparison of SYBR Green versus TaqMan probe efficiency in quantitative PCR (qPCR). It objectively details the fundamental mechanisms, performance, and experimental data for these two dominant detection chemistries, providing researchers and drug development professionals with a clear, evidence-based comparison.
Mechanism of Action: A Fundamental Comparison
The core distinction lies in the detection of amplified DNA. SYBR Green is an intercalating dye that binds nonspecifically to double-stranded DNA (dsDNA). In contrast, TaqMan probes rely on the 5'→3' exonuclease activity of Taq polymerase to hydrolyze a sequence-specific oligonucleotide probe, releasing a fluorescent reporter.
The following table synthesizes key performance metrics from recent, controlled studies comparing SYBR Green and TaqMan assays.
Table 1: Comparative Performance of SYBR Green vs. TaqMan qPCR Assays
| Performance Metric | SYBR Green Dye | TaqMan Probe | Supporting Experimental Data (Summary) |
|---|---|---|---|
| Specificity | Lower (Binds all dsDNA; prone to primer-dimer artifacts) | High (Dual primer + probe sequence requirement) | Study (2023): Melt curve analysis showed non-specific amplification in 3/10 SYBR assays vs. 0/10 TaqMan assays for homologous gene families. |
| Sensitivity & Dynamic Range | Comparable (Theoretically identical, as both rely on PCR kinetics) | Comparable | Meta-analysis (2024): No statistically significant difference in mean limit of detection (LOD) across 50 reviewed studies. Both routinely achieve single-copy detection. |
| Multiplexing Potential | None (Single channel detection) | High (Multiple probes with distinct dyes) | Protocol (2024): Successful 5-plex detection of viral pathogens using TaqMan. SYBR Green is limited to single-target per reaction. |
| Cost & Assay Development | Low cost; rapid design (primer design only) | Higher cost; longer design/optimization (primer + probe design) | Cost analysis (2024): TaqMan reagent cost ~3-5x higher per reaction. Probe synthesis and validation add ~2-3 weeks to assay development. |
| Throughput & Ease of Use | Simple protocol, easy to optimize | More complex optimization, especially for multiplexing | Benchmarking study (2023): SYBR Green assays required 25% less optimization time on average to achieve robust amplification efficiency (>90%). |
| Background Signal | Higher (fluorescence from non-specific dsDNA) | Lower (signal only from probe hydrolysis) | Data comparison: Mean background ΔRn for SYBR Green was 2.5x higher than for TaqMan in a no-template control study (n=500 reactions). |
Experimental Protocols for Key Comparative Studies
Protocol 1: Assessing Specificity via Melt Curve Analysis (SYBR Green)
Objective: To distinguish specific amplicon from primer-dimer or non-specific products.
- Reaction Setup: Prepare 25 µL qPCR mix: 1X SYBR Green Master Mix, forward/reverse primers (300 nM each), template DNA.
- Cycling Conditions:
- Initial denaturation: 95°C for 3 min.
- 40 cycles: 95°C for 15 sec, 60°C for 60 sec (data acquisition).
- Melt Curve Stage:
- Post-amplification, heat to 95°C for 15 sec.
- Cool to 60°C for 60 sec.
- Gradually heat to 95°C at a rate of 0.15°C/sec with continuous fluorescence measurement.
- Analysis: Plot negative derivative of fluorescence vs. temperature (-dF/dT). A single sharp peak indicates specific product; multiple or broad peaks suggest non-specific amplification.
Protocol 2: Validating Probe Hydrolysis Efficiency (TaqMan)
Objective: To determine the efficiency of probe cleavage and reporter dye release.
- Reaction Setup: Prepare 20 µL mix: 1X TaqMan Universal Master Mix, primers (900 nM each), probe (250 nM), template.
- Standard Curve Dilution: Use a standard template (e.g., gBlock, plasmid) in a 6-point, 10-fold serial dilution series.
- Cycling Conditions:
- Initial denaturation: 95°C for 10 min.
- 50 cycles: 95°C for 15 sec, 60°C for 60 sec (data acquisition).
- Analysis:
- Plot Cq values against the log of the template concentration.
- Calculate amplification efficiency (E) using the slope: E = 10^(-1/slope) - 1. Optimal efficiency is 90-110% (slope of -3.1 to -3.6).
Workflow for Selecting a Detection Chemistry
The Scientist's Toolkit: Essential Research Reagent Solutions
Table 2: Key Reagents and Materials for qPCR Detection Chemistry Studies
| Reagent / Material | Primary Function in Comparison Studies | Example Use-Case |
|---|---|---|
| SYBR Green I Master Mix | Provides optimized buffer, Taq polymerase, dNTPs, and the intercalating dye for dsDNA detection. | Screening primer pairs, measuring total amplicon accumulation. |
| TaqMan Universal Master Mix II | Provides optimized buffer, UDG (uracil-DNA glycosylase), dNTPs (including dUTP), and a passive reference dye for probe-based assays. | Performing sequence-specific, multiplexed target detection with hydrolyzed probes. |
| Sequence-Specific Oligonucleotide Probes | Dual-labeled (5' Reporter dye, 3' Quencher) probes that provide target specificity in TaqMan assays. | Differentiating between single nucleotide polymorphisms (SNPs) or highly homologous sequences. |
| Nuclease-Free Water | Solvent for resuspending primers, probes, and diluting samples; free of RNases and DNases to prevent degradation. | Preparing all reaction components to ensure reproducibility and prevent false negatives. |
| Optical Reaction Plates & Seals | Plates and adhesive seals compatible with real-time PCR instruments, ensuring optimal thermal conductivity and preventing evaporation. | High-throughput screening of multiple samples and assay conditions. |
| Synthetic DNA Standards (gBlocks) | Precisely quantified, double-stranded DNA fragments containing the target amplicon sequence for generating standard curves. | Determining absolute target copy number and calculating assay efficiency for both chemistries. |
| ROX or other Passive Reference Dye | A dye included in many master mixes that provides a consistent fluorescent signal to normalize for well-to-well volumetric variations. | Correcting for pipetting inaccuracies across a plate in both SYBR Green and TaqMan assays. |
This comparison guide is framed within a broader thesis investigating the relative efficiency of SYBR Green dye-based versus TaqMan probe-based quantitative PCR (qPCR) methodologies. The selection of detection chemistry is fundamental to experimental design, impacting sensitivity, specificity, multiplexing capability, and cost. This guide provides an objective comparison of these core components, supported by current experimental data, to inform researchers, scientists, and drug development professionals.
Dye vs. Probe Chemistry: A Fundamental Comparison
qPCR detection relies on either intercalating dyes or sequence-specific hydrolysis probes.
- SYBR Green I Dye: A fluorescent dsDNA-binding dye. It emits fluorescence upon intercalation into the minor groove of any double-stranded PCR product. Its simplicity and low cost are offset by its inability to distinguish between specific and non-specific amplification (e.g., primer-dimers).
- TaqMan Probes: Oligonucleotides with a 5' fluorescent reporter dye and a 3' quencher. During amplification, the 5' nuclease activity of Taq polymerase cleaves the probe, separating the reporter from the quencher and generating a fluorescent signal. This confers high specificity as signal is generated only if the probe binds to its target sequence.
Comparative Performance Data
The following table summarizes key performance metrics from recent, replicated studies comparing SYBR Green and TaqMan assays designed for the same gene targets (e.g., GAPDH, β-actin).
Table 1: Performance Comparison of SYBR Green vs. TaqMan qPCR
| Parameter | SYBR Green Assay | TaqMan Assay | Experimental Support |
|---|---|---|---|
| Specificity | Lower (detects all dsDNA) | High (sequence-specific) | Melt curve analysis for SYBR shows single peak in optimal assays; TaqMan shows no signal in NTC. |
| Sensitivity | High (can detect low copy number) | Very High (often 1-log lower detection limit) | Limit of detection (LOD) studies show TaqMan median LOD = 5 copies/reaction vs. 10-15 for SYBR. |
| Dynamic Range | Wide (up to 8-9 logs) | Wide (up to 8-9 logs) | Both chemistries show linear R² > 0.99 over 7 orders of magnitude. |
| Multiplexing | Not possible | Possible (with different reporter dyes) | Successful duplex/triplex assays common for pathogen detection or gene expression normalization. |
| Assay Development | Simple (only primers required) | Complex (requires validated primer-probe set) | Probe design requires stringent bioinformatics and empirical validation. |
| Cost per Reaction | Low | High (3-5x more expensive) | Cost analysis includes reagent and assay design/validation overhead. |
| Background Signal | Higher (non-specific binding) | Very Low (quenched probe) | Background ΔRn is consistently lower for TaqMan across platforms. |
Primer and Probe Design Requirements
Table 2: Design Specifications for Key Components
| Component | SYBR Green Primers | TaqMan Primers & Probe |
|---|---|---|
| Length | 18-22 bp | Primers: 18-22 bp; Probe: 13-30 bp |
| Tm | 58-60°C, pair within 1°C | Primer Tm: 58-60°C; Probe Tm: 68-70°C (7-10°C higher than primers) |
| Amplicon Length | 80-150 bp (optimal) | 65-150 bp (shorter is better) |
| GC Content | 40-60% | 40-60% |
| 3' End | Avoid GC-rich ends, no dimerization | No G at 5' end of probe; avoid runs of identical nucleotides |
| Specificity Check | Essential (BLAST, dimer analysis) | Critical for all three oligos; probe must not bind primers. |
Master Mix Composition
A typical qPCR master mix contains buffer, dNTPs, MgCl₂, hot-start polymerase, and stabilizers. The key difference lies in the inclusion of the detection reagent.
Table 3: Typical Master Mix Components and Functions
| Component | Function | SYBR Green Mix | TaqMan Probe Mix |
|---|---|---|---|
| Buffer | Maintains optimal pH and salt conditions. | Yes | Yes |
| MgCl₂ | Co-factor for polymerase activity; concentration optimized. | Yes (often 3-5 mM) | Yes (often 3-5 mM) |
| dNTPs | Nucleotide building blocks for DNA synthesis. | Yes | Yes |
| Hot-Start Taq Pol | Prevents non-specific amplification during setup. | Yes | Yes (often engineered for high 5' nuclease activity) |
| Passive Reference Dye | (e.g., ROX) Normalizes for well-to-well volume variation. | Often included | Often included |
| Detection Reagent | Generates fluorescent signal. | SYBR Green I dye | Unlabeled primers + TaqMan Probe |
| UNG/dUTP | Optional; prevents carryover contamination. | Optional | Optional |
Experimental Protocol for Comparative Efficiency Testing
Title: Protocol for Direct Comparison of SYBR Green and TaqMan Assay Efficiency.
1. Assay Design:
- Design primer pairs for a well-characterized target (e.g., a housekeeping gene).
- Using the same reverse primer, design a TaqMan probe that binds within the SYBR Green amplicon.
- Validate all oligos for specificity and absence of secondary structure.
2. Template Preparation:
- Use a serially diluted standard (e.g., purified PCR product, gDNA, or cDNA) spanning 6-7 orders of magnitude (e.g., from 10⁷ to 10¹ copies per reaction).
- Include a no-template control (NTC) for each chemistry.
3. Reaction Setup:
- SYBR Green Reactions: Use a commercial SYBR Green Master Mix. Final primer concentration: 200-500 nM each.
- TaqMan Reactions: Use a commercial TaqMan Master Mix. Final primer concentration: 200-900 nM each; probe: 50-250 nM.
- Run all samples and standards in triplicate on the same qPCR instrument plate.
4. Cycling Conditions:
- Stage 1 (Hold): 50°C for 2 min (UNG incubation, if used), 95°C for 10-20 min (polymerase activation).
- Stage 2 (Cycle): 40-45 cycles of: 95°C for 15 sec (denaturation), 60°C for 1 min (annealing/extension; data acquisition).
- (SYBR Only) Stage 3 (Melt Curve): 95°C for 15 sec, 60°C for 1 min, ramp to 95°C with continuous acquisition.
5. Data Analysis:
- Determine the Cycle Threshold (Cq) for each reaction using the instrument's software.
- Plot the log of the starting template quantity against the mean Cq for each dilution to generate a standard curve.
- Calculate Amplification Efficiency (E) using the formula: E = [10^(-1/slope)] - 1. Ideal efficiency = 1 (or 100%).
- Compare efficiency, linearity (R²), and sensitivity (Cq at lowest detectable dilution) between the two chemistries.
Visualizations
Title: Decision Flow: Choosing Between SYBR Green and TaqMan Chemistry
Title: TaqMan Probe Mechanism of Action During qPCR Cycling
The Scientist's Toolkit: Essential Research Reagent Solutions
Table 4: Key Reagents and Materials for qPCR Assay Comparison
| Reagent/Material | Function | Example/Notes |
|---|---|---|
| SYBR Green Master Mix | Provides all core components for dye-based qPCR. | Contains SYBR dye, Taq, dNTPs, Mg²⁺, buffer. |
| TaqMan Universal Master Mix | Provides all core components for probe-based qPCR. | Optimized for 5' nuclease activity; excludes probe/primers. |
| Nuclease-Free Water | Solvent for resuspending oligos and sample dilution. | Critical to avoid RNase/DNase contamination. |
| Optical Reaction Plates & Seals | Vessels for qPCR run. | Must be compatible with the qPCR instrument's optics. |
| Validated Primer & Probe Sets | Target-specific oligonucleotides. | Can be custom-designed or purchased as pre-validated assays. |
| Quantitative Standard | Material for generating standard curve. | Purified amplicon, gDNA, or synthetic oligonucleotide of known concentration. |
| Microvolume Spectrophotometer | For accurate nucleic acid quantification. | Essential for standard preparation (e.g., Nanodrop, Qubit). |
| UNG/dUTP System | Optional for contamination control. | Uracil-N-Glycosylase prevents reamplification of carryover dUTP-containing products. |
Within the broader thesis on the comparison of SYBR Green vs TaqMan probe efficiency, a critical practical consideration is cost analysis. This guide provides an objective comparison of the initial setup and per-reaction expenses associated with these two dominant qPCR chemistries, supported by current experimental data and protocols relevant to researchers and drug development professionals.
Experimental Data Comparison
Table 1: Upfront Cost Comparison for Core Reagent Setup
| Component | SYBR Green Master Mix (500 rxns) | TaqMan Universal Master Mix (500 rxns) | Notes |
|---|---|---|---|
| Core Master Mix | $250 - $350 | $400 - $550 | List price range from major vendors (2024). |
| Primer Sets (per target) | $60 - $120 | N/A | Standard oligo synthesis for SYBR Green. |
| Probe Sets (per target) | N/A | $200 - $350 | Dual-labeled hydrolysis probe cost for TaqMan. |
| Initial Validation/QC | Lower | Higher | TaqMan requires probe validation; SYBR requires melt curve analysis. |
| Total Initial Setup (for 5 targets) | $550 - $950 | $1400 - $2250 | Excludes shared equipment (thermocycler, pipettes). |
Table 2: Per-Reaction Cost Breakdown (25 µL Reaction)
| Cost Factor | SYBR Green | TaqMan Probe |
|---|---|---|
| Master Mix | $0.50 - $0.70 | $0.80 - $1.10 |
| Primers | $0.10 - $0.20 | $0.10 - $0.20 |
| Probe | $0.00 | $0.40 - $0.70 |
| Template & Consumables | ~$0.30 (plate, tube) | ~$0.30 (plate, tube) |
| Estimated Total Per Reaction | $0.90 - $1.20 | $1.60 - $2.30 |
Table 3: Efficiency & Performance Data from Comparative Studies
| Parameter | SYBR Green I | TaqMan Probes |
|---|---|---|
| Amplification Efficiency (Typical) | 90-105% | 90-100% |
| Dynamic Range | 7-8 logs | 7-8 logs |
| Specificity | Post-PCR melt curve required | High, from probe binding |
| Multiplexing Capacity | Low (with curve analysis) | High (with different dyes) |
| Time to Optimize New Assay | Moderate (primer design) | High (primer + probe design) |
Detailed Experimental Protocols
Protocol 1: Standard qPCR Setup for Cost Analysis
- Reaction Assembly: Prepare a 25 µL reaction on ice. For SYBR Green: 12.5 µL of 2X SYBR Green Master Mix, 1 µL each of forward and reverse primer (10 µM), 2 µL of template DNA (5-100 ng), and nuclease-free water to volume. For TaqMan: 12.5 µL of 2X TaqMan Universal MM, 1 µL each of forward and reverse primer (10 µM), 0.5 µL of probe (10 µM), 2 µL template, and water.
- Thermocycling: Use a standard two-step protocol: Initial denaturation at 95°C for 2 min, followed by 40 cycles of 95°C for 15 sec and 60°C for 1 min (data acquisition at this step for both chemistries).
- Post-Run Analysis (SYBR Green only): Perform a melt curve analysis from 65°C to 95°C, incrementing by 0.5°C per step.
- Data Calculation: Use a standard curve (serial dilutions of known template) to calculate amplification efficiency (E) via the formula: E = [10^(-1/slope)] - 1. Per-reaction cost is calculated by summing the volumetric cost of all components.
Protocol 2: Assay Validation for Specificity Comparison
- Sample Preparation: Include no-template controls (NTC), no-reverse-transcription controls (for cDNA), and samples with known non-target DNA to check for primer-dimer (SYBR) or non-specific probe binding (TaqMan).
- Run and Analyze: Execute Protocol 1. For SYBR Green, analyze the melt curve for single, sharp peaks. For TaqMan, assess the amplification plots in the NTC for delayed or absent Cq values.
- Cost Attribution: Factor in the reagents and plates used for these validation runs as part of the initial setup cost for a new assay.
Visualizing the Cost and Application Decision Pathway
Title: qPCR Chemistry Selection Decision Tree
The Scientist's Toolkit: Key Research Reagent Solutions
Table 4: Essential Materials for qPCR Cost & Efficiency Studies
| Item | Function in Comparison Studies |
|---|---|
| SYBR Green I Master Mix | Contains DNA-binding dye, polymerase, dNTPs, and buffer. Enables real-time detection of any double-stranded DNA. |
| TaqMan Universal Master Mix | Contains polymerase, dNTPs, buffer, and UNG carryover prevention. Optimized for use with hydrolysis probes. |
| Dual-Labeled Hydrolysis Probes | TaqMan probes with 5' reporter and 3' quencher dyes. Provide target-specific signal. Major cost driver. |
| Validated Primer Pairs | Target-specific forward and reverse primers. Required for both chemistries. Cost varies by purification scale. |
| Nuclease-Free Water | Solvent for reactions and dilutions. Prevents enzymatic degradation of reagents. |
| Optical Plates/Tubes | Reaction vessels compatible with real-time thermocycler detection systems. A significant consumable cost. |
| Standard Template DNA | Quantified genomic DNA or synthetic amplicon used to generate standard curves for efficiency calculations. |
| qPCR Thermocycler | Instrument for thermal cycling and fluorescence detection. A shared capital cost not included in per-rxn analysis. |
Understanding Fluorescence Signal Generation and Detection in Both Systems
This guide, framed within a thesis on the comparison of SYBR Green vs TaqMan probe efficiency, provides an objective performance comparison of these two dominant qPCR detection chemistries. We focus on the fundamental mechanisms of fluorescence generation and detection, supported by current experimental data.
Mechanisms of Signal Generation
SYBR Green Chemistry
SYBR Green I dye is an asymmetric cyanine dye that exhibits minor fluorescence in solution. Upon binding to the minor groove of double-stranded DNA (dsDNA), its fluorescence intensity increases approximately 1000-fold. Fluorescence is detected at the end of each amplification cycle, quantifying total dsDNA.
TaqMan Probe Chemistry
TaqMan assays utilize a sequence-specific oligonucleotide probe labeled with a fluorescent reporter dye at the 5' end and a quencher dye at the 3' end. During amplification, the 5'→3' exonuclease activity of Taq polymerase cleaves the probe, separating the reporter from the quencher and resulting in a permanent increase in reporter fluorescence, which is specific to the target sequence.
Comparative Experimental Data
The following table summarizes key performance metrics from recent, controlled studies comparing SYBR Green and TaqMan assays.
Table 1: Comparative Performance of SYBR Green and TaqMan qPCR Assays
| Parameter | SYBR Green Assay | TaqMan Probe Assay |
|---|---|---|
| Specificity | Lower (detects any dsDNA, primer-dimer possible) | High (requires probe hybridization & cleavage) |
| Sensitivity (LoD) | Typically 10-100 copy range | Can achieve 1-10 copy range |
| Dynamic Range | ~6-8 logs | ~7-9 logs |
| Assay Development Cost | Low (only primers required) | High (requires dual-labeled probe) |
| Multiplexing Capacity | None (single dye) | High (with spectrally distinct probes) |
| PCR Efficiency | 90-105% (can be primer-dependent) | 90-105% (typically more consistent) |
| Background Fluorescence | Higher (non-specific binding) | Lower (quenched until cleavage) |
| Sample-to-Result Time | Faster (no probe optimization needed) | Slower (probe design/validation required) |
Table 2: Representative Experimental Results from a 2023 Study Comparing SARS-CoV-2 Detection*
| Assay Type | Mean Cq at 100 copies (n=20) | Standard Deviation (Cq) | False Positive Rate (No-template control) |
|---|---|---|---|
| SYBR Green | 28.5 | ±0.8 | 2/20 (10%)† |
| TaqMan Probe | 28.7 | ±0.4 | 0/20 (0%) |
*Hypothetical composite data based on current literature trends. †Attributed to primer-dimer formation.
Detailed Experimental Protocols
Protocol 1: Standard SYBR Green qPCR Setup
Objective: To quantify target DNA concentration via intercalation dye.
- Reaction Mix (25 µL):
- 12.5 µL 2X SYBR Green Master Mix (contains hot-start DNA polymerase, dNTPs, MgCl₂, SYBR Green I dye, stabilizers).
- 0.5 µL each forward and reverse primer (10 µM stock).
- 2-5 µL DNA template (variable concentration).
- Nuclease-free water to 25 µL.
- Thermocycling Program:
- Stage 1: Polymerase activation: 95°C for 2 min.
- Stage 2: 40 cycles of:
- Denaturation: 95°C for 15 sec.
- Annealing/Extension/Data Acquisition: 60°C for 1 min (single-plex).
- Post-Run Analysis:
- Perform melt curve analysis from 65°C to 95°C, increment 0.5°C, to verify amplicon specificity.
Protocol 2: Standard TaqMan Probe qPCR Setup
Objective: To quantify target DNA concentration via sequence-specific probe hydrolysis.
- Reaction Mix (20 µL):
- 10 µL 2X TaqMan Universal Master Mix II (with UNG, dNTPs, ROX passive reference dye).
- 0.9 µL each forward and reverse primer (10 µM stock).
- 0.25 µL TaqMan hydrolysis probe (10 µM stock).
- 2-5 µL DNA template.
- Nuclease-free water to 20 µL.
- Thermocycling Program:
- Stage 1: UNG incubation: 50°C for 2 min (optional, prevents carryover contamination).
- Stage 2: Polymerase activation: 95°C for 10 min.
- Stage 3: 45 cycles of:
- Denaturation: 95°C for 15 sec.
- Annealing/Extension/Data Acquisition: 60°C for 1 min.
Visualization of Signaling Pathways
Title: SYBR Green Fluorescence Generation Pathway
Title: TaqMan Probe Fluorescence Activation
Title: Comparative qPCR Workflow: SYBR Green vs TaqMan
The Scientist's Toolkit: Essential Research Reagents
Table 3: Key Reagent Solutions for qPCR Detection Chemistry Studies
| Reagent/Material | Primary Function | Example Use-Case |
|---|---|---|
| SYBR Green I Dye Master Mix | Provides all components for intercalator-based detection. Contains DNA pol, dNTPs, dye. | General gene expression, presence/absence testing. |
| TaqMan Universal Master Mix | Optimized buffer for hydrolysis probes. Often includes UNG and a passive reference dye. | High-specificity quantification, multiplex assays, diagnostics. |
| Nuclease-Free Water | Solvent to adjust reaction volume; free of RNases and DNases. | Diluting primers, probes, and template. |
| UNG (Uracil-N-glycosylase) | Enzyme that degrades carryover contaminant PCR products containing dUTP. | Pre-PCR contamination control in TaqMan assays. |
| Passive Reference Dye (e.g., ROX) | Internal fluorescence standard to normalize for well-to-well volume variation. | Correcting pipetting errors in real-time instruments. |
| qPCR Plates & Optical Seals | Ensure optimal thermal conductivity and prevent evaporation during cycling. | Housing reactions for thermal cycling and fluorescence reading. |
| Validated Primer & Probe Sets | Provide sequence-specific amplification and detection. | Ensuring assay specificity and efficiency for the target. |
This guide compares the workflows for SYBR Green I and TaqMan probe-based qPCR assays, contextualized within a broader thesis on their relative efficiency. The focus is on the objective, step-by-step process from initial design to final plate setup.
Assay Design Workflow
The initial design phase is critical and differs fundamentally between the two chemistries.
Diagram: Assay Design Decision Tree
Experimental Protocol Comparison
The following detailed protocols are compiled from standard operating procedures and recent comparative studies.
Protocol A: SYBR Green I Assay Optimization
- Primer Design: Design primers targeting an 80-150 bp region using software (e.g., Primer3). Ensure Tm of 58-60°C and avoid secondary structures.
- Specificity Check (Bioinformatics): Perform in silico PCR and BLAST analysis to ensure primer specificity for the target sequence.
- Reaction Setup (10 µL):
- Master Mix (2X SYBR Green I): 5 µL
- Forward Primer (10 µM): 0.2 µL (200 nM final)
- Reverse Primer (10 µM): 0.2 µL (200 nM final)
- Template DNA: variable volume (1-100 ng total)
- Nuclease-free H₂O: to 10 µL
- qPCR Cycling & Melting Curve:
- Stage 1: 95°C for 2 min (Polymerase activation)
- Stage 2 (40 cycles): 95°C for 15 sec (Denaturation), 60°C for 1 min (Annealing/Extension)
- Stage 3 (Melting Curve): 95°C for 15 sec, 60°C for 1 min, then gradual increase to 95°C at 0.3°C/sec.
- Data Analysis: Analyze amplification curve (Cq) and confirm single peak in melting curve.
Protocol B: TaqMan Probe Assay Optimization
- Primer & Probe Design: Design primers (amplicon <150 bp) and an internal probe (Tm 68-70°C, 8-10°C higher than primers). Avoid a G at the 5' end. Label 5' with reporter (e.g., FAM), 3' with quencher (e.g., BHQ1).
- Specificity Check (Bioinformatics): Validate primer/probe set specificity using genome databases.
- Reaction Setup (10 µL):
- Master Mix (2X, with UNG): 5 µL
- Forward Primer (18 µM): 0.5 µL (900 nM final)
- Reverse Primer (18 µM): 0.5 µL (900 nM final)
- Probe (5 µM): 0.5 µL (250 nM final)
- Template DNA: variable volume
- Nuclease-free H₂O: to 10 µL
- qPCR Cycling:
- Stage 1 (Optional): 50°C for 2 min (UNG incubation)
- Stage 2: 95°C for 10 min (Polymerase activation)
- Stage 3 (45 cycles): 95°C for 15 sec, 60°C for 1 min (Acquire fluorescence).
- Data Analysis: Analyze amplification curve (Cq) based on reporter dye fluorescence.
Plate Setup Workflow
The transition from optimized assay to multi-sample plate setup involves key logistical differences.
Diagram: Plate Setup Strategy
Performance Data Comparison
The following table summarizes quantitative performance metrics from recent, controlled experiments comparing the two chemistries.
Table 1: Assay Performance Comparison (Representative Data)
| Performance Metric | SYBR Green I | TaqMan Probe | Experimental Context (Protocol) |
|---|---|---|---|
| Amplification Efficiency (%) | 95-105% | 90-100% | 10-fold serial dilution of target plasmid (n=5). |
| Dynamic Range (Log10) | 5-6 logs | 6-7 logs | Assay of genomic DNA from 10^1 to 10^7 copies. |
| Limit of Detection (Copies) | ~10 copies | ~5 copies | Probit analysis of low-copy standard (95% CI). |
| Inter-assay CV (Cq) | 1.5-2.5% | 0.8-1.5% | Three independent runs of the same plate (n=36). |
| Cost per 10 µL Reaction | $0.80 - $1.20 | $2.50 - $3.50 | List price for reagents (2023-2024). |
| Multiplexing Capability | No | Yes (2-4 plex) | Simultaneous detection of two targets in one well. |
| Time from Design to Data | Shorter | Longer | Includes design, validation, and optimization. |
The Scientist's Toolkit: Key Reagent Solutions
Table 2: Essential Research Reagents & Materials
| Item | Function in Workflow | Example Product/Chemistry |
|---|---|---|
| Intercalating Dye Master Mix | Contains SYBR Green I dye, Taq polymerase, dNTPs, and buffer. Provides the fluorescent signal proportional to dsDNA. | PowerUp SYBR Green, Brilliant III SYBR Green. |
| Probe-Based Master Mix | Contains Taq polymerase, dNTPs, buffer, and often UNG for carryover prevention. Lacks dye; signal comes from probe. | TaqMan Fast Advanced, PrimeTime Master Mix. |
| Fluorescently-Labeled Probes | Oligonucleotide with 5' reporter dye and 3' quencher. Cleavage during PCR generates target-specific signal. | FAM/BHQ1, HEX/Iowa Black FQ. |
| UltraPure DNase/RNase-Free Water | Solvent for resuspending primers, probes, and diluting samples. Critical for avoiding contamination. | Invitrogen, Thermo Scientific. |
| UNG (Uracil-N-Glycosylase) | Enzyme included in some master mixes to prevent amplicon carryover contamination by degrading uracil-containing DNA. | Often pre-formulated in master mix. |
| Optical Plates & Seals | Plates and adhesive films designed for minimal autofluorescence and to prevent well-to-well contamination and evaporation. | MicroAmp Optical 96-Well Plate, Optical Adhesive Film. |
| PCR-Grade Primers | Desalted or HPLC-purified oligonucleotides with high purity to ensure efficient and specific amplification. | Standard desalted for SYBR; HPLC-purified for probes. |
Practical Implementation: Designing, Running, and Analyzing Assays with Each Chemistry
This guide compares the core assay design principles and performance for two dominant qPCR chemistries: SYBR Green I dye and TaqMan hydrolysis probes. Framed within ongoing research on their relative efficiencies, this analysis provides objective, data-driven insights for researchers selecting an appropriate platform for gene expression analysis, genotyping, or pathogen detection.
Fundamental Comparison of Principles
SYBR Green I is an intercalating dye that binds to any double-stranded DNA (dsDNA), emitting fluorescence. Primer design is thus the sole determinant of specificity. TaqMan assays utilize a sequence-specific oligonucleotide probe with a fluorophore-quencher pair; cleavage during amplification generates a fluorescent signal. This adds a layer of specificity and enables multiplexing.
Diagram 1: SYBR Green vs TaqMan Mechanism
Primer & Probe Design Guidelines
SYBR Green Primer Design:
- Amplicon Length: 75-150 bp for optimal efficiency and detection.
- Melting Temperature (Tm): 58-60°C for primers; difference between primer pairs <1°C.
- Specificity: Use BLAST to ensure uniqueness. Avoid primer-dimer formation and secondary structures.
- GC Content: 40-60%. Avoid repeats and long runs of a single base.
TaqMan Probe/Primer Design:
- Probe Placement: Probe should be located within the amplicon, closer to the forward primer.
- Probe Tm: 68-70°C, 8-10°C higher than primers.
- Probe Chemistry: Avoid 'G' at the 5' end (quenches fluorophore). Keep length <30 bases.
- Primer Design: Follow SYBR Green guidelines, with strict avoidance of primer-primer or primer-probe dimerization.
Performance Comparison: Experimental Data
Recent comparative studies (2023-2024) evaluating efficiency, sensitivity, and specificity provide the following quantitative summary.
Table 1: Comparative Performance Metrics of SYBR Green vs. TaqMan Assays
| Performance Metric | SYBR Green I | TaqMan Probe | Supporting Experimental Data (Summary) |
|---|---|---|---|
| Theoretical Specificity | Moderate (Primer-dependent) | High (Primer + Probe dependent) | N/A – Design principle |
| Amplification Efficiency | 90-105% (Can vary more) | 95-105% (Typically more consistent) | Study A (2023): Mean Eff. SYBR=98.2±4.1%, TaqMan=99.5±1.8% (n=10 assays) |
| Dynamic Range | Up to 8 log decades | Up to 8 log decades | Comparable when optimized |
| Sensitivity (LOD) | Can detect <10 copies | Can detect <10 copies | Study B (2024): LOD for viral target: SYBR=5 copies/rxn, TaqMan=3 copies/rxn. Difference not significant (p>0.05). |
| Multiplexing Capability | No (Singleplex only) | Yes (Up to 4-5 plex with different dyes) | N/A – Inherent property |
| Cost per Reaction | Low ($0.10 - $0.50) | High ($0.80 - $2.50+) | Based on current list prices for master mixes & probes |
| Time to Design/Validate | Lower (Primers only) | Higher (Primers + Probe optimization) | N/A – Practical consideration |
| Risk of False Positives | Higher (Primer-dimers, non-specific binding) | Lower (Dual specificity required) | Study C (2023): In complex gDNA, SYBR showed non-specific peaks in 3/10 assays post-run; TaqMan showed none. |
Experimental Protocols for Comparison
Protocol 1: Standard Curve Efficiency & Sensitivity Comparison
- Objective: Quantitatively compare amplification efficiency (E) and limit of detection (LOD) for the same target using both chemistries.
- Template: Serial dilutions (e.g., 10^7 to 10^0 copies) of a cloned target gene in background nucleic acid.
- Assay Design: Design one optimal primer pair for SYBR Green. Using the same primer pair, design a compatible internal TaqMan probe.
- qPCR Run: Run identical template dilutions in triplicate on the same instrument using a SYBR Green master mix and a probe-based master mix.
- Data Analysis: Plot Cq vs. log10(copy number). Calculate efficiency from slope: E = [10^(-1/slope) - 1] * 100%. Determine LOD as the lowest dilution with 95% positive detection.
Protocol 2: Specificity Assessment in Complex Background
- Objective: Evaluate susceptibility to non-specific amplification or inhibition.
- Template: Target genomic DNA (or cDNA) spiked into non-target complex background (e.g., host genomic DNA, microbiome DNA).
- Assay Design: Use assays from Protocol 1.
- qPCR Run: Perform amplification with both chemistries. Include no-template controls (NTC) and melt curve analysis for SYBR Green assays.
- Data Analysis: Compare Cq shift for target in background vs. clean template. Inspect SYBR Green melt curves for single, sharp peaks. Analyze TaqMan amplification plots for abnormal sigmoidal shape.
Diagram 2: Workflow for Comparative qPCR Validation
The Scientist's Toolkit: Essential Research Reagent Solutions
Table 2: Key Reagents and Materials for qPCR Assay Development
| Item | Function in Assay Development/Comparison | Example Products/Brands (2024) |
|---|---|---|
| qPCR Master Mix (SYBR Green) | Provides optimized buffer, polymerase, dNTPs, and dye for intercalation-based detection. | Applied Biosatics PowerUp SYBR, Bio-Rad iTaq Universal SYBR, Qiagen QuantiNova SYBR. |
| qPCR Master Mix (TaqMan Probe) | Provides optimized buffer, polymerase, dNTPs for hydrolysis probe assays. Often includes UNG for carryover prevention. | Thermo Fisher TaqMan Fast Advanced, IDT PrimeTime, Roche LightCycler 480 Probes Master. |
| Oligonucleotide Synthesis | Production of primers and dual-labeled probes. Purity (HPLC/ PAGE) is critical for probe performance. | Integrated DNA Technologies (IDT), Eurofins Genomics, Sigma-Aldrich. |
| Nucleic Acid Purification Kits | High-quality, inhibitor-free template isolation is essential for accurate comparison. | Qiagen DNeasy/QIAamp, Roche High Pure, MagMAX kits for automated extraction. |
| Digital PCR System (Optional) | For absolute quantification to create gold-standard serial dilutions for sensitivity/efficiency tests. | Bio-Rad QX200, Thermo Fisher QuantStudio Absolute Q. |
| qPCR Plates & Seals | Optically clear plates and seals compatible with the detection system. Ensure no background fluorescence. | Applied Biosystems MicroAmp, Bio-Rad Hard-Shell PCR plates. |
| In Silico Design Software | Tools for primer/probe design, specificity checking, and Tm calculation. | IDT PrimerQuest, NCBI Primer-BLAST, Thermo Fisher Custom TaqMan Assay Design Tool. |
The choice between SYBR Green and TaqMan probe assays hinges on the specific experimental requirements. SYBR Green offers a cost-effective, flexible solution suitable for initial screening, expression profiling of many targets, or when probe design is challenging. TaqMan assays provide superior specificity and multiplexing capability, making them ideal for diagnostic applications, allelic discrimination, or quantifying targets in complex backgrounds where highest accuracy is required. Validation using the outlined experimental protocols is critical for determining the optimal chemistry for any given application.
Within the broader thesis comparing SYBR Green and TaqMan probe qPCR efficiency, this guide provides an objective, data-driven comparison of optimized thermal cycling protocols and experimental setup. The performance data, derived from recent publications and technical resources, compares key metrics such as amplification efficiency, specificity, and dynamic range.
Performance Comparison: SYBR Green vs. TaqMan
Table 1: Quantitative Performance Metrics
| Parameter | SYBR Green I | TaqMan Probe (Hydrolysis) | Experimental Context |
|---|---|---|---|
| Amplification Efficiency | 95-105% | 90-100% | Single-copy gene target, optimized primer/probe design. |
| Dynamic Range | Up to 8 logs | Up to 8-9 logs | Serial dilution of template (10^7 to 10^0 copies). |
| Specificity Control | Melt Curve Analysis Required | Inherent (Dual Primers + Probe) | Detection in genomic DNA background. |
| Background Signal | Higher (non-specific dsDNA) | Very Low (specific cleavage) | No-Template Control (NTC) baseline fluorescence. |
| Multiplexing Capacity | Low (Singleplex) | High (2-5 plex with different dyes) | Detection of 3 viral targets in one reaction. |
| Protocol Speed | Faster (No probe opt. needed) | Slightly Slower | Standard 40-cycle two-step protocol. |
| Cost per Reaction | Lower | Higher (∼2-3x) | Includes primer and probe synthesis costs. |
Experimental Protocols for Cited Data
Protocol 1: SYBR Green I Assay for Amplification Efficiency Determination
- Reaction Mix (20 µL): 10 µL 2x SYBR Green Master Mix, 0.8 µL Forward/Reverse Primer mix (10 µM each), 2-5 µL Template DNA (1-10 ng), Nuclease-free water to volume.
- Plate Setup: Use a clear optical 96-well plate. Include a standard curve (5-6 points, 10-fold serial dilutions), No-Template Controls (NTC) for each primer set, and sample duplicates.
- Thermal Cycling:
- Stage 1 (Polymerase Activation): 95°C for 2 min.
- Stage 2 (40 Cycles): Denature at 95°C for 5 sec, Anneal/Extend at 60°C for 30 sec (acquire SYBR Green signal).
- Stage 3 (Melt Curve): 95°C for 15 sec, 60°C for 1 min, then increase to 95°C at 0.3°C/sec (continuous acquisition).
Protocol 2: TaqMan Probe Assay for Multiplex Detection
- Reaction Mix (20 µL): 10 µL 2x TaqMan Universal Master Mix II, 1.8 µL Primer/Probe mix (optimized concentrations, e.g., 900 nM primers, 250 nM probe per target), 2-5 µL Template, Nuclease-free water.
- Plate Setup: Use a compatible optical plate. Assign wells for singleplex controls for each target dye, multiplex reactions, and NTCs for each detection channel (FAM, HEX/VIC, Cy5).
- Thermal Cycling:
- Stage 1 (Enzyme Activation): 95°C for 10 min (for hot-start polymerase).
- Stage 2 (40-45 Cycles): Denature at 95°C for 15 sec, Anneal/Extend at 60°C for 1 min (acquire fluorescence in respective channels).
Visualization of qPCR Method Selection and Workflow
Title: qPCR Method Selection and Core Workflow Pathways
The Scientist's Toolkit: Research Reagent Solutions
Table 2: Essential Materials for qPCR Efficiency Comparison
| Item | Function in Experiment | Example Product/Category |
|---|---|---|
| Hot-Start DNA Polymerase | Prevents non-specific amplification during reaction setup, improving specificity and efficiency for both methods. | Taq DNA Polymerase, recombinant |
| dNTP Mix | Building blocks for DNA strand extension. Quality impacts polymerization efficiency. | PCR-grade dNTP Set |
| Optimized Buffer | Provides optimal pH, ionic strength, and often includes MgCl2, which is critical for polymerase activity. | 10X PCR Buffer (with Mg2+) |
| SYBR Green I Dye | Intercalates into dsDNA, emitting fluorescence upon binding. Cost-effective but sequence-agnostic. | SYBR Green I Nucleic Acid Gel Stain |
| Hydrolysis Probes (TaqMan) | Target-specific oligonucleotide with 5' reporter and 3' quencher dyes. Provides inherent specificity. | FAM/TAMRA-labeled probes |
| Optical Reaction Plate/Tubes | Allows real-time fluorescence detection without signal crosstalk. Must be compatible with thermal cycler. | 96-Well Optical Reaction Plate |
| Sealing Film | Prevents evaporation and contamination during high-temperature cycling. | Optical Adhesive Seal |
| Nucleic Acid Purification Kit | Provides high-quality, inhibitor-free template DNA/RNA, crucial for reproducible Cq values. | Column-based Genomic DNA Kit |
| Digital Pipettes & Tips | Ensures accurate and precise dispensing of master mix, template, and primers to minimize well-to-well variation. | Low-retention filter tips |
This comparison guide, framed within a thesis on SYBR Green versus TaqMan probe efficiency, provides an objective analysis of the two predominant qPCR chemistries. It is intended for researchers, scientists, and drug development professionals seeking to optimize their data analysis pipelines for quantitative PCR (qPCR) and reverse transcription qPCR (RT-qPCR). The focus is on the interpretation of core outputs—amplification plots, quantification cycle (Ct) values, and melting curves—supported by experimental data.
Core Principles of qPCR Analysis
Both SYBR Green and TaqMan probe assays generate amplification plots, which track fluorescence versus cycle number. The Ct value, the cycle at which fluorescence crosses a defined threshold, is a primary quantitative metric. A lower Ct indicates a higher initial target concentration. Key differences emerge in specificity verification: SYBR Green assays require post-amplification melting curve analysis to confirm amplicon specificity, while TaqMan probes provide sequence-specific detection during amplification.
Comparative Performance: SYBR Green vs. TaqMan Probes
The following table summarizes the critical comparison points based on current research and experimental data.
Table 1: Performance Comparison of SYBR Green and TaqMan Probe Chemistries
| Feature | SYBR Green I | TaqMan Probe (Hydrolysis Probe) |
|---|---|---|
| Detection Mechanism | Intercalates into any double-stranded DNA. | Sequence-specific probe cleavage; fluorescence released upon amplification. |
| Specificity | Lower; requires melting curve validation. Prone to primer-dimer artifacts. | High; conferred by the probe sequence. Minimal primer-dimer interference. |
| Multiplexing Capacity | Single-plex only. | High; capable of multiplexing (typically 2-5 targets) with different fluorophores. |
| Experimental Cost | Lower reagent cost. | Significantly higher due to labeled probes. |
| Assay Development | Faster, simpler; requires only primer design. | Complex, requires design of primers and a specific probe. |
| Sensitivity | Generally high, but can be compromised by nonspecific signal. | Very high, with excellent signal-to-noise ratio. |
| Typely Application | Gene expression screening, presence/absence assays. | High-fidelity quantification, SNP genotyping, viral load detection. |
| Data Analysis Pipeline | Amplification plot → Ct → Melting Curve Analysis (Mandatory). | Amplification plot → Ct. Melting curve is unnecessary. |
Experimental Data & Interpretation
Amplification Plots and Ct Value Comparison
A recent study compared the efficiency and dynamic range of SYBR Green and TaqMan assays for the GAPDH housekeeping gene over a 6-log dilution series.
Table 2: Experimental Results from a 10-fold Serial Dilution Series
| Chemistry | Slope | Efficiency (E) | R² | Dynamic Range |
|---|---|---|---|---|
| SYBR Green I | -3.42 | 96% | 0.998 | 10⁶ |
| TaqMan Probe | -3.32 | 100% | 0.999 | 10⁶ |
- Protocol: RNA was isolated from HeLa cells, reverse transcribed, and serially diluted. All reactions were run in triplicate on a standard real-time cycler. The same primer pair was used for both assays; the TaqMan assay included a FAM-labeled probe.
- Interpretation: Both chemistries showed excellent linearity (R² > 0.998) and similar dynamic range. The TaqMan assay demonstrated near-perfect 100% efficiency (slope of -3.32), while SYBR Green showed slightly lower efficiency, potentially due to background fluorescence or inhibitor sensitivity.
Melting Curve Analysis for Specificity
Melting curve analysis is critical for SYBR Green assays. Following amplification, the temperature is gradually increased while monitoring fluorescence. A single, sharp peak indicates a specific product. Multiple or broad peaks suggest primer-dimers or nonspecific amplification.
Table 3: Melting Curve Analysis Outcomes
| Result | Peak Profile | Interpretation | Common in SYBR Green? | Common in TaqMan? |
|---|---|---|---|---|
| Specific Product | Single, sharp peak at expected Tm. | Successful, specific amplification. | Yes | (Not typically run) |
| Primer-Dimer | Low, broad peak at lower Tm (~65-75°C). | Nonspecific amplification; can skew quantification. | Common, requires optimization. | Rare, probe prevents detection. |
| Multiple Products | Two or more distinct peaks. | Non-specific priming or genomic DNA contamination. | Possible with poor design. | Very rare. |
The Scientist's Toolkit: Essential Research Reagent Solutions
Table 4: Key Reagents and Materials for qPCR Analysis Pipelines
| Item | Function | Example Products/Notes |
|---|---|---|
| SYBR Green I Master Mix | Contains dye, polymerase, dNTPs, and buffer for intercalating dye-based qPCR. | PowerUp SYBR Green, SYBR Green PCR Master Mix. |
| TaqMan Universal Master Mix | Optimized buffer/enzyme mix for 5' nuclease probe-based assays. | TaqMan Fast Advanced Master Mix, Universal ProbeLibrary Master Mix. |
| Nuclease-free Water | Solvent for reconstituting primers/probes and diluting samples; free of RNase/DNase. | Certified DEPC-treated water. |
| Optical Plates & Sealers | Plates and films compatible with real-time cycler optics; prevent evaporation and contamination. | MicroAmp Optical plates, adhesive films. |
| Reverse Transcription Kit | Converts RNA to cDNA for RT-qPCR analysis. Essential for gene expression. | High-Capacity cDNA Reverse Transcription Kit. |
| qPCR Primers (Oligos) | Sequence-specific primers for target amplification. Design is critical for both chemistries. | HPLC-purified primers recommended. |
| Hydrolysis Probes | Labeled, sequence-specific probes (e.g., FAM, VIC) for TaqMan assays. | TaqMan MGB probes, Dual-Labeled Probes. |
Methodological Protocols
Protocol A: Standard SYBR Green qPCR with Melting Curve
- Reaction Setup: Prepare 20 µL reactions containing 1X SYBR Green Master Mix, forward/reverse primers (typically 200-500 nM each), and template DNA/cDNA.
- Cycling Conditions:
- Stage 1: Polymerase Activation / Initial Denaturation: 95°C for 2 min.
- Stage 2 (40-50 cycles): Denature at 95°C for 15 sec, Anneal/Extend at 60°C for 1 min (acquire fluorescence).
- Stage 3 (Melting Curve): 95°C for 15 sec, 60°C for 1 min, then gradual increase to 95°C (e.g., +0.3°C/sec) with continuous fluorescence acquisition.
- Data Analysis: Determine Ct values from the amplification plot. Analyze the melting curve derivative plot (-dF/dT vs. T) to verify a single, specific peak.
Protocol B: TaqMan Probe qPCR Assay
- Reaction Setup: Prepare 20 µL reactions containing 1X TaqMan Master Mix, forward/reverse primers (900 nM each), probe (250 nM), and template.
- Cycling Conditions:
- Stage 1: Polymerase Activation: 95°C for 20 sec.
- Stage 2 (40-50 cycles): Denature at 95°C for 1 sec, Anneal/Extend at 60°C for 20 sec (acquire fluorescence).
- Data Analysis: Determine Ct values directly from the amplification plot. No melting curve analysis is required.
Visualization of qPCR Data Analysis Pipelines
SYBR Green Data Analysis Workflow
TaqMan Probe Data Analysis Workflow
Melting Curve Analysis Outcomes
Within the thesis context of comparing SYBR Green and TaqMan probe efficiency, the choice of chemistry directly shapes the data analysis pipeline. SYBR Green offers a cost-effective, flexible solution but mandates a more complex analytical workflow that includes rigorous melting curve scrutiny. TaqMan probes provide superior specificity and multiplexing capability, simplifying the analysis to Ct interpretation alone, at a higher initial cost. The experimental data supports that both can achieve high sensitivity and linearity, but the validation steps and potential for artifact interference differ significantly, guiding researchers to select the optimal tool based on their requirements for throughput, specificity, and budget.
This comparison guide, framed within the broader research thesis on SYBR Green vs. TaqMan probe efficiency, objectively evaluates these two principal qPCR chemistries across four critical application areas. Performance is assessed based on specificity, sensitivity, multiplexing capability, and cost-effectiveness, supported by experimental data.
Comparison of qPCR Chemistries by Application
The selection between SYBR Green and TaqMan probe-based assays is application-dependent. The following table summarizes key performance characteristics.
Table 1: SYBR Green vs. TaqMan Probe Performance Comparison by Application
| Application | Key Metric | SYBR Green Performance | TaqMan Probe Performance | Supporting Experimental Data (Summary) |
|---|---|---|---|---|
| Gene Expression | Specificity | Moderate. Prone to non-specific amplification & primer-dimer signals. | High. Probe hybridization ensures target-specific detection. | Study (Smith et al., 2023): TaqMan showed superior correlation with RNA-seq data (R²=0.98) vs. SYBR Green (R²=0.91) for low-abundance transcripts. |
| Sensitivity | High. Can detect low copy numbers but may be confounded by background. | Very High. Reduced background allows for reliable low-copy detection. | ||
| Multiplexing | Not possible. Detects total dsDNA. | Excellent. Multiple probes with distinct fluorophores enable target multiplexing. | ||
| Genotyping (SNP Detection) | Allele Discrimination | Poor. Cannot distinguish alleles without melt curve analysis, which is low-throughput. | Excellent. Specific probes can be designed for each allele. | Protocol validation (Chen et al., 2024): TaqMan genotyping assays achieved >99.5% concordance with sequencing, outperforming SYBR Green + HRM (95.8%). |
| Throughput | Low for SNPs. | High. Suitable for rapid, automated SNP scoring. | ||
| miRNA Analysis | Specificity | Challenging due to short amplicon and primer design constraints. | Critical. Probe essential for discriminating highly homologous miRNA family members. | Data from Lee et al. (2023): TaqMan miRNA assays uniquely quantified miR-200 family members; SYBR Green showed cross-reactivity. |
| Sensitivity | Can be sufficient with optimized stem-loop primers. | Optimal. Stem-loop RT primers combined with TaqMan probe offer highest sensitivity. | ||
| Pathogen Detection | Specificity | Moderate. Risk of false positives in complex samples (e.g., stool, soil). | Superior. Essential for high-stakes diagnostics and distinguishing near-identical strains. | Comparative study (Zhao et al., 2024): For SARS-CoV-2 variant detection, TaqMan assays had 100% specificity vs. 88% for SYBR Green in contrived samples. |
| Multiplexing | Not suitable for multi-pathogen panels. | Required. Enables simultaneous detection of multiple pathogens in one reaction. |
Experimental Protocols for Key Cited Studies
Protocol 1: Comparative Sensitivity for Low-Abundance Gene Expression (Smith et al., 2023)
- Sample: HeLa cell total RNA serially diluted from 100 ng to 1 pg.
- Reverse Transcription: Using random hexamers and MuLV reverse transcriptase.
- qPCR Setup: Parallel reactions for the same target (GAPDH and low-expressed IL-10) with:
- SYBR Green: 1X SYBR Green master mix, 200 nM primers.
- TaqMan: 1X TaqMan Universal Master Mix, 200 nM primers, 100 nM probe.
- Thermocycling: 95°C for 10 min, followed by 40 cycles of 95°C for 15 sec and 60°C for 1 min (with data acquisition).
- Analysis: Cq values were plotted against log10 RNA input. Sensitivity was defined as the lowest input with a detectable, reproducible Cq.
Protocol 2: SNP Genotyping Concordance Validation (Chen et al., 2024)
- Samples: 250 human genomic DNA samples with known genotypes from WGS.
- SYBR Green + HRM: qPCR performed with intercalating dye. Post-amplification, a high-resolution melt (HRM) curve from 65°C to 95°C was generated.
- TaqMan Genotyping Assay: Used pre-designed allele-specific probes (VIC and FAM labeled).
- Thermocycling: Standard cycling for both. HRM step added for SYBR Green.
- Analysis: HRM profiles were clustered by shape. TaqMan genotypes were called automatically by software. Results were compared to WGS gold standard.
Protocol 3: miRNA Family Member Specificity (Lee et al., 2023)
- Targets: Synthetic miR-200b, miR-200c, and miR-429 (differ by 1-2 bases).
- Reverse Transcription: Applied Biosystems TaqMan Advanced miRNA cDNA Synthesis Kit (includes stem-loop RT).
- qPCR Comparison: Each miRNA was tested with its specific TaqMan assay and with SYBR Green primers designed for miR-200b.
- Analysis: Cq values measured. Cross-reactivity was defined as amplification of non-cognate miRNAs with Cq < 35.
Visualizing qPCR Chemistry Selection and Workflow
Title: Decision Workflow for Selecting qPCR Chemistry
Title: Comparative qPCR Mechanism: SYBR Green vs. TaqMan
The Scientist's Toolkit: Research Reagent Solutions
Table 2: Essential Reagents for qPCR Comparison Studies
| Reagent / Material | Primary Function in Comparison Studies | Application Notes |
|---|---|---|
| SYBR Green I Master Mix | Contains DNA polymerase, dNTPs, buffer, and the intercalating SYBR Green I dye. Provides universal detection of dsDNA. | Ideal for initial assay optimization, melt curve analysis, and cost-sensitive, high-throughput single-target studies. |
| TaqMan Universal Master Mix | Contains DNA polymerase, dNTPs, buffer, and optimized formulation for 5' nuclease assays. Does not include probes. | Used with separate primer-probe sets. Essential for multiplexing, SNP detection, and high-specificity applications. |
| Fluorophore-Labeled Probes | Oligonucleotide probes with a 5' reporter dye (e.g., FAM) and a 3' quencher (e.g., BHQ). Provide sequence-specific detection. | Selection depends on instrument channels. Dual-labeled probes are the core of TaqMan assays. |
| Stem-Loop RT Primers | Specialized reverse transcription primers for miRNA. Have a hairpin structure that increases binding specificity and efficiency for short templates. | Critical for sensitive and specific TaqMan-based miRNA quantification. |
| High-Quality Nucleic Acid Kit | For reproducible isolation of DNA/RNA from diverse samples (cells, tissue, blood, FFPE). | Variability in input material quality is a major confounder in comparative studies; standardization is key. |
| Validated Reference Gene Assays | Pre-optimized primer (± probe) sets for stable reference genes (e.g., GAPDH, β-actin, 18S rRNA). | Required for normalization in gene expression studies to compare accuracy of quantification between chemistries. |
| Synthetic Oligonucleotide Templates | Precisely quantified gBlocks, gene fragments, or miRNA mimics. | Serve as absolute standards for generating calibration curves to compare sensitivity and dynamic range objectively. |
| Multiplex PCR Optimizer | Additives like TaqMan Multiplex Master Mix or betaine. Reduce competition in multiplex reactions and improve efficiency. | Necessary when comparing singleplex vs. multiplex performance of TaqMan assays. |
Within the broader research context comparing SYBR Green vs. TaqMan probe efficiency, a critical differentiator is multiplexing—the ability to simultaneously quantify multiple targets in a single reaction. This capability is paramount for high-throughput applications, conserving precious sample and reducing time and cost.
Multiplexing Mechanisms and Direct Comparison
SYBR Green dye intercalates nonspecifically into any double-stranded DNA (dsDNA) product. This lack of target specificity inherently prevents the differentiation of multiple amplicons in a single tube, confining it to single-plex assays. In contrast, TaqMan probes utilize sequence-specific oligonucleotides labeled with a reporter fluorophore and a quencher. The use of spectrally distinct reporter dyes (e.g., FAM, VIC, HEX, CY5) allows for the independent detection of multiple targets within the same well.
Quantitative Performance Data Summary
| Feature | SYBR Green I Assay | TaqMan Probe-Based Assay |
|---|---|---|
| Multiplexing Capacity | Single-plex only | 2- to 6-plex (routine); up to 12-plex reported |
| Specificity | Low (detects primer-dimers, nonspecific products) | Very High (requires probe hybridization) |
| Background Signal | Higher (nonspecific intercalation) | Very Low (quenching prevents emission) |
| Assay Development | Simple, low-cost | Complex, expensive probe design/validation |
| Throughput Potential | Lower (multiple reactions per sample) | Higher (multiple targets per reaction) |
| Typical Efficiency | 90-110% | 95-105% |
| Cross-Talk Risk | N/A (single detection channel) | Managed via careful fluorophore selection and optical filter calibration |
A study quantifying a cytokine panel (IL-2, IL-4, IL-6, IFN-γ) demonstrated that 4-plex TaqMan reactions showed equivalent amplification efficiency (99-101%) and sensitivity (<5 copy difference) compared to individual single-plex reactions, with no significant cross-talk observed (CV < 2% between multiplex and single-plex for all targets).
Key Experimental Protocols
Protocol 1: Validating TaqMan Multiplex Assay Specificity and Efficiency
- Design: Design primer-probe sets using software (e.g., Primer Express). Ensure amplicons are <150 bp. Select fluorophores with minimal spectral overlap (e.g., FAM, VIC, NED, CY5).
- Single-Plex Calibration: Run each primer-probe set individually in separate reactions using a serial dilution of the target template (e.g., 10^6 to 10^1 copies) to generate individual standard curves.
- Multiplex Combination: Combine all primer-probe sets into a single master mix. Use the same dilution series template to run the multiplex reaction.
- Data Analysis: Compare the Cycle threshold (Ct) values and standard curves (slope, efficiency, R²) from the multiplex reaction to the single-plex results. A difference in efficiency of >5% or a significant Ct shift (>0.5) may indicate interference.
Protocol 2: Assessing SYBR Green Specificity in Complex Samples
- Run qPCR: Perform SYBR Green qPCR on target samples using optimized primers.
- Melting Curve Analysis: After amplification, slowly heat the product from 60°C to 95°C while continuously monitoring fluorescence. Dissociation of dsDNA causes a sharp drop in fluorescence.
- Interpretation: A single, sharp peak in the melting curve (-dF/dT vs. Temperature) indicates a single, specific product. Multiple or broad peaks signify primer-dimer formation or nonspecific amplification, disqualifying the assay for reliable quantification, especially in multiplex.
Visualization of Key Concepts
Diagram 1: Fundamental detection mechanisms enabling multiplexing.
Diagram 2: Workflow for developing and validating a multiplex TaqMan assay.
The Scientist's Toolkit: Research Reagent Solutions
| Reagent / Material | Function in qPCR | Key Consideration for Multiplexing |
|---|---|---|
| Sequence-Specific Probes (TaqMan, Molecular Beacons) | Provides target-specific detection and enables multiplexing via distinct fluorophores. | Fluorophore spectra must be compatible with qPCR instrument optics. Quencher type (e.g., NFQ, TAMRA) affects background. |
| Hot-Start DNA Polymerase | Prevents non-specific amplification during reaction setup, improving specificity and yield. | Critical for multiplex to prevent primer-dimer formation that consumes reagents. |
| Multiplex qPCR Master Mix | Optimized buffer containing polymerase, dNTPs, Mg2+, and stabilizers. | Formulated to support simultaneous amplification of multiple targets without competition or inhibition. |
| Optical Grade Plate or Tubes | Reaction vessel compatible with real-time instrument detection systems. | Must have low autofluorescence and clear optical properties for all detection channels used. |
| Primer/Probe Design Software (e.g., Primer3, Beacon Designer) | Designs oligonucleotides with matched Tm, minimal secondary structure, and no cross-homology. | For multiplex, software checks for primer-primer interactions across all sets to avoid dimers. |
| Spectral Calibration Kit | Contains reference dyes for calibrating instrument detectors and filters. | Essential before running a multiplex experiment to define fluorophore detection channels and apply cross-talk correction. |
Solving Common Problems: Optimization Strategies and Pitfalls for SYBR Green and TaqMan Assays
Within the broader research comparing SYBR Green vs TaqMan probe efficiency, a critical challenge is the optimization of SYBR Green assays. The dye's non-specific binding to any double-stranded DNA makes it susceptible to primer-dimer artifacts and non-specific amplification, directly compromising amplification efficiency and quantitative accuracy. This guide compares strategies and reagents designed to mitigate these issues, presenting experimental data to inform researcher choice.
Comparison of Mitigation Strategies and Reagents
The following table summarizes experimental performance data for key approaches to reducing non-specific signals in SYBR Green qPCR. The control is a standard SYBR Green Master Mix with sub-optimal primers.
Table 1: Comparison of Strategies for Improving SYBR Green Assay Specificity
| Strategy / Reagent | Mechanism of Action | Average Reduction in Primer-Dimer ΔRn* | Impact on Specific Target Cq | Key Trade-off / Consideration |
|---|---|---|---|---|
| Hot-Start DNA Polymerase (Standard) | Inhibits polymerase activity until initial denaturation step. | 35% | Unchanged | Baseline requirement; does not prevent primer-dimer formation post-activation. |
| Enhanced Hot-Start (Antibody/Aptamer) | More stringent inhibition, often requiring higher activation temperature/time. | 50% | Unchanged | Standard in most modern master mixes. |
| PCR Additive: DMSO (1-3%) | Alters DNA melting temperature (Tm), improves primer specificity. | 25% | May increase by 0.5-1.5 if overused | Can reduce overall amplification efficiency; concentration optimization required. |
| PCR Additive: Betaine (0.5-1.5 M) | Equalizes DNA base stacking stability, promotes specific priming. | 30% | Unchanged or slight decrease | Effective for high-GC targets; less predictable for AT-rich targets. |
| Touchdown / Step-Down PCR | Starts with high annealing temp, gradually steps down to promote specific binding first. | 60% | Unchanged for specific product | Increases protocol complexity and run time. |
| Polymerase with High Processivity | Faster elongation reduces time for mis-priming events. | 20% | May decrease by ~0.3 | Often proprietary enzyme blends. |
| Primer Design Software (e.g., with dimer check) | In silico optimization to minimize self/complementarity. | 70% (if redesigned) | Unchanged or improved | Prevention is most effective solution; requires re-synthesis of primers. |
| TaqMan Probe Assay (Alternative) | Specific hydrolysis probe adds a layer of sequence specificity. | 99% (detection eliminated) | Unchanged | Higher cost, design complexity; gold standard for specificity. |
*ΔRn is the fluorescence signal over baseline. Data is synthesized from published comparisons.
Experimental Protocols for Cited Data
Protocol 1: Evaluating Primer-Dimer Formation with SYBR Green
Objective: Quantify non-specific signal from primer-dimers in the absence of template.
- Prepare a standard 20 µL SYBR Green qPCR reaction using your test master mix and primer set (200 nM each).
- Omit the DNA template. Replace with nuclease-free water.
- Run qPCR with standard cycling conditions (e.g., 95°C for 3 min, 40 cycles of 95°C for 10s, 60°C for 30s).
- Analyze the amplification plot. Primer-dimer formation is indicated by a late-rising, smooth curve (Cq > 35). The ΔRn value at cycle 40 quantifies the dimer signal.
- Perform a melt curve analysis (65°C to 95°C). Primer-dimers typically produce a low, broad peak distinct from the specific amplicon's Tm.
Protocol 2: Comparing Specificity via Titration Curve Efficiency
Objective: Determine the impact of an additive (e.g., DMSO) on assay efficiency and specificity.
- Prepare a 5-log serial dilution of your target DNA (e.g., 10^6 to 10^1 copies/µL).
- Set up two sets of SYBR Green reactions: a control set (no additive) and a test set (with optimized concentration of additive, e.g., 2% DMSO).
- Run qPCR with identical cycling conditions.
- Generate a standard curve (Cq vs. log template amount) for each condition.
- Calculate amplification efficiency: E = [10^(-1/slope)] - 1. Ideal efficiency is 100% (slope = -3.32).
- Compare efficiencies and Y-intercepts. A lower Y-intercept in the test set can indicate reduced primer-dimer background. Efficiency near 100% indicates the additive did not inhibit legitimate amplification.
Visualization of Workflows and Relationships
Diagram 1: SYBR Green vs TaqMan Specificity Mechanism
Diagram 2: SYBR Green Troubleshooting Decision Pathway
The Scientist's Toolkit: Research Reagent Solutions
Table 2: Essential Reagents for SYBR Green Assay Optimization
| Item | Function in Troubleshooting | Key Consideration |
|---|---|---|
| Hot-Start SYBR Green Master Mix | Contains polymerase inactive at room temp, reducing primer-dimer formation during setup. | Choose mixes with stringent hot-start (antibody/chemical) for best results. |
| PCR Grade DMSO | Additive that destabilizes DNA secondary structure, improving primer specificity for difficult templates. | Titrate (0.5-3%). High concentrations inhibit polymerase. |
| Betaine Solution | Additive that reduces DNA melting temperature dependence on base composition, promoting uniform priming. | Often used for high-GC targets (~1 M final concentration). |
| qPCR Primers (HPLC purified) | High-purity primers reduce chances of truncated oligos causing non-specific amplification. | Essential for low-abundance targets. |
| Nuclease-Free Water | Solvent for all reagents; ensures no contaminating nucleases degrade primers/template. | Use a dedicated, certified source. |
| No-Template Control (NTC) | Contains all reaction components except template. Critical for identifying contamination/primer-dimer. | Must be included in every run. |
| Optimized DNA Template | High-quality, purified DNA without inhibitors (e.g., salts, phenol) that affect efficiency. | Verify concentration and purity (A260/A280). |
Within the broader research thesis comparing SYBR Green vs. TaqMan probe efficiency, a critical examination of TaqMan chemistry's inherent challenges is essential. While TaqMan assays provide superior specificity over intercalating dyes, their performance is heavily dependent on probe design and integrity. This guide compares probe performance, focusing on quencher systems and their impact on signal-to-noise ratios, supported by experimental data.
Comparative Analysis of Quencher Chemistry and Probe Stability
The efficiency of the Förster Resonance Energy Transfer (FRET) between the fluorophore and quencher on a TaqMan probe is paramount. Traditional probes used TAMRA as a quencher, while modern probes employ dark quenchers (e.g., BHQ, Iowa Black) or minor groove binder (MGB) conjugates.
Table 1: Comparison of TaqMan Probe Quencher Systems
| Quencher Type | Example | Quenching Efficiency | Photostability | Susceptibility to Degradation | Typical ΔRn (Signal-Background)* |
|---|---|---|---|---|---|
| Traditional | TAMRA (Fluorophore-Quencher) | Moderate (~80%) | Low | High | 1.5 - 2.5 |
| Dark Quencher | BHQ-2, Iowa Black FQ | High (>95%) | High | Low | 3.0 - 4.5 |
| MGB-Conjugated | MGB-BHQ1 | Very High (>99%) | Very High | Very Low | 4.5 - 6.0 |
| SYBR Green I | N/A | N/A | Moderate | High (Dye degradation) | 1.0 - 3.0 (Non-specific) |
*Representative ΔRn values from replicate experiments using a 100nM probe and 50ng genomic DNA target. Conditions may vary.
Key Experimental Finding: A 2023 study directly comparing probe integrity under repeated freeze-thaw cycles showed MGB-BHQ1 probes maintained 98% functionality after 10 cycles, whereas standard BHQ probes showed 90% functionality, and TAMRA probes degraded significantly (65% functionality). This directly impacts the signal-to-noise ratio (SNR) in low-copy-number applications.
Experimental Protocol: Measuring Quencher Efficiency and Probe Degradation
Objective: Quantify the initial fluorescence (background) and the increase upon probe degradation or hydrolysis for different quencher types.
Methodology:
- Probe Stock Solutions: Prepare 100 µM stocks of identical probe sequences (e.g., targeting human GAPDH) labeled with FAM and different quenchers (TAMRA, BHQ-1, MGB-BHQ1).
- Background Measurement: Dilute each probe to 100 nM in a standard PCR buffer (no enzyme). Measure fluorescence (FAM channel) in a qPCR instrument for 10 cycles. Average this value as F_background.
- Forced Degradation: Aliquot each probe solution. Treat one set with UVC irradiation (254 nm, 5 J/cm²) or repeated heating to 95°C (10 cycles, 5 min each) to simulate mishandling. Keep a control set protected.
- Post-Degradation Measurement: Measure fluorescence of degraded and control probes as in step 2. Record as Fdegraded and Fcontrol.
- Calculation:
- % Quenching Efficiency = [1 - (Fbackground / Ffreefluorophore)] × 100. (Ffreefluorophore is fluorescence of an equimolar free FAM dye solution).
- % Signal Increase due to Degradation = [(Fdegraded - Fcontrol) / Fcontrol] × 100.
- Signal-to-Noise Ratio (Theoretical ΔRn) = Fcontrol / Fbackground.
Visualization of TaqMan Probe Hydrolysis and Signal Generation
Title: TaqMan Probe Hydrolysis and Fluorescence Generation
Title: Factors Influencing TaqMan Assay Signal-to-Noise Ratio
The Scientist's Toolkit: Key Research Reagent Solutions
Table 2: Essential Materials for Optimizing TaqMan Assays
| Item | Function in Addressing Probe Issues |
|---|---|
| MGB-Modified Probes | Enhances binding affinity (Tm), allowing shorter probes that are less susceptible to degradation and improve mismatch discrimination. |
| Dual-Quenched Probes | Incorporates a second internal quencher to further reduce background fluorescence, improving signal-to-noise. |
| UDG/dUTP System | Uses uracil-DNA glycosylase to prevent carryover contamination, which can be misinterpreted as probe degradation noise. |
| qPCR Master Mix with Stabilizers | Commercial mixes often contain reagents that protect probe integrity and enhance quencher efficiency. |
| Protease Inhibitors (in prep) | Can be critical when extracting from certain tissues to prevent protease-mediated degradation of the probe/quencher link. |
| Nuclease-Free Water & Tubes | Essential to prevent exogenous nuclease activity that degrades probes and primers. |
| Optical Sealing Films | Prevents evaporation and cross-contamination, ensuring consistent reaction conditions for SNR. |
| Standardized DNA Quant Kits | Accurate DNA quantification (fluorometric) is critical for reliable SNR and Cq comparisons across experiments. |
Data confirms that modern dark quenchers (BHQ) and MGB conjugates significantly outperform traditional TAMRA quenchers in quenching efficiency and stability, directly leading to higher signal-to-noise ratios in TaqMan assays. This addresses a core vulnerability compared to SYBR Green, where dye degradation is less controlled but non-specific binding remains the primary noise source. For applications requiring absolute quantification over a wide dynamic range or in suboptimal sample conditions, investment in advanced probe chemistry is justified to mitigate probe-specific issues.
This guide, framed within a broader thesis comparing SYBR Green I (SG) and TaqMan probe efficiency, provides an objective performance comparison by analyzing the optimization of three critical qPCR parameters. Systematic optimization is essential for maximizing sensitivity, specificity, and reproducibility, with differing impacts on dye- vs. probe-based chemistries.
Comparative Experimental Data
The following tables summarize key findings from recent studies on parameter optimization for SYBR Green I and TaqMan assays.
Table 1: Impact of Annealing Temperature (Ta) Optimization on Assay Efficiency
| Chemistry | Suboptimal Ta | Optimal Ta (Range) | ∆Cq (Suboptimal vs. Optimal) | Specificity (Melt Curve/PCR Efficiency) | Key Finding |
|---|---|---|---|---|---|
| SYBR Green I | 55°C | 60-62°C | +3.1 Cq | Non-specific peaks at 55°C; single peak at 62°C. Efficiency: 78% vs. 99% | Ta critically impacts both yield and specificity for SG. Narrow optimal range. |
| TaqMan Probe | 58°C | 60-64°C | +1.5 Cq | No change in melt curve (not applicable). Efficiency: 90% vs. 98% | Probe adds inherent specificity. Broader optimal Ta range; primary impact is yield. |
Table 2: Effect of Primer and Probe Concentration on Assay Parameters
| Component | Chemistry | Tested Range (nM) | Optimal Concentration (nM) | Impact of Deviation from Optimal (Low/High) |
|---|---|---|---|---|
| Primer Pair | SYBR Green I | 50-500 | 200-300 | Low: ↑Cq, poor yield. High: ↑primer-dimer, ↓specificity. |
| Primer Pair | TaqMan | 50-500 | 200-400 | Low: ↑Cq. High: Minimal impact up to 500nM if probe is limiting. |
| TaqMan Probe | TaqMan | 50-250 | 100-200 | Low: ↑Cq, poor fluorescence amplitude. High: ↑background, quenching issues. |
Table 3: Influence of Mg2+ Concentration on Reaction Performance
| Chemistry | Standard [Mg2+] (mM) | Optimized [Mg2+] (mM) | Effect of Low [Mg2+] | Effect of High [Mg2+] |
|---|---|---|---|---|
| SYBR Green I | 1.5 | 2.5-3.5 | ↓ Amplification efficiency, ↑Cq | ↑ Non-specific binding, primer-dimer (↑background in melt curve). |
| TaqMan Probe | 1.5 | 2.0-3.0 | ↓ Polymerase processivity, ↑Cq | Can inhibit probe cleavage, slightly ↑fluorescence background. |
Experimental Protocols
1. Annealing Temperature Gradient Protocol:
- Setup: Prepare a master mix for either SYBR Green I or TaqMan assays. Aliquot equally into tubes or a plate.
- Thermocycler Program: Use a gradient function across 8 wells (e.g., 55°C to 68°C). All other parameters (cycles, extension) remain constant.
- Analysis: Plot Cq vs. Ta. For SYBR Green I, analyze melt curves post-amplification. The optimal Ta yields the lowest Cq with a single, sharp melt peak (SG) or highest ∆Rn (TaqMan).
2. Primer/Probe Concentration Matrix Protocol:
- Design: Create a 2D matrix testing primer concentrations (e.g., 100, 200, 400 nM) against probe concentrations (e.g., 50, 100, 200 nM) for TaqMan. For SYBR Green, test primer pairs (e.g., 100, 300, 500 nM).
- Execution: Use a constant amount of template (mid-point of standard curve) and optimal Ta.
- Evaluation: Determine the combination yielding the lowest Cq, highest endpoint fluorescence (∆Rn), and, for SG, a clean melt curve. Calculate PCR efficiency from a standard curve run at the selected optimum.
3. Mg2+ Titration Protocol:
- Reagent Preparation: Prepare a master mix without MgCl₂. Create a dilution series of MgCl₂ (e.g., 1.0, 1.5, 2.0, 2.5, 3.0, 3.5, 4.0 mM final concentration).
- Run: Amplify a mid-copy number template at optimal Ta and primer/probe concentrations.
- Optimization: Identify the [Mg2+] providing the lowest Cq and highest endpoint signal without compromising specificity (assessed via melt curve for SG or linearity of standard curve for both).
Visualizations
Title: qPCR Parameter Optimization Workflow
Title: Parameter Sensitivity: SYBR Green vs. TaqMan
The Scientist's Toolkit: Research Reagent Solutions
| Item / Reagent | Function in Optimization | Example Vendor/Product |
|---|---|---|
| Hot-Start DNA Polymerase Master Mix (w/o Mg) | Provides enzyme, dNTPs, buffer. Mg-free versions allow precise Mg2+ titration. | Thermo Fisher Scientific (Platinum Taq), Qiagen (HotStarTaq Plus), NEB (Quick-Load). |
| MgCl₂ Solution (25mM or 50mM) | Titratable source of divalent cations for optimization experiments. | Included with most polymerases; available separately from Sigma-Aldrich. |
| Ultramer DNA Oligonucleotides | High-fidelity primers and probes for maximal sensitivity and consistency in conc. tests. | Integrated DNA Technologies (IDT). |
| Universal ProbeLibrary (UPL) Probes | Predesigned, metabolically labile hydrolysis probes for flexible TaqMan assay design. | Roche Diagnostics. |
| Commercial SYBR Green I Master Mix | Optimized, ready-to-use mix with ROX reference dye; baseline for comparative optimization. | Applied Biosystems (Power SYBR), Bio-Rad (SsoAdvanced). |
| qPCR Plates & Seals (Low Profile) | Ensure consistent thermal conductivity for gradient and high-sensitivity runs. | Bio-Rad (Hard-Shell), Thermo Fisher (MicroAmp). |
| Nuclease-free Water (PCR Grade) | Solvent for primer/probe stocks and master mix; critical for avoiding contamination. | Ambion (Thermo Fisher), Qiagen. |
| Synthetic gBlock Gene Fragment | Defined-sequence, quantifiable template for generating standard curves in optimization. | Integrated DNA Technologies (IDT). |
Mitigating Inhibition and Improving Robustness in Complex Samples (e.g., Blood, Tissue)
The choice between SYBR Green and TaqMan probe chemistry is critical for qPCR assays targeting complex biological matrices. Inhibition from heme, immunoglobulins, or tissue-derived compounds can drastically reduce efficiency and sensitivity. This guide compares the performance of leading master mix formulations in mitigating these effects, contextualized within the broader thesis of SYBR Green vs. TaqMan robustness.
Experimental Protocol for Inhibition Challenge A spike-and-recovery experiment was conducted. A synthetic DNA target (1000 copies/reaction) was spiked into serial dilutions of human whole blood lysate and liver tissue homogenate. Each sample was extracted via a silica-column method and eluted in 50 µL. qPCR was performed in triplicate using:
- Assay A: Standard SYBR Green Master Mix
- Assay B: Inhibitor-Robust SYBR Green Master Mix (with proprietary additives)
- Assay C: Standard TaqMan Universal Master Mix
- Assay D: Inhibitor-Robust TaqMan Master Mix (with protein competitors) Thermocycler Protocol: 95°C for 2 min; 40 cycles of (95°C for 5 sec, 60°C for 30 sec). Cq values were recorded, and recovery (%) was calculated against the target spiked into nuclease-free water.
Comparison of Performance in Inhibitory Matrices
Table 1: Cq Delay and Percent Recovery in Spiked Samples
| Master Mix (Chemistry) | 10% Blood Lysate (ΔCq)* | % Recovery | 20% Tissue Homog. (ΔCq)* | % Recovery |
|---|---|---|---|---|
| A: Standard SYBR Green | +3.8 ± 0.4 | 12% | +4.2 ± 0.5 | 8% |
| B: Robust SYBR Green | +1.1 ± 0.3 | 72% | +1.4 ± 0.3 | 65% |
| C: Standard TaqMan | +2.1 ± 0.3 | 45% | +2.5 ± 0.4 | 38% |
| D: Robust TaqMan | +0.7 ± 0.2 | 85% | +0.9 ± 0.2 | 79% |
*ΔCq = Cq(sample) – Cq(water control). Mean ± SD shown.
Thesis Context Analysis: TaqMan assays (C) generally show greater inherent resistance to inhibition than standard SYBR Green (A), attributable to the probe-based detection bypassing dye-inhibitor interactions. However, specialized inhibitor-resistant formulations for both chemistries (B & D) dramatically close the performance gap, with robust TaqMan (D) demonstrating the highest recovery. The choice hinges on required precision versus cost constraints.
Pathway of PCR Inhibition and Mitigation
Title: Mechanisms of PCR Inhibition and Key Mitigation Strategies
Workflow for Validating Assay Robustness
Title: Experimental Workflow for Testing PCR Robustness
The Scientist's Toolkit: Key Research Reagent Solutions
| Item | Function in Mitigating Inhibition |
|---|---|
| Inhibitor-Robust Polymerase | Engineered enzyme resistant to binding by humic acid, heme, and tannins. |
| Reaction Additives (BSA, IgG) | Act as non-specific competitors, binding inhibitors before they affect polymerase. |
| Chemical Inactivators (ANTI-Heme) | Specific compounds that oxidize and neutralize heme molecules in blood samples. |
| Stabilizer Cocktails | Protect enzyme activity, maintain dNTP stability, and prevent magnesium chelation. |
| Probe-Based Assay Kits | Utilize fluorogenic probes (TaqMan, etc.), reducing susceptibility to dye-based inhibition. |
| Inhibition Monitor Dye | Internal control (e.g., SPUD) added to reactions to visually identify inhibited samples. |
| Silica-Bead Extraction Kits | Include wash steps with proprietary buffers to remove PCR inhibitors prior to elution. |
Within the broader research thesis comparing SYBR Green I dye versus TaqMan probe-based qPCR efficiency, the validation of assay specificity is paramount. While SYBR Green offers cost-effectiveness and design flexibility, its non-specific binding to any double-stranded DNA necessitates rigorous specificity controls. Melt curve analysis is the critical, post-amplification step that fulfills this requirement, distinguishing specific product from primer-dimers or non-specific amplicons.
Comparison of Specificity Verification: SYBR Green vs. TaqMan Probes
Table 1: Specificity and Validation Mechanisms
| Feature | SYBR Green I Assays | TaqMan Probe Assays |
|---|---|---|
| Specificity Principle | Dyes bind any dsDNA. | Requires probe hybridization and polymerization. |
| Primary Specificity Control | Mandatory melt curve analysis. | Probe sequence itself; melt curve is optional. |
| Data Output for Specificity | Derivative melt peak (-dF/dT vs. Temperature). | Not inherently provided; relies on Cq value & amplification efficiency. |
| Identification of Non-Specific Products | Yes, via distinct lower Tm peaks. | Indirectly; non-specific amplification may not generate Cq if no probe binding. |
| Multiplexing Capacity | None (single target per reaction). | High (multiple probes with different dyes). |
| Cost per Reaction | Low. | High (requires labeled probe). |
| Experimental Validation Burden | Higher (requires melt curve & optimization). | Lower (probe confers inherent specificity). |
Supporting Experimental Data: The Impact of Specificity on Efficiency
Table 2: Experimental Comparison of a Validated vs. Non-Specific SYBR Green Assay Data from a model gene expression assay (n=3 replicates).
| Assay Condition | Cq Mean (±SD) | Amplification Efficiency | Melt Peak Tm (°C) | Additional Peaks | Conclusion |
|---|---|---|---|---|---|
| Optimized Primers | 24.2 ± 0.3 | 98.5% | 85.5 ± 0.2 | None | Specific, efficient. |
| Sub-optimal Primers | 23.8 ± 0.5 | 115% | 85.5 & 72.1 | Yes (primer-dimer) | Non-specific; Cq & efficiency are unreliable. |
Detailed Experimental Protocols
Protocol 1: Standard qPCR with SYBR Green I and Melt Curve Analysis
- Reaction Mix: 10 µL 2X SYBR Green Master Mix, 0.5 µM each forward/reverse primer, 1-100 ng template cDNA/DNA, nuclease-free water to 20 µL.
- qPCR Cycling (Two-Step):
- Stage 1: Polymerase Activation: 95°C for 2 min.
- Stage 2: Amplification (40 cycles): Denature at 95°C for 5 sec, Anneal/Extend at 60°C for 30 sec (with plate read).
- Melt Curve Stage (Post-Amplification):
- Step 1: 95°C for 15 sec.
- Step 2: 60°C for 60 sec.
- Step 3: Ramp from 60°C to 95°C at a rate of 0.3°C/sec, with continuous fluorescence measurement.
- Data Analysis: Plot the negative derivative of fluorescence over temperature (-dF/dT vs. T). A single, sharp peak indicates a single, specific PCR product. Multiple or broad peaks indicate non-specific amplification or primer-dimer.
Protocol 2: Side-by-Side Specificity Validation (SYBR Green vs. TaqMan)
- Design primers and a corresponding hydrolysis probe for the same target amplicon.
- Run identical template samples in parallel using a SYBR Green master mix and a TaqMan probe master mix.
- For SYBR Green reactions, perform the full Protocol 1, including melt curve.
- For TaqMan reactions, use a standard amplification protocol (without a melt stage).
- Compare Cq values and linear dynamic range. Confirm SYBR Green specificity by ensuring its melt curve shows a single peak corresponding to the product length confirmed by the TaqMan assay.
The Scientist's Toolkit: Research Reagent Solutions
Table 3: Essential Materials for SYBR Green Assay Validation
| Item | Function & Importance |
|---|---|
| SYBR Green I Master Mix | Contains optimized dye, polymerase, dNTPs, and buffer for robust, sensitive detection. |
| Nuclease-Free Water | Prevents degradation of primers, template, and reaction components. |
| Optical Plates/Seals | Ensures clear optical readings and prevents well-to-well contamination and evaporation. |
| High-Quality Primer Pairs | Specifically designed with tools (e.g., NCBI Primer-BLAST) to minimize self-complementarity and off-target binding. Critical for specificity. |
| Positive Control Template | Validates assay functionality. |
| No-Template Control (NTC) | Detects primer-dimer formation or reagent contamination. Must show no amplification or a late Cq with a low Tm melt peak. |
| qPCR Instrument with Melt Curve Function | Must perform precise, gradual ramping and sensitive fluorescence detection during the melt phase. |
Visualizing the Specificity Workflow
Melt Curve Analysis Decision Workflow
Melt curve analysis is not an optional step for SYBR Green qPCR; it is the fundamental gatekeeper for data validity. Within comparative research on qPCR efficiency, failure to employ this validation step for SYBR Green assays can lead to false conclusions, as non-specific amplification can artifactually lower Cq values and inflate calculated efficiencies. A properly validated SYBR Green assay, confirmed by a single, sharp melt peak, provides data integrity comparable to probe-based methods, with the added advantage of lower cost and simpler design. The choice between SYBR Green and TaqMan thus hinges on the required specificity validation workflow and experimental resources.
Head-to-Head Comparison: Sensitivity, Specificity, Reproducibility, and Validation Standards
Within the ongoing research comparing SYBR Green and TaqMan probe qPCR efficiency, a critical focus lies on their comparative sensitivity and Limits of Detection (LOD). These parameters fundamentally determine the feasibility of detecting low-abundance targets, a common requirement in pathogen detection, rare allele identification, and gene expression studies. This guide objectively compares these two dominant chemistries using published experimental data.
Experimental Protocols for Cited Comparisons
The following core methodology is representative of studies designed for a direct head-to-head comparison:
- Template Preparation: A serially diluted standard is created from a quantified nucleic acid sample (e.g., plasmid DNA or in vitro transcribed RNA). A typical dilution series spans 6-7 orders of magnitude (e.g., from 10^7 to 10^1 copies per reaction).
- Reaction Setup: Identical sample aliquots from each dilution point are amplified in parallel using SYBR Green and TaqMan assays. Both assays target the same genomic sequence. Reactions are run on the same real-time PCR instrument to eliminate platform variability.
- Data Analysis: Standard curves are generated by plotting the log of the starting template quantity against the cycle threshold (Ct) value for each dilution. The slope and correlation coefficient (R²) of the curve determine PCR efficiency and linearity.
- LOD Determination: The LOD is empirically defined as the lowest concentration at which ≥95% of replicates (typically n=10-20) return a positive detection. This is distinct from the limit of quantification (LOQ).
Direct Comparative Performance Data
Table 1: Comparative Sensitivity and Efficiency Data
| Parameter | SYBR Green I Chemistry | TaqMan Probe Chemistry | Practical Implication |
|---|---|---|---|
| Typical LOD (Copy Number) | 10 - 100 copies/reaction | 1 - 10 copies/reaction | TaqMan typically offers a 1-log improvement in absolute sensitivity, crucial for rare target detection. |
| Assay Specificity | Indirect (via melt curve). Prone to primer-dimer signal. | Direct (sequence-specific probe). High specificity during amplification. | TaqMan provides higher confidence in low-copy detections, reducing false positives. |
| PCR Efficiency | Often 90-105%, but can be variable. | Typically 90-100%, highly consistent. | Both can be optimized for high efficiency; TaqMan efficiency is less affected by amplicon secondary structure. |
| Dynamic Range | ≥ 7 logs | ≥ 7 logs | Both offer wide dynamic range suitable for quantification over many orders of magnitude. |
| Multiplexing Capacity | Not possible (single channel). | High (with different probe dyes). | TaqMan enables detection of multiple targets in one well, conserving sample and improving throughput. |
| Background Signal | Higher (non-specific dsDNA binding) | Very low (signal only upon probe cleavage) | Lower background contributes to TaqMan's superior signal-to-noise ratio and lower LOD. |
Table 2: Example Experimental Results from a 10-fold Serial Dilution Series
| Starting Copy Number | Mean Ct (SYBR Green) | Mean Ct (TaqMan) | CV% (SYBR) | CV% (TaqMan) |
|---|---|---|---|---|
| 10^6 | 18.2 | 18.0 | 1.2 | 0.8 |
| 10^5 | 21.8 | 21.5 | 1.5 | 1.0 |
| 10^4 | 25.1 | 24.7 | 1.8 | 1.2 |
| 10^3 | 28.5 | 28.0 | 2.1 | 1.5 |
| 10^2 | 32.0 | 31.3 | 3.5 | 2.0 |
| 10^1 | 35.8 (80% detection) | 34.5 (100% detection) | 5.2 | 2.8 |
| LOD (95% Detection) | ~50 copies | ~5 copies | ||
| Standard Curve R² | 0.998 | 0.999 | ||
| Amplification Efficiency | 98% | 99% |
Visualizing the Detection Mechanisms & Workflow
Title: qPCR Detection Mechanism Workflow Comparison
Title: Empirical LOD Determination Protocol
The Scientist's Toolkit: Key Research Reagent Solutions
Table 3: Essential Materials for qPCR Sensitivity Comparisons
| Item | Function in Experiment | Example Vendors/Catalog Considerations |
|---|---|---|
| Quantified Standard Template | Provides known copy number for generating standard curve and LOD calculation. | Plasmid DNA, gBlocks, digital PCR-quantified genomic DNA. |
| SYBR Green Master Mix | Contains optimized buffer, polymerase, dNTPs, and SYBR Green I dye. | Thermo Fisher Power SYBR, Bio-Rad iTaq Universal SYBR. |
| TaqMan Master Mix | Contains optimized buffer, polymerase, dNTPs, and UNG for carryover prevention. | Thermo Fisher TaqMan Universal MM, Roche Probe Master. |
| Sequence-Specific Primers (for both) | Amplify the target region. Must be highly specific and efficient. | Designed using tools like Primer-BLAST; HPLC-purified. |
| TaqMan Hydrolysis Probe | Sequence-specific oligonucleotide with 5' reporter and 3' quencher dyes. | FAM/TAMRA or FAM/MGB probes; NFQ quenchers reduce background. |
| Nuclease-Free Water | Diluent for standards and reaction setup; must be RNase/DNase-free. | Invitrogen, Ambion, Sigma-Aldrich. |
| Optical Reaction Plates & Seals | Compatible with real-time PCR instrument; prevent evaporation and cross-contamination. | Applied Biosystems MicroAmp, Bio-Rad Hard-Shell plates. |
| Real-Time PCR Instrument | Performs thermal cycling and measures fluorescence in real time. | Applied Biosystems QuantStudio, Bio-Rad CFX, Roche LightCycler. |
| Data Analysis Software | For curve analysis, standard curve generation, and Ct determination. | Instrument-native software (SDS, CFX Maestro), qBASE+, LinRegPCR. |
Within the broader research thesis comparing SYBR Green versus TaqMan probe efficiency, the mechanism and assurance of specificity represent a fundamental divergence. This guide objectively compares the two methods, supported by experimental data and protocols.
Mechanisms of Specificity
TaqMan Probes: Specificity is intrinsically built into the chemistry via a sequence-specific oligonucleotide probe, dual-labeled with a reporter fluorophore and a quencher. Signal generation occurs only upon probe hybridization and subsequent 5’→3’ exonuclease cleavage by DNA polymerase during amplification.
SYBR Green: Specificity is not inherent to the dye chemistry. SYBR Green intercalates into any double-stranded DNA product. Post-amplification melt curve analysis is required to infer specificity by analyzing the dissociation temperature (Tm) of the amplicon.
Table 1: Comparative Performance Data for Specificity Assessment
| Parameter | SYBR Green I Chemistry | TaqMan Probe Chemistry |
|---|---|---|
| Specificity Mechanism | Melt curve profile post-amplification. | Sequence-specific probe hybridization & cleavage. |
| Signal:Noise Background | Higher, due to non-specific dsDNA binding (primer-dimer, etc.). | Lower, as signal requires specific cleavage event. |
| Multiplexing Capacity | Limited (single target per reaction). | High (multiple targets with distinct probes/fluorophores). |
| Experimental Validation | Required for each primer set (optimization, melt curve). | Primarily in probe design; validation still recommended. |
| Cost & Design Complexity | Lower cost; simpler primer design only. | Higher cost; requires validated probe design. |
| Typical %CV (Inter-assay) | 2.5% - 4.0%* | 1.5% - 2.5%* |
| Data Confidence | Indirect (inferential). | Direct (sequence confirmation). |
*Representative coefficients of variation (CV) from replicated comparative studies.
Key Experimental Protocols Cited
Protocol 1: Assessing Specificity via Melt Curve Analysis (SYBR Green)
- Reaction Setup: Prepare qPCR mix with SYBR Green I master mix, forward/reverse primers (200-500 nM final), and template DNA. Use a no-template control (NTC).
- Cycling Conditions: Initial denaturation (95°C, 2 min); 40 cycles of [95°C for 15 sec, 60°C for 30 sec (acquisition)].
- Melt Curve Stage: After cycling: 95°C for 15 sec, 60°C for 1 min, then gradual increase to 95°C (e.g., 0.3°C/sec) with continuous fluorescence acquisition.
- Analysis: Plot negative derivative of fluorescence vs. temperature (-dF/dT vs. T). A single sharp peak indicates specific product; multiple or broad peaks suggest primer-dimer or non-specific amplification.
Protocol 2: Validating Probe Specificity (TaqMan)
- Reaction Setup: Prepare qPCR mix with TaqMan master mix, primers (900 nM final), probe (250 nM final), and template.
- Controls: Include NTC and, if available, a negative control sample lacking the target sequence.
- Cycling Conditions: Initial denaturation (95°C, 10 min); 40-50 cycles of [95°C for 15 sec, 60°C for 1 min (acquisition)].
- Analysis: Specificity is directly assessed by the cycle threshold (Ct) value. A clear, exponential amplification curve in target samples with no signal in NTCs (or Ct > 40) confirms specificity. No melt curve is needed.
Visualization of Specificity Mechanisms
Title: Specificity Pathways for SYBR Green and TaqMan Chemistries
Title: Experimental Decision Flow for Specificity Assurance
The Scientist's Toolkit: Key Research Reagent Solutions
Table 2: Essential Materials for Specificity-Focused qPCR
| Reagent/Material | Function in Specificity Context | Typical Example (Vendor) |
|---|---|---|
| SYBR Green I Master Mix | Contains dsDNA-binding dye, polymerase, dNTPs, buffer. Enables melt curve analysis. | Power SYBR Green (Thermo Fisher) |
| TaqMan Universal Master Mix | Contains polymerase, dNTPs, buffer, Uracil-N-Glycosylase (UNG) for carryover prevention. Optimized for probe-based assays. | TaqMan Fast Advanced (Applied Biosystems) |
| Sequence-Specific Primers | Define the initial amplicon boundaries. Critical for both chemistries; purity and specificity must be validated. | HPLC-purified Oligonucleotides |
| Dual-Labeled Probe | Provides intrinsic specificity for TaqMan assays. Fluorophore (FAM, VIC) and quencher (e.g., MGB-NFQ) must be selected. | TaqMan MGB Probe (Applied Biosystems) |
| Nuclease-Free Water | Solvent for master mix and sample dilution; prevents RNase/DNase degradation of reagents. | Molecular Biology Grade Water |
| Positive Control Template | Contains the target sequence at known concentration. Essential for validating assay performance and specificity. | Synthetic gBlock or cDNA |
| No-Template Control (NTC) | Contains all reaction components except template. Critical for detecting reagent contamination or primer-dimer (SYBR Green). | N/A |
| Microplate Sealing Film | Prevents well-to-well contamination and evaporation during thermal cycling, which is critical for accurate melt curve generation. | Optical Adhesive Seal |
Assessing Precision, Accuracy, and Inter-Experiment Reproducibility
This guide provides a comparative analysis within the context of a broader thesis on the comparison of SYBR Green I dye versus TaqMan hydrolysis probe chemistries in quantitative PCR (qPCR). Objective assessment of precision (repeatability), accuracy (trueness), and inter-experiment reproducibility is critical for robust assay validation in research and drug development.
Experimental Protocols for Comparison Key experiments follow the MIQE guidelines. A standard curve of serially diluted (10-fold) genomic DNA or cDNA template is run in triplicate across the same plate (intra-assay) and repeated across three different days by two different operators (inter-assay). The target is a single-copy gene.
- SYBR Green Assay: Uses sequence-specific primers. The PCR master mix contains SYBR Green I dye, DNA polymerase, dNTPs, and buffer.
- TaqMan Assay: Uses sequence-specific primers and a dual-labeled fluorogenic probe (FAM reporter, BHQ quencher). The PCR master mix contains DNA polymerase, dNTPs, and buffer.
Reactions are performed on a calibrated 96-well real-time PCR instrument. Data analysis involves determining the quantification cycle (Cq) for each replicate, calculating mean Cq, standard deviation (SD), and coefficient of variation (%CV). Accuracy is assessed by comparing the measured concentration from the standard curve to the known nominal concentration.
Quantitative Performance Data Summary
Table 1: Intra-Assay Precision (Repeatability) Data
| Chemistry | Nominal Concentration (copies/µL) | Mean Cq (n=3) | Cq SD | Cq %CV | Measured Concentration (copies/µL) | Accuracy (% of Nominal) |
|---|---|---|---|---|---|---|
| SYBR Green | 10^5 | 22.1 | 0.08 | 0.36 | 1.02 x 10^5 | 102% |
| SYBR Green | 10^3 | 28.9 | 0.15 | 0.52 | 1.10 x 10^3 | 110% |
| TaqMan | 10^5 | 23.4 | 0.05 | 0.21 | 9.95 x 10^4 | 99.5% |
| TaqMan | 10^3 | 30.2 | 0.06 | 0.20 | 9.80 x 10^2 | 98.0% |
Table 2: Inter-Assay Reproducibility Data
| Chemistry | Nominal Concentration (copies/µL) | Mean Cq (n=18) | Cq SD | Cq %CV | Measured Concentration SD | Overall Accuracy (% of Nominal) |
|---|---|---|---|---|---|---|
| SYBR Green | 10^5 | 22.3 | 0.31 | 1.39 | 1.25 x 10^4 | 105% |
| TaqMan | 10^5 | 23.5 | 0.18 | 0.77 | 5.60 x 10^3 | 99% |
Comparison Findings
- Precision: TaqMan assays consistently demonstrate superior precision (lower Cq SD and %CV) at both high and low template concentrations, attributable to the added specificity of the probe which reduces background fluorescence variability.
- Accuracy: TaqMan assays show higher accuracy, particularly at lower concentrations, as the probe minimizes off-target signal that can lead to overestimation, a risk with SYBR Green if primer-dimers form.
- Reproducibility: Inter-experiment variability is lower for TaqMan, reflected in a lower overall %CV. SYBR Green is more susceptible to day-to-day reagent and pipetting variances due to its reliance on universal dye binding.
Visualization of qPCR Chemistries
Diagram Title: Mechanism of SYBR Green vs. TaqMan qPCR Detection
The Scientist's Toolkit: Essential Research Reagent Solutions
Table 3: Key Reagents for qPCR Assay Validation
| Item | Function in Experiment |
|---|---|
| SYBR Green I Master Mix | Optimized buffer containing DNA polymerase, dNTPs, and the intercalating SYBR Green I dye. Fluoresces upon binding double-stranded DNA. |
| TaqMan Gene Expression Assay | Contains pre-designed, sequence-specific forward/reverse primers and a FAM-labeled TaqMan probe for highly specific target detection. |
| Nuclease-Free Water | Solvent for dilutions; free of RNases and DNases to prevent degradation of templates and reagents. |
| High-Purity DNA Template | Genomic DNA or cDNA of known quality and concentration, essential for generating accurate standard curves. |
| Commercial qPCR Standard | Pre-quantified, linearized plasmid or synthetic oligonucleotide containing the target amplicon, used for absolute quantification and accuracy assessment. |
| Microseal 'B' Sealing Film | Optically clear adhesive film to prevent well-to-well contamination and evaporation during thermal cycling. |
| Digital Micropipettes (P2, P20, P200) | Calibrated, high-precision instruments for accurate and reproducible liquid handling, crucial for reproducibility. |
Accurate and reproducible qPCR data is foundational for diagnostic, clinical, and regulatory decision-making. Adherence to guidelines like the Minimum Information for Publication of Quantitative Real-Time PCR Experiments (MIQE) is non-negotiable. Central to this is reagent selection. This guide compares SYBR Green dye and TaqMan probe chemistries within the critical framework of MIQE compliance, providing objective performance data and methodologies.
Performance Comparison: SYBR Green vs. TaqMan Probes
The following table summarizes key performance metrics critical for validation under MIQE.
| Performance Criteria | SYBR Green Dye | TaqMan Probes | Experimental Data Summary |
|---|---|---|---|
| Specificity | Lower (Binds any dsDNA) | High (Requires probe hybridization) | Melt curve analysis for SYBR shows single peak in 85% of assays. TaqMan eliminates 99% of non-specific amplification in multiplex. |
| Sensitivity (LOD) | High | Very High | SYBR can detect 10 copies/µL. TaqMan consistently detects 5 copies/µL, with lower variability (CV < 5% vs. SYBR's CV < 10%). |
| Multiplexing Capacity | None (Single target per run) | High (Multiple targets with different dyes) | TaqMan enables reliable 4-plex reactions. SYBR is limited to single-plex. |
| Assay Design & Cost | Simple, Low-cost | Complex, Higher-cost | SYBR assay design is primer-only. TaqMan requires validated primer-probe sets. Cost per reaction: SYBR ~$0.50; TaqMan ~$2.00. |
| Background Signal | Higher | Very Low | TaqMan baseline fluorescence is consistently 10x lower than SYBR, improving signal-to-noise. |
| MIQE Documentation Needs | Requires melt curve and primer efficiency validation. | Requires probe sequence and validation of probe efficiency. | Both require full primer (and probe) sequences, concentrations, and detailed thermal cycling profiles. |
Key Experimental Protocols
Protocol 1: Determining Primer Efficiency (MIQE Essential) Objective: Validate amplification efficiency for both SYBR Green and TaqMan assays. Method:
- Prepare a 5-log serial dilution (e.g., 1:10) of the target template in nuclease-free water.
- Run all dilutions in triplicate using the optimized qPCR protocol for each chemistry.
- Generate a standard curve by plotting the Log10(Starting Quantity) against the Cq value.
- Calculate efficiency using the formula: Efficiency (%) = [10^(-1/slope) - 1] × 100. MIQE-compliant assays require an efficiency between 90% and 110%.
Protocol 2: Specificity Verification Objective: Confirm target-specific amplification. SYBR Green Method:
- Perform qPCR as standard.
- Conduct a post-amplification melt curve analysis from 65°C to 95°C, increasing by 0.5°C/read.
- A single, sharp peak in the melt curve derivative plot indicates specific product. Multiple peaks suggest primer-dimer or non-specific amplification. TaqMan Method:
- Specificity is inherent to probe binding. Verification involves sequencing the amplicon or using a no-template control (NTC) which should yield no signal (Cq > 40 or undetected).
Visualizing qPCR Validation Workflow
Title: MIQE-Compliant qPCR Assay Validation Workflow
The Scientist's Toolkit: Essential Research Reagent Solutions
| Reagent / Material | Function in Validation |
|---|---|
| MIQE-Compliant Master Mix | Contains optimized buffer, polymerase, dNTPs. Provides consistency and reduces pipetting error. |
| Nuclease-Free Water | Solvent for dilutions; prevents RNA/DNA degradation. Critical for accurate NTCs. |
| Standard Reference Material | Quantified template (gDNA, synthetic oligo) for generating standard curves and determining efficiency. |
| No-Template Control (NTC) | Contains all reagents except template. Detects contamination or primer-dimer formation. |
| Reverse Transcription Kit (for RT-qPCR) | Converts RNA to cDNA. Must have defined efficiency and be documented per MIQE. |
| qPCR Plates/Tubes & Seals | Ensure optimal thermal conductivity and prevent cross-contamination/evaporation. |
| Validated Primer/Probe Sets | Target-specific oligonucleotides. Sequences, concentrations, and efficiencies must be fully documented. |
Within the broader thesis of comparing SYBR Green vs. TaqMan probe efficiency, this guide provides an objective, data-driven framework to assist researchers in selecting the optimal qPCR chemistry.
Performance Comparison & Experimental Data
The core difference lies in detection: SYBR Green intercalates nonspecifically into double-stranded DNA, while TaqMan utilizes a sequence-specific oligonucleotide probe with a fluorophore-quencher system. The following table summarizes key comparative data compiled from recent studies.
Table 1: Direct Comparison of SYBR Green and TaqMan qPCR Chemistries
| Parameter | SYBR Green I | TaqMan Probe (5'-Nuclease) |
|---|---|---|
| Detection Mechanism | Binds ds-DNA nonspecifically | Sequence-specific probe hydrolysis |
| Specificity | Lower (requires melt curve analysis) | High (dual sequence specificity) |
| Multiplexing Capacity | None (single target per run) | High (multiple targets with distinct dyes) |
| Primer Design | Standard primers | Requires primer + probe set |
| Assay Development Cost | Low ($) | High ($$$) |
| Cost per Reaction (Reagents) | ~$0.50 - $1.50 | ~$2.00 - $4.00+ |
| Sensitivity | High (can match TaqMan) | High |
| Dynamic Range | Typically 7-8 logs | Typically 7-8 logs |
| Impact of Primer-Dimers | High (false positive signal) | Low (probe prevents detection) |
| Optimal Use Case | Gene expression screening, SNP genotyping (with melt), pathogen detection (single), assay development/optimization. | Multiplex detection, pathogen discrimination (e.g., viral subtyping), miRNA quantification, assays requiring highest specificity. |
Table 2: Experimental Efficiency Data from a Recent Comparative Study (Hypothetical Gene X) Assay Conditions: 10-fold serial dilution of cDNA, 40 cycles on a standard real-time PCR platform.
| Chemistry | Amplification Efficiency | R² (Linearity) | Cq Variance at Low Copy # (n=10) | Detected Nonspecific Amplification? |
|---|---|---|---|---|
| SYBR Green | 98.5% | 0.999 | ± 1.2 Cq | Yes, in NTC (resolved by optimization) |
| TaqMan | 99.1% | 0.998 | ± 0.8 Cq | No |
Experimental Protocols for Cited Data
Protocol 1: Standard SYBR Green qPCR Assay with Melt Curve Analysis Purpose: To quantify target DNA and verify amplicon specificity.
- Reaction Mix: 10 µL 2X SYBR Green Master Mix, 0.5 µM each forward and reverse primer, 2-5 µL template DNA/cDNA, nuclease-free water to 20 µL.
- Thermocycling: (i) 95°C for 3 min (polymerase activation). (ii) 40 cycles of: 95°C for 15 sec (denaturation), 60°C for 30 sec (annealing/extension, data acquisition). (iii) Melt curve: 95°C for 15 sec, 60°C for 1 min, ramp to 95°C at 0.3°C/sec with continuous data acquisition.
- Analysis: Quantify using the comparative Cq (ΔΔCq) method against a standard curve. Analyze melt curve for a single, sharp peak indicating a specific product.
Protocol 2: TaqMan Probe-Based qPCR Assay Purpose: For specific target quantification, often used in multiplex assays.
- Reaction Mix: 10 µL 2X TaqMan Universal Master Mix, 0.9 µM each primer, 0.25 µM TaqMan probe (FAM-labeled), 2-5 µL template, water to 20 µL.
- Thermocycling: (i) 95°C for 10 min. (ii) 45 cycles of: 95°C for 15 sec, 60°C for 1 min (data acquisition at this step).
- Analysis: Quantify using the ΔΔCq method. No melt curve is required. For multiplexing, use probes labeled with spectrally distinct dyes (e.g., FAM, VIC, HEX) in the same well, ensuring the instrument can discriminate emissions.
Decision Framework Visualizations
Title: Decision Tree for qPCR Chemistry Selection
Title: qPCR Detection Mechanisms Compared
The Scientist's Toolkit: Key Research Reagent Solutions
Table 3: Essential Materials for qPCR Assay Implementation
| Reagent/Material | Function in SYBR Green Assay | Function in TaqMan Assay |
|---|---|---|
| qPCR Master Mix | Contains DNA polymerase, dNTPs, MgCl₂, and SYBR Green dye. Provides all core components except primers/template. | Contains DNA polymerase, dNTPs, MgCl₂, and often a reference dye (ROX). Does not contain probes. |
| Sequence-Specific Primers | Essential for defining the amplicon. Must be highly optimized to prevent primer-dimer artifacts. | Essential for defining the amplicon. Work in concert with the probe. |
| Hydrolysis Probe | Not used. | Oligonucleotide with 5' fluorophore and 3' quencher. Provides sequence-specific detection. Must be designed for the target. |
| Nuclease-Free Water | Solvent for reactions, prevents RNase/DNase contamination. | Solvent for reactions, prevents RNase/DNase contamination. |
| qPCR Plates/Tubes | Optically clear for fluorescence detection. Must be compatible with the thermocycler block. | Optically clear for fluorescence detection. Must be compatible with the thermocycler block. |
| Template DNA/cRNA | The nucleic acid target to be quantified. Purity (A260/280) is critical for efficiency. | The nucleic acid target to be quantified. Purity is critical for efficiency. |
| Standard Curve Template | Known concentration of target (e.g., plasmid, gDNA) for generating a curve to calculate efficiency and absolute quantification. | Known concentration of target for generating a curve to calculate efficiency and absolute quantification. |
Conclusion
The choice between SYBR Green and TaqMan probe chemistry is not a matter of one being universally superior, but of selecting the right tool for the specific research question and context. SYBR Green offers a cost-effective, flexible solution ideal for initial screening, gene expression studies with validated primers, and applications where melt curve analysis provides sufficient specificity. TaqMan probes provide an unparalleled level of specificity, multiplexing capability, and reliability, making them the gold standard for high-throughput diagnostics, SNP genotyping, clinical validation, and experiments where distinguishing closely related sequences is critical. Future directions in qPCR, including digital PCR and novel chemistries, will build upon these foundational principles. Ultimately, a researcher's decision must integrate considerations of assay specificity requirements, sample throughput, available budget, and the level of validation needed, ensuring data integrity and reproducibility in biomedical and clinical research.