Mastering DNA Extraction: Essential Techniques for Cell Lysis, Purification, and Elution in Modern Research
This comprehensive guide details the fundamental pillars of DNA extraction—cell lysis, purification, and elution—tailored for researchers, scientists, and drug development professionals.
Mastering DNA Extraction: Essential Techniques for Cell Lysis, Purification, and Elution in Modern Research
Abstract
This comprehensive guide details the fundamental pillars of DNA extraction—cell lysis, purification, and elution—tailored for researchers, scientists, and drug development professionals. It progresses from foundational principles to advanced methodological applications, troubleshooting common pitfalls, and validating results through comparative analysis. The article serves as a practical resource for optimizing nucleic acid isolation to meet the stringent demands of downstream applications including sequencing, PCR, and genomic analysis in biomedical and clinical contexts.
The Core Principles of DNA Extraction: From Cellular Integrity to Pure Nucleic Acids
Abstract The fidelity of any molecular biology investigation is predicated on the integrity of its starting material. High-quality DNA, characterized by high molecular weight, purity, and accurate quantification, is the fundamental substrate for downstream analyses. This whitepaper, framed within the core thesis of DNA extraction (cell lysis, purification, elution), details the technical rationale for quality, presents current quantitative benchmarks, and provides detailed protocols for assessment, underscoring its non-negotiable role in generating reliable, reproducible research data critical for scientific discovery and drug development.
The Impact of DNA Quality on Downstream Applications
Compromised DNA quality directly propagates errors through experimental workflows, leading to costly false conclusions.
Table 1: Impact of DNA Quality Parameters on Key Applications
| DNA Quality Parameter | PCR/ qPCR | Next-Generation Sequencing (NGS) | Microarrays | Cloning |
|---|---|---|---|---|
| Purity (A260/A280) | Optimal: 1.8-2.0. Low (<1.8) inhibits Taq polymerase; High (>2.0) indicates RNA contamination. | Critical for library prep efficiency. Deviations cause failed adaptor ligation or biased sequencing. | Essential for consistent hybridization. Contaminants cause high background & poor signal. | Critical for enzyme-based steps (restriction, ligation). Contaminants reduce efficiency. |
| Integrity (DV200) | Less critical for short amplicons (<500 bp). | Critical: DV200 >70% is a standard minimum for WGS. Fragmentation causes library bias & coverage gaps. | Critical: Requires high molecular weight DNA for representative fragmentation. | Requires high integrity for large insert cloning. |
| Concentration Accuracy | Under-quantification leads to failed reactions; over-quantification causes inhibition. | Precise normalization is key for multiplexing and sequencing depth uniformity. Inaccuracy wastes resources. | Precise concentration ensures optimal spotting and hybridization. | Required for correct vector:insert ratios. |
| Inhibitors (e.g., salts, phenols, ethanol) | Severe inhibition, manifested as delayed Cq or complete failure. | Inhibit library preparation enzymes, leading to low yield or failed runs. | Cause non-specific binding and high background noise. | Inhibit restriction enzymes and ligases. |
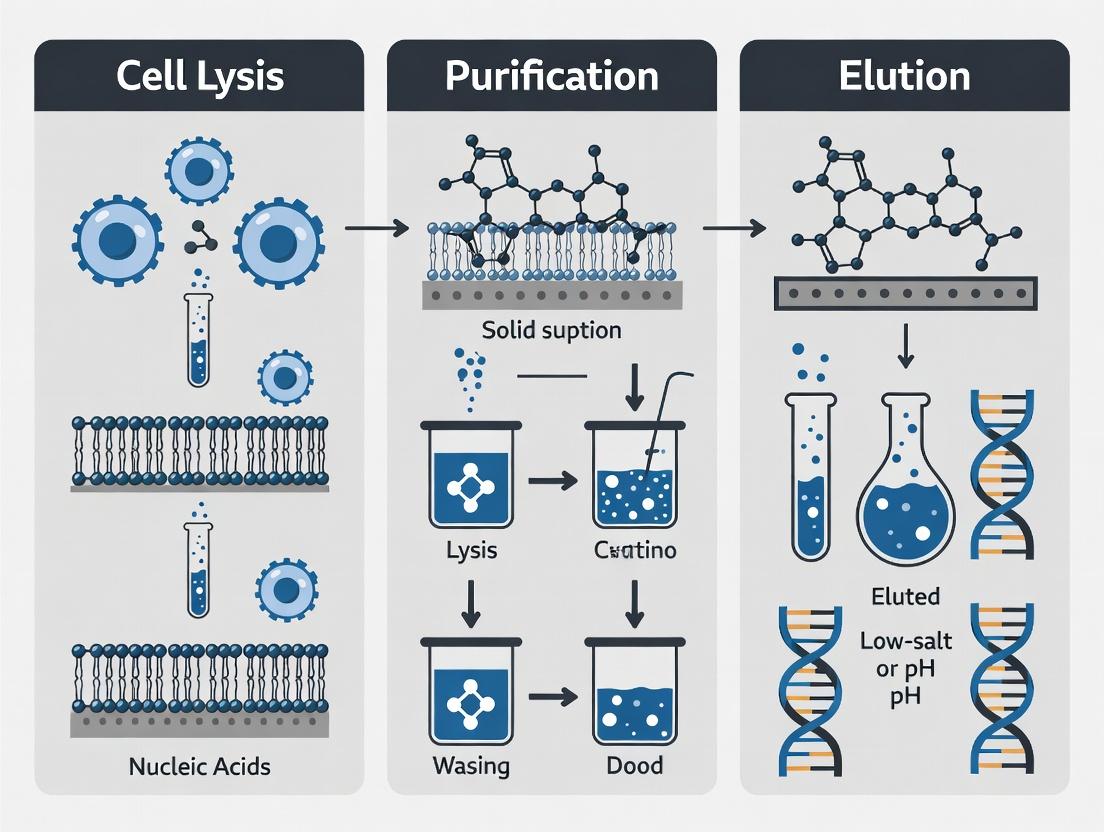
Core Principles: The Extraction Thesis (Lysis, Purification, Elution)
Every extraction method must optimally execute three core steps to yield high-quality DNA.
Diagram 1: DNA Extraction Core Workflow
2.1 Cell Lysis Objective: Disrupt cellular and nuclear membranes to release nucleic acids. Detailed Protocol (Guanidinium-Thiocyanate/Phenol-Chloroform):
- Homogenize tissue or pellet 5x10^6 cells in 1 ml of TRIzol or similar reagent.
- Incubate 5 min at room temperature (RT) for complete dissociation.
- Add 0.2 ml chloroform per 1 ml TRIzol, cap tightly, and shake vigorously for 15 sec.
- Incubate at RT for 2-3 min.
- Centrifuge at 12,000 x g for 15 min at 4°C. The mixture separates into: a red phenol-chloroform (lower), interphase, and a colorless upper aqueous phase containing RNA. DNA remains in the interphase and organic phase.
- Remove the aqueous phase for RNA. Precipitate DNA from the interphase/organic phase with 0.3 ml 100% ethanol. Mix and centrifuge briefly.
- Wash the DNA-containing pellet with 1 ml of 0.1 M sodium citrate in 10% ethanol, then with 75% ethanol. Centrifuge between washes.
- Solubilize the final DNA pellet in 1 ml of 8 mM NaOH.
2.2 Purification Objective: Separate DNA from contaminants (proteins, lipids, carbohydrates, and RNA). Detailed Protocol (Silica-Membrane Column):
- Adjust the lysate from step 2.1 to binding conditions (e.g., add high-concentration chaotropic salt like guanidine HCl).
- Apply the mixture to a silica-membrane spin column and centrifuge at >10,000 x g for 1 min. DNA binds selectively to the silica in the presence of chaotropic salts.
- Discard flow-through. Wash the membrane twice with 700 µl of wash buffer (typically ethanol-based). Centrifuge at high speed for 1 min, then 2-3 min with an empty spin to dry the membrane completely. This removes salts and other impurities.
2.3 Elution Objective: Release purified DNA from the binding matrix in a low-ionic-strength, pH-stable buffer. Detailed Protocol:
- Apply 50-100 µl of elution buffer (10 mM Tris-HCl, pH 8.5, or nuclease-free water pre-warmed to 55°C) directly to the center of the dry silica membrane.
- Let it stand at RT for 2-5 minutes to allow complete hydration and diffusion.
- Centrifuge at maximum speed for 1 minute to collect the eluted DNA. Elution volume and buffer pH critically impact final concentration and stability.
Standardized Assessment of DNA Quality
Table 2: Quantitative Metrics for DNA Quality Assessment
| Metric | Method | Ideal Value | Acceptable Range | Instrument/Kit Example |
|---|---|---|---|---|
| Concentration | Fluorometric (dsDNA-specific) | Application-dependent | N/A | Qubit, PicoGreen |
| Purity (A260/A280) | UV Spectrophotometry | ~1.8 | 1.7 - 2.0 | NanoDrop |
| Purity (A260/A230) | UV Spectrophotometry | ~2.0 - 2.2 | >1.8 | NanoDrop |
| Integrity (RIN/DIN) | Capillary Electrophoresis | 10 (RNA), 10 (DNA) | >7 for most NGS | Bioanalyzer, TapeStation |
| Fragment Distribution | Electrophoresis/QC | Sharp high MW band | DV200 > 70% for FFPE | Fragment Analyzer |
Diagram 2: DNA Quality Assessment Decision Pathway
The Scientist's Toolkit: Research Reagent Solutions
Table 3: Essential Reagents for High-Quality DNA Extraction & QC
| Reagent/Material | Function | Key Consideration |
|---|---|---|
| Lysis Buffer (w/ Proteinase K) | Digests nucleoprotein complexes and inactivates nucleases. | Essential for tough samples (tissue, FFPE). Activity is temperature and pH-dependent. |
| Chaotropic Salts (e.g., Guanidine HCl) | Denature proteins, facilitate nucleic acid binding to silica. | Critical for purification efficiency. Concentration must be optimized. |
| Silica-Membrane Columns | Selective binding of DNA in high-salt, elution in low-salt conditions. | Membrane quality and binding capacity define yield and scalability. |
| RNase A | Digests contaminating RNA, crucial for accurate DNA quantification and purity. | Must be DNase-free. Incubation time (5-15 min at RT) is sufficient. |
| Elution Buffer (TE or Tris pH 8.5) | Stabilizes eluted DNA. TE prevents acid hydrolysis but can inhibit some enzymes. | For long-term storage, use TE (pH 8.0). For enzyme reactions, use Tris or water. |
| Fluorometric dsDNA Dye (PicoGreen) | Binds specifically to dsDNA, enabling accurate quantitation free of RNA/ssDNA. | More accurate than A260 for complex samples. Requires a dedicated fluorometer. |
| Capillary Electrophoresis Chips | Provides digital electrophoretogram for integrity (RIN/DIN) and sizing. | The gold standard for pre-NGS QC. Higher sensitivity than gels. |
In DNA extraction research, the process is axiomatically reduced to three core steps: Lysis, Purification, and Elution. This deconstruction, however, often obfuscates their profound interdependence. This whitepaper posits that these steps are not discrete, sequential modules but a tightly coupled system where the optimization of one fundamentally dictates the parameters and success of the others. The efficacy of the final eluate—its yield, purity, and integrity—is the emergent property of this triad, not the sum of its parts. Framed within the broader thesis of DNA extraction fundamentals, this guide details the technical specifications, quantitative trade-offs, and experimental protocols that define this synergy.
The Triad Deconstructed: Mechanisms and Interdependencies
Cell Lysis: The Initiating Event
Lysis disrupts cellular and nuclear membranes to release nucleic acids. The method chosen directly determines the composition of the lysate, setting the stage for all subsequent purification challenges.
Key Methods & Reagents:
- Mechanical Lysis (Bead Beating, Grinding): Effective for tough tissues (plant, fungal). Generates heat and fine particulate debris.
- Chemical Lysis (Detergents e.g., SDS): Disrupts lipid membranes. Incompatible with silica-based purification if not adequately diluted or neutralized.
- Enzymatic Lysis (Proteinase K, Lysozyme): Digests proteins and cell walls. Requires incubation and subsequent enzyme inactivation.
Table 1: Impact of Lysis Method on Downstream Purification
| Lysis Method | Key Contaminants Introduced | Primary Downstream Challenge | Compatible Purification Chemistry |
|---|---|---|---|
| Mechanical (Bead Mill) | Cellular debris, sheared genomic DNA, particulates | Clogging of columns, co-precipitation of gDNA | Silica-column (post-filtration), Magnetic beads |
| Alkaline-SDS (Chemical) | Denatured proteins, lipids, SDS detergent | SDS inhibits silica-binding; requires pH neutralization | Ethanol-precipitation, Silica (post-neutralization) |
| Enzymatic (Proteinase K) | Digested peptides, enzymes | Inactivation of enzyme required for binding | All methods (post-inactivation) |
Purification: The Selective Isolation
Purification separates DNA from the lysate cocktail. Its success is wholly dependent on the lysate's state.
Core Principles:
- Silica-Binding: Under high chaotropic salt (e.g., guanidine HCl) and low pH conditions, DNA binds to silica membranes. Detergents, alcohols, and pH from the lysis step must be compatible.
- Magnetic Bead Binding: Paramagnetic beads coated with silica or other ligands bind DNA in high PEG/salt conditions. Efficient binding requires a clean lysate free of excessive particulates.
- Precipitation: Alcohol precipitation (ethanol/isopropanol) requires relatively pure, concentrated DNA and low detergent contamination.
Detailed Protocol: Silica-Column Purification Post-Alkaline Lysis
- Neutralization: Combine alkaline lysate with a neutralization/binding buffer (e.g., containing guanidine HCl and acetic acid). This adjusts pH to ~5-6, creating conditions for silica binding while precipitating SDS, proteins, and cellular debris.
- Binding: Apply the mixture to the silica column. Centrifuge at >10,000 x g for 30-60 seconds. DNA adsorbs to the membrane; contaminants pass through.
- Washing: Perform two wash steps:
- Wash 1 (High Salt): Buffer containing salt and ethanol removes residual proteins and salts.
- Wash 2 (Low Salt/Ethanol): 70-80% ethanol removes remaining salts and prepares the matrix for elution. Centrifuge thoroughly after each wash to dry the membrane (~2 min at max speed).
Elution: The Final Constraint
Elution is the controlled release of purified DNA. Its efficiency is constrained by the purification chemistry and the nature of the bound DNA.
Critical Factors:
- Eluent: Low-ionic-strength buffer (TE, nuclease-free water) or alkali. Water's low pH (<7.0) can reduce yield.
- Volume: Smaller volumes (e.g., 50 µL) increase concentration but may reduce total yield. Elution volume must be optimized for the binding surface area (column/bead size).
- Incubation: Allowing the eluent to incubate on the membrane/beads for 1-5 minutes increases yield.
- Temperature: Elution at 55-70°C significantly improves the recovery of high-molecular-weight DNA.
Table 2: Quantitative Impact of Elution Conditions on DNA Yield
| Elution Condition | Variable | Typical Yield Impact vs. Standard* | Notes |
|---|---|---|---|
| Standard | 100µL TE, RT, 1 min incubation | 100% (Baseline) | Baseline for comparison. |
| Warmed Eluent | 100µL TE, 70°C, 1 min incubation | +15% to +40% | Critical for high-MW DNA; may elute more contaminants. |
| Double Elution | 2 x 50µL TE, RT | +10% to +20% | Increases total yield but dilutes final product. |
| Low Ionic Strength | Nuclease-free H₂O, RT | -5% to -20% | pH-dependent; DNA less stable for long-term storage. |
| Extended Incubation | 100µL TE, RT, 5 min incubation | +5% to +15% | Simple, cost-effective yield improvement. |
*Impact varies based on sample type and purification scale.
Visualizing the Interdependent Workflow
Diagram 1: The DNA Extraction Triad Interdependence Map
Diagram 2: Silica-Column Protocol for Alkaline Lysates
The Scientist's Toolkit: Essential Reagent Solutions
Table 3: Key Research Reagents for DNA Extraction Optimization
| Reagent / Material | Core Function | Role in the Triad |
|---|---|---|
| Proteinase K | Serine protease; digests proteins and inactivates nucleases. | Lysis: Enzymatic disruption of cellular structures. Must be inactivated (heat) before silica purification. |
| Guanidine Hydrochloride (GuHCl) | Chaotropic salt; denatures proteins, facilitates DNA-silica binding. | Purification: Key component of binding buffers for silica columns/magnetic beads. Efficiency depends on lysate pH. |
| Silica-Membrane Mini Columns | Solid-phase support for selective DNA adsorption. | Purification: Physical matrix for binding/washing. Pore size and surface area determine binding capacity and flow dynamics. |
| Magnetic Silica Beads | Paramagnetic particles functionalized with silica. | Purification: Enable high-throughput, solution-based purification. Binding efficiency is highly sensitive to PEG/salt concentration from lysate. |
| TE Buffer (pH 8.0-8.5) | 10 mM Tris-HCl, 1 mM EDTA. Maintains DNA stability. | Elution: Optimal low-ionic-strength eluent. Tris buffers pH; EDTA chelates Mg²⁺ to inhibit nucleases. |
| RNase A | Ribonuclease that degrades RNA. | Purification (Add-on): Added during or after lysis to remove RNA contamination, crucial for sequencing applications. |
| Carrier RNA (e.g., Poly-A RNA) | Co-precipitating agent. | Purification (Low-abundance): Added to lysis/binding buffer to improve recovery of low-concentration DNA (e.g., cfDNA). |
| SPRI (Solid Phase Reversible Immobilization) Beads | Magnetic beads with size-selective binding properties. | Purification/Size Selection: Enable automated cleanup and precise size selection of DNA fragments (e.g., for NGS libraries). |
Within the fundamental workflow of nucleic acid extraction—comprising cell lysis, purification, and elution—success is dictated by decisions made prior to the first experimental step. This guide examines the four pivotal pre-extraction considerations: Sample Type, Yield, Purity, and Integrity. These parameters are interdependent and fundamentally constrain downstream research, diagnostic, and drug development applications.
Sample Type: The Foundational Variable
The biological source material dictates the choice of extraction protocol, required reagents, and expected outcomes.
Key Sample Categories and Implications:
- Fresh/Frozen Tissues: Require mechanical homogenization or enzymatic digestion (e.g., proteinase K) for complete lysis. Yield and integrity are generally high but depend on ischemic time and freezing protocols.
- Blood: Common sources include whole blood (nucleated cells), buffy coat (enriched white blood cells), or plasma/serum (cell-free DNA). Anticoagulants (EDTA, citrate, heparin) can inhibit downstream enzymatic reactions if not removed.
- Cultured Cells: Typically yield high-quality DNA with simple lysis. Adherent cells often require scraping or trypsinization.
- Formalin-Fixed Paraffin-Embedded (FFPE) Tissues: Present significant challenges due to protein-DNA crosslinks and fragmentation. Protocols require specialized deparaffinization and crosslink reversal steps.
- Microbial & Plant Cells: Often require robust mechanical lysis (bead beating, sonication) to break tough cell walls, which risks shearing genomic DNA.
- Saliva/Buccal Swabs: Convenient but yield lower quantities of DNA, often with bacterial contamination.
Table 1: Impact of Sample Type on Extraction Strategy
| Sample Type | Primary Lysis Challenge | Key Protocol Adaptation | Risk to Integrity |
|---|---|---|---|
| Fresh Tissue | Physical disruption | Mechanical homogenization | Moderate (shearing) |
| FFPE Tissue | Protein-DNA crosslinks | Xylene/Heat-induced deparaffinization; Extended proteinase K digestion | High (inherently fragmented) |
| Whole Blood | Inhibition from anticoagulants | Chelating agents; Multiple wash steps | Low |
| Gram+ Bacteria | Rigid cell wall | Lysozyme + bead beating | High (shearing) |
| Plant Leaf | Polysaccharides, polyphenols | CTAB-based lysis; Polyvinylpyrrolidone (PVP) | Moderate |
Yield: Quantifying Nucleic Acid Recovery
Yield, measured in mass (µg, ng) or concentration (ng/µL), must be sufficient for downstream assays. Expected yield varies dramatically by sample type and input amount.
Table 2: Typical DNA Yields from Common Sample Sources
| Sample Source | Typical Starting Material | Expected DNA Yield Range (Human) | Key Yield-Limiting Factor |
|---|---|---|---|
| Whole Blood | 1 mL | 20 - 50 µg | White blood cell count |
| Buccal Swab | 1 swab | 10 - 100 µg | Collection efficiency, epithelial cell count |
| Cultured Cells (HeLa) | 10^6 cells | 5 - 15 µg | Cell viability, growth phase |
| Mouse Tail Clip | 2-5 mm | 50 - 200 µg | Digestion efficiency |
| FFPE Section | 10 µm section | 0.5 - 5 µg | Fixation time, age of block |
| Plant Leaf | 100 mg | 10 - 100 µg | Polysaccharide co-precipitation |
Protocol: Fluorometric Quantification of Yield using Qubit
- Principle: Fluorometric dyes bind specifically to DNA, minimizing interference from RNA or contaminants.
- Materials: Qubit fluorometer, Qubit dsDNA HS Assay Kit, assay tubes, sample DNA.
- Steps:
- Prepare the working solution by diluting the Qubit dsDNA HS reagent 1:200 in the provided buffer.
- Prepare standards (0 ng/µL and 10 ng/µL) by adding 190 µL of working solution to 10 µL of each standard.
- For samples, add 199 µL of working solution to 1 µL of sample (or a volume containing expected 1-100 ng DNA).
- Vortex all tubes for 2-3 seconds, incubate at room temperature for 2 minutes.
- Read on the Qubit fluorometer using the "dsDNA HS" assay setting.
- Calculate concentration based on the standard curve.
Purity: Assessing Contaminant Interference
Purity is assessed spectrophotometrically by absorbance ratios (A260/A280 and A260/A230). Contaminants inhibit enzymes in PCR, sequencing, and restriction digests.
Table 3: Spectrophotometric Purity Assessment
| Absorbance Ratio | Ideal Value | Common Contaminants Indicated by Low Ratio |
|---|---|---|
| A260/A280 | ~1.8 (DNA), ~2.0 (RNA) | Protein (absorbance at 280 nm) |
| A260/A230 | 2.0 - 2.2 | Salts, chaotropic agents, phenols, carbohydrates |
Protocol: Spectrophotometric Assessment (NanoDrop)
- Principle: Nucleic acids absorb UV light at 260 nm, proteins at 280 nm, and organic contaminants at 230 nm.
- Steps:
- Initialize the spectrophotometer and perform a blank measurement with the elution buffer.
- Clean the pedestal. Pipette 1-2 µL of sample onto the lower measurement surface.
- Lower the arm, ensure the sample forms a column. Click "Measure."
- Record the concentration (ng/µL) and purity ratios (A260/280 & A260/230).
- Clean the pedestal thoroughly between samples.
Integrity: Evaluating Molecular Size and Degradation
Integrity confirms the nucleic acid is undegraded and suitable for long-range PCR, cloning, or Southern blotting.
Protocol: Agarose Gel Electrophoresis for Integrity Check
- Materials: Agarose, TAE or TBE buffer, DNA ladder (1 kb+, genomic), gel loading dye, ethidium bromide or SYBR Safe, gel electrophoresis system, UV transilluminator.
- Steps:
- Prepare a 0.8-1.0% agarose gel by melting agarose in buffer, cooling, adding nucleic acid stain, and pouring into a casting tray with a comb.
- Once solidified, place the gel in an electrophoresis chamber filled with buffer (covering the gel).
- Mix 100-500 ng of DNA sample with 6X loading dye. Load the mixture and an appropriate DNA ladder into wells.
- Run the gel at 4-6 V/cm until the dye front migrates 2/3 of the gel length.
- Visualize under UV light. Intact genomic DNA appears as a single, high-molecular-weight band near the well. RNA integrity (RIN) is assessed via capillary electrophoresis (Bioanalyzer/TapeStation).
Table 4: Integrity Analysis Methods
| Method | Principle | Sample Required | Output Metric |
|---|---|---|---|
| Agarose Gel Electrophoresis | Size-based separation in electric field | 100-500 ng | Visual banding pattern |
| Bioanalyzer/TapeStation (Lab-on-a-chip) | Electrokinetic separation and fluorescence detection | 1-5 ng | RNA Integrity Number (RIN), DNA Integrity Number (DIN) |
| qPCR Long-Amplicon Assay | Amplification efficiency of long vs. short targets | 1-50 ng | Degradation Index (DI) |
The Scientist's Toolkit: Research Reagent Solutions
Table 5: Essential Reagents for Nucleic Acid Extraction & QC
| Reagent/Material | Primary Function | Key Consideration |
|---|---|---|
| Proteinase K | Serine protease; digests histones and nucleases, facilitating lysis and protecting nucleic acids. | Activity is calcium-dependent; often requires incubation at 56°C. |
| RNase A (for DNA prep) | Degrades unwanted RNA co-purified with DNA. | Must be DNase-free. Heat to 100°C for 15 min to inactivate DNases if present. |
| DNase I (for RNA prep) | Degrades genomic DNA contamination in RNA preps. | Requires Mg2+ or Mn2+ ions; inhibited by EDTA. |
| Chaotropic Salts (e.g., Guanidine HCl) | Denature proteins, inhibit nucleases, and promote binding to silica membranes. | Highly corrosive; proper waste disposal required. |
| Silica-Membrane Columns | Selective binding of nucleic acids in high-salt, wash, and elution in low-salt/water. | Binding capacity is finite; overloading reduces yield and purity. |
| Magnetic Beads (SPRI) | Paramagnetic particles coated with carboxyl groups bind DNA in PEG/high-salt conditions. | Enable high-throughput, automated purification. Bead size impacts yield. |
| Phase Lock Gel Tubes | Facilitate phenol:chloroform separation by forming a physical barrier between aqueous and organic phases. | Increases recovery and minimizes organic phase carryover. |
| Carrier RNA (e.g., Glycogen) | Co-precipitates with trace nucleic acids to visible pellets, improving recovery from low-concentration samples. | Can interfere with downstream enzymatic reactions if in excess. |
| Fluorometric Assay Dye (e.g., Qubit dye) | Binds specifically to dsDNA, ssDNA, or RNA, enabling accurate quantitation. | More specific than A260 but requires dedicated instrument. |
Visualizing the Interdependence of Pre-Extraction Variables
Title: Sample Type Drives Lysis Choice, Affecting Yield, Purity & Integrity
Title: Pre-Extraction Considerations Guide the Core Extraction Workflow
This technical guide details the fundamental reagents used in cell lysis buffers, the critical first step in DNA extraction workflows for research and drug development. Effective lysis, framed within the broader DNA extraction paradigm (lysis, purification, elution), hinges on the strategic selection and combination of detergents, enzymes, salts, and solvents. This whitepaper provides an in-depth analysis of each component's mechanism, quantitative performance data, and standardized protocols to enable robust and reproducible nucleic acid isolation.
Core Reagent Classes: Mechanisms and Selection
Detergents
Detergents solubilize lipid bilayers by disrupting hydrophobic interactions. Selection is based on the ionic nature and required stringency.
- Ionic (e.g., SDS, Sodium Deoxycholate): Disrupt hydrogen bonds and denature proteins; highly effective for tough tissues but can inhibit downstream enzymes if not removed.
- Non-ionic (e.g., Triton X-100, NP-40): Mild disruption of lipid-lipid and lipid-protein interactions; preserves protein complexes and enzyme activity.
- Zwitterionic (e.g., CHAPS): Maintains solubility of membrane proteins while being less denaturing than ionic detergents.
Enzymes
Enzymes provide targeted digestion of specific cell wall or membrane components, reducing the need for harsh chemical lysis.
- Lysozyme: Hydrolyzes β-1,4-glycosidic bonds in bacterial peptidoglycan.
- Proteinase K: A broad-spectrum serine protease that inactivates nucleases and digests histones; essential for tissue and Gram-positive bacterial lysis.
- Metalloproteases & Glycanases: Used for specialized applications (e.g., yeast, plant cells).
Salts
Salts modulate ionic strength and osmolarity, stabilize DNA, and facilitate reagent interactions.
- Chaotropic Salts (e.g., Guanidine HCl): Disrupt hydrogen bonding, denature proteins, and promote nucleic acid binding to silica matrices in subsequent purification steps.
- Ionic Strength Modulators (e.g., NaCl, KCl): Maintain osmotic balance to prevent organelle rupture and can neutralize negatively charged backbone phosphates, reducing electrostatic repulsion.
Solvents
Organic solvents precipitate proteins and lipids and can permeabilize membranes.
- Phenol:Chloroform: Classic agent for protein denaturation and removal via phase separation.
- Alcohols (e.g., Ethanol, Isopropanol): Used for nucleic acid precipitation and washing.
Table 1: Common Detergents in Lysis Buffers
| Detergent | Type | Typical Working Conc. | Critical Micelle Conc. (mM) | Primary Use Case | Downstream Compatibility Notes |
|---|---|---|---|---|---|
| SDS | Ionic | 0.1-2% | 7-10 | General lysis, tough tissues | Inhibits PCR; must be removed |
| Triton X-100 | Non-ionic | 0.1-1% | 0.2-0.9 | Cell membrane lysis, nuclei isolation | Compatible with many enzymes |
| NP-40 | Non-ionic | 0.1-1% | 0.3 | Cytoplasmic extraction | Similar to Triton X-100 |
| CHAPS | Zwitterionic | 0.5-5% | 6-10 | Membrane protein studies | Low UV absorbance |
Table 2: Key Enzymes for Targeted Lysis
| Enzyme | Optimal pH | Optimal Temp. | Common Conc. | Inhibitors/Requirements | Target Substrate |
|---|---|---|---|---|---|
| Lysozyme | 6.0-8.0 | 20-37°C | 0.1-10 mg/mL | EDTA (reduces efficacy) | Bacterial Peptidoglycan |
| Proteinase K | 7.5-8.0 | 50-56°C | 50-800 µg/mL | PMSF, DFP | Broad spectrum proteins |
| RNase A | 6.0-7.5 | 37°C | 10-100 µg/mL | RNasin, DEPC | RNA |
Table 3: Effects of Chaotropic Salt Concentration on DNA Yield from Silica Columns
| Guanidine HCl Concentration | Protein Contamination (A260/A280) | DNA Yield (µg/10^6 cells) | Inhibition of Taq Polymerase (Post-Purification) |
|---|---|---|---|
| 1.0 M | High (<1.6) | 3.2 ± 0.5 | None |
| 2.5 M | Moderate (~1.7) | 5.8 ± 0.7 | Slight |
| 4.0 M | Low (>1.8) | 6.1 ± 0.6 | Significant (if carried over) |
| 6.0 M | Very Low (>1.9) | 5.9 ± 0.8 | Severe (requires thorough wash) |
Experimental Protocols
Protocol 1: Comprehensive Lysis of Mammalian Cultured Cells
Objective: To isolate high-quality genomic DNA from adherent mammalian cells. Reagents: Lysis Buffer (10 mM Tris-Cl pH 8.0, 100 mM NaCl, 10 mM EDTA pH 8.0, 0.5% SDS, 200 µg/mL Proteinase K), Phenol:Chloroform:Isoamyl Alcohol (25:24:1), 100% Ethanol, 70% Ethanol, TE Buffer.
- Pellet ~10^6 cells by centrifugation (500 x g, 5 min).
- Resuspend pellet in 500 µL Lysis Buffer. Incubate at 56°C for 3 hours with gentle agitation.
- Cool to room temp. Add 500 µL Phenol:Chloroform:Isoamyl Alcohol. Mix vigorously for 1 min.
- Centrifuge at 16,000 x g for 10 min at 4°C.
- Transfer aqueous (top) phase to a fresh tube. Add 2 volumes of 100% ethanol. Mix by inversion.
- Spool out DNA precipitate or centrifuge at 16,000 x g for 15 min.
- Wash pellet with 1 mL 70% ethanol. Centrifuge at 16,000 x g for 5 min.
- Air-dry pellet for 10 min. Resuspend in 100 µL TE Buffer. Quantify via spectrophotometry.
Protocol 2: Bacterial Genomic DNA Extraction (Gram-Negative)
Objective: To extract genomic DNA from E. coli. Reagents: TE Buffer, 10% SDS, 20 mg/mL Proteinase K, 5 M NaCl, CTAB/NaCl Solution, Chloroform, Isopropanol.
- Pellet 1 mL of overnight bacterial culture. Resuspend in 567 µL TE Buffer.
- Add 30 µL 10% SDS and 3 µL Proteinase K (20 mg/mL). Mix gently. Incubate at 37°C for 1 hour.
- Add 100 µL 5 M NaCl, mix thoroughly.
- Add 80 µL CTAB/NaCl solution (pre-warmed to 65°C). Mix. Incubate at 65°C for 10 min.
- Add equal volume (~700 µL) Chloroform. Mix. Centrifuge at 16,000 x g for 5 min.
- Transfer aqueous phase. Add 0.6 volumes isopropanol to precipitate DNA. Centrifuge at 16,000 x g for 15 min.
- Wash with 70% ethanol, dry, and resuspend in TE Buffer.
Diagrams
Title: Cell Lysis Strategy and Reagent Decision Workflow
Title: DNA Extraction Workflow: Lysis, Purification, Elution
The Scientist's Toolkit: Research Reagent Solutions
Table 4: Essential Materials for Lysis Buffer Preparation and Evaluation
| Item / Reagent | Function / Purpose | Example Product/Catalog Number |
|---|---|---|
| Detergents | Solubilize membranes, release cellular contents. | Thermo Fisher 28314 (Triton X-100), Sigma L4390 (SDS) |
| Proteinase K | Digests proteins and inactivates nucleases. | Qiagen 19131, Roche 03115828001 |
| Lysozyme | Digests bacterial cell walls. | Sigma L6876 |
| Guanidine HCl | Chaotropic agent for denaturation and silica binding. | Sigma G3272 |
| Tris Buffer (1M, pH 8.0) | Maintains stable pH during lysis. | Thermo Fisher 15568025 |
| EDTA (0.5M, pH 8.0) | Chelates Mg2+ to inhibit DNases. | Sigma E7889 |
| RNase A | Degrades RNA to prevent contamination in DNA preps. | Qiagen 19101 |
| Phenol:Chloroform:IAA | Organic extraction for protein removal. | Sigma 77617 |
| Silica Membrane Columns | For bind-wash-elute purification post-lysis. | Qiagen DNeasy 69504 |
| Magnetic Beads (SPRI) | High-throughput nucleic acid binding & washing. | Beckman Coulter B23317 |
| Spectrophotometer (Nanodrop) | Assess DNA concentration and purity (A260/A280). | Thermo Fisher ND-ONE-W |
| Fluorometric Assay Kits | Accurate, specific quantification of DNA. | Invitrogen Q32851 (Qubit dsDNA BR) |
This technical guide examines the evolution of DNA extraction, a foundational process for modern molecular biology, genomics, and drug development. The core steps—cell lysis, purification, and elution—remain constant, but the technologies to execute them have advanced from hazardous organic extractions to efficient, automatable solid-phase methods. This progression reflects a continual drive for higher yield, purity, scalability, and safety in research and diagnostic applications.
Core Methodologies: A Technical Comparison
Phenol-Chloroform Extraction (Liquid-Liquid Extraction)
This classical method relies on the differential solubility of nucleic acids, proteins, and lipids in immiscible organic solvents.
Detailed Protocol:
- Cell Lysis: Resuspend cell pellet in a lysis buffer (e.g., SDS/Proteinase K, or a guanidinium isothiocyanate-based buffer) and incubate at 55-65°C until the solution is clear.
- Organic Extraction: Add an equal volume of phenol:chloroform:isoamyl alcohol (25:24:1 ratio). Cap and mix vigorously for 2 minutes. Centrifuge at 12,000 x g for 10 minutes at 4°C to separate phases.
- Aqueous Phase Recovery: Carefully transfer the upper, aqueous phase (containing DNA) to a fresh tube using a pipette, avoiding the interphase (denatured proteins) and organic phase.
- Precipitation: Add 1/10 volume of 3M sodium acetate (pH 5.2) and 2-2.5 volumes of ice-cold 100% ethanol. Mix by inversion. Incubate at -20°C for ≥30 minutes.
- Pellet DNA: Centrifuge at >12,000 x g for 20 minutes at 4°C to pellet DNA.
- Wash: Decant supernatant. Wash pellet with 1 ml of 70% ethanol. Centrifuge again for 5-10 minutes.
- Resuspend: Air-dry the pellet for 5-10 minutes (do not over-dry). Resuspend in nuclease-free TE buffer or water.
Quantitative Data Summary:
| Parameter | Phenol-Chloroform | Silica Spin-Column | Magnetic Beads |
|---|---|---|---|
| Typical Yield | High (70-90%) | Moderate-High (60-85%) | High (80-95%) |
| Purity (A260/A280) | 1.7-1.9 (prone to phenol contamination) | 1.8-2.0 (consistently high) | 1.8-2.0 (consistently high) |
| Processing Time | 2-3 hours (manual) | 30-60 minutes | 20-40 minutes (amenable to automation) |
| Throughput | Low (manual, batch) | Medium (manual, 1-24 samples) | High (suitable for 96/384-well automation) |
| Hazard Level | High (toxic, corrosive organics) | Low (non-toxic buffers) | Very Low (non-toxic buffers) |
| Scalability | Poor | Moderate (limited by column size) | Excellent (easily scaled by bead volume) |
| Cost per Sample | Low ($) | Medium ($$) | Medium-High ($$$) |
Solid-Phase Extraction (Spin-Column Technology)
This method utilizes the selective binding of DNA to a silica membrane under chaotropic salt conditions.
Detailed Protocol:
- Cell Lysis: Lyse sample in a chaotropic buffer (e.g., containing guanidine HCl) with optional Proteinase K.
- Binding: Apply the lysate to a silica-membrane column. Centrifuge at 8,000-11,000 x g for 30-60 seconds. Chaotropic salts disrupt water structure, allowing DNA to bind to silica.
- Wash: Perform two wash steps with an ethanol-based wash buffer. Centrifuge after each wash to remove contaminants.
- Elution: Apply a low-ionic-strength elution buffer (TE or water) to the dry membrane. Incubate for 1-2 minutes, then centrifuge to recover purified DNA.
Magnetic Bead Technology
This method employs paramagnetic beads coated with a silica or carboxylate surface for DNA binding, enabling separation via a magnet.
Detailed Protocol:
- Lysis & Binding: Combine sample with a lysis/binding buffer containing chaotropic salts. Add functionalized magnetic beads and mix thoroughly. DNA binds to the bead surface.
- Capture & Washes: Place the tube on a magnetic rack. Wait for the solution to clear (beads form a pellet). Aspirate and discard supernatant. Remove from magnet, add wash buffer, and resuspend beads. Repeat capture and aspiration for typically 2 washes.
- Elution: After the final wash and drying step, resuspend beads in elution buffer (e.g., TE or water). Incubate at 55-65°C for 2-5 minutes to promote DNA desorption. Place on magnet and transfer the eluate containing purified DNA to a fresh tube.
Visualization of Core Workflows
Title: Comparison of DNA Extraction Workflows (100 chars)
Title: Core DNA Extraction Process Steps (88 chars)
The Scientist's Toolkit: Key Reagent Solutions
| Reagent/Material | Function |
|---|---|
| Chaotropic Salts (e.g., Guanidine HCl, NaI) | Denature proteins, inhibit nucleases, and promote DNA binding to silica surfaces by disrupting the hydration shell. |
| Silica Matrix (Membrane or Beads) | Provides a high-surface-area substrate for DNA adsorption under high-salt, low-pH conditions. |
| Proteinase K | Broad-spectrum serine protease that digests proteins and nucleases, aiding in cell lysis and removing contaminants. |
| RNase A | Degrades unwanted RNA co-purified with DNA, improving purity and A260/A280 ratios. |
| Wash Buffer (Ethanol-based) | Typically contains ethanol and a buffering salt. Removes residual salts, proteins, and other impurities while keeping DNA bound to the silica. |
| Elution Buffer (TE or Water) | Low-ionic-strength solution that rehydrates DNA, disrupting its interaction with the silica surface, resulting in desorption. |
| Magnetic Separation Rack | Generates a magnetic field to immobilize paramagnetic beads, allowing for rapid supernatant exchange without centrifugation or filtration. |
| Phenol:Chloroform:IAA | Organic mixture that partitions lipids and proteins into the organic/interphase, leaving nucleic acids in the aqueous phase. |
Step-by-Step Protocols: Optimizing Cell Lysis, Purification, and Elution for Your Sample
As the foundational first step in the DNA extraction workflow (lysis → purification → elution), effective cell lysis determines the yield, quality, and integrity of the final nucleic acid product. This guide provides a technical analysis of core lysis methodologies, tailored for diverse sample matrices critical to biomedical research and drug development.
Core Lysis Mechanisms: A Quantitative Comparison
The choice of lysis method is dictated by sample type, downstream application, and required nucleic acid integrity. The following table summarizes key performance metrics.
Table 1: Quantitative Comparison of Cell Lysis Methods
| Method Category | Specific Technique | Typical Efficiency (%)* | Genomic DNA Shear Size (avg.) | Processing Time | Scalability | Suitability for Tough Tissues (e.g., muscle, plant) |
|---|---|---|---|---|---|---|
| Mechanical | Rotor-Stator Homogenization | >95 | 5-20 kb | 1-5 min/sample | Moderate | Excellent |
| Bead Mill (Bead Beating) | >98 | 2-15 kb | 2-10 min/sample | High (96-well) | Excellent | |
| Sonication (Probe) | >90 | 1-10 kb (tunable) | 30 sec-2 min/sample | Low | Good | |
| Chemical | Detergent-Based (SDS, CTAB) | 70-95 | 20-100+ kb | 30-60 min | High | Variable (requires optimization) |
| Alkaline Lysis | >90 | >50 kb | 5-10 min | High | Poor | |
| Enzymatic | Proteinase K (with detergent) | 80-98 | 50-150+ kb | 30 min-overnight | High | Good for soft tissues |
| Lysozyme (for Gram+) | 60-85 | >100 kb | 30-60 min | High | Not applicable | |
| Combined | Commercial Kit (e.g., silica-membrane based) | 85-99 | 20-50 kb | 20-40 min | High | Good (specialized buffers) |
*Efficiency defined as percentage of cells lysed under standard conditions. Data compiled from recent protocol literature and manufacturer specifications.
Detailed Experimental Protocols
Protocol 2.1: Bead Beating for Mechanically Resilient Samples (Microbial Pellets, Plant Tissue)
This protocol is optimized for samples with robust cell walls.
Materials:
- Lysis Buffer: 500 µL of CTAB buffer (2% CTAB, 1.4 M NaCl, 20 mM EDTA, 100 mM Tris-HCl pH 8.0) or commercial guanidinium-based buffer.
- Beads: 0.1 mm zirconia/silica beads for microbial cells; 2.7 mm ceramic beads for plant tissue.
- Bead beater homogenizer (e.g., MagNA Lyser, BeadBug).
- Sample: 20 mg tissue or 10^8 bacterial cells.
Procedure:
- Place sample in a 2 mL screw-cap tube containing appropriate beads.
- Add 500 µL of pre-warmed (65°C) lysis buffer.
- Secure tube in bead beater homogenizer.
- Process at 6,500 rpm for 45 seconds. For tough plant tissue, perform 3 cycles with 2-minute incubations on ice between cycles.
- Centrifuge at 12,000 x g for 5 minutes at 4°C.
- Transfer supernatant containing lysate to a new tube. Proceed to purification.
Protocol 2.2: Enzymatic Lysis for Mammalian Cells and Blood
A gentle method preserving high-molecular-weight DNA.
Materials:
- Proteinase K (20 mg/mL stock).
- Lysis Buffer: 400 µL of SLB (Standard Lysis Buffer: 10 mM Tris-HCl pH 8.0, 25 mM EDTA, 0.5% SDS).
- Fresh whole blood or pelleted mammalian cells (up to 5x10^6 cells).
- Water bath or heat block set to 56°C.
Procedure:
- Transfer sample to a 1.5 mL microcentrifuge tube. For blood, add 200 µL to 400 µL SLB.
- Add Proteinase K to a final concentration of 100 µg/mL.
- Mix thoroughly by vortexing for 15 seconds.
- Incubate at 56°C for 1-3 hours (or overnight for larger tissue pieces). Invert tubes periodically.
- Following incubation, heat to 85°C for 10 minutes to inactivate Proteinase K.
- Cool sample on ice. Lysate may be viscous. For blood, a subsequent RNase A step (10 µg/mL, 37°C for 5 min) is recommended before purification.
Protocol 2.3: Detergent-Based Chemical Lysis for Cultured Adherent Cells
A rapid, scalable method for simple cell monolayers.
Materials:
- Trypsin-EDTA for cell detachment.
- PBS for washing.
- Lysis Buffer: 200 µL of RIPA variant (50 mM Tris pH 8.0, 150 mM NaCl, 1% NP-40, 0.5% sodium deoxycholate, 0.1% SDS) or a pure detergent buffer (1% Triton X-100, 10 mM EDTA, 50 mM Tris pH 8.0).
- Cell scraper (if skipping trypsinization).
Procedure:
- Wash adherent cells twice with cold PBS.
- Add 200 µL of lysis buffer directly to the culture dish (for a 10 cm^2 area).
- Incubate on ice for 15 minutes, gently rocking the dish.
- Use a cell scraper to dislodge lysed material from the surface.
- Transfer the viscous lysate to a microcentrifuge tube.
- Centrifuge at 12,000 x g for 10 minutes at 4°C to pellet nuclei (if nuclear DNA is desired) or cell debris (if cytoplasmic fraction is target).
- Transfer supernatant to a new tube for immediate purification.
Visualizing the Lysis Decision Pathway
Diagram 1: Cell Lysis Method Selection Pathway
DNA Extraction Workflow: Lysis to Elution
Diagram 2: DNA Extraction Core Steps with Lysis Breakdown
The Scientist's Toolkit: Essential Research Reagent Solutions
Table 2: Key Reagents for Cell Lysis and Initial Processing
| Reagent/Chemical | Primary Function in Lysis | Common Concentration | Notes for Optimization |
|---|---|---|---|
| Sodium Dodecyl Sulfate (SDS) | Ionic detergent; disrupts lipid membranes and solubilizes proteins. | 0.1-2% | Concentration scales with sample toughness. Inactivate with high salt (K+). |
| Proteinase K | Broad-spectrum serine protease; digests nucleases and structural proteins. | 50-200 µg/mL | Activity optimal at 56°C, pH 7.5-8.0. Requires Ca2+ for stability. |
| CTAB (Cetyltrimethylammonium Bromide) | Cationic detergent; effective for polysaccharide-rich samples (plants). | 1-3% in high-salt buffer | Precipitates with polysaccharides at low salt; remove via chloroform extraction. |
| Guanidine Hydrochloride (GuHCl) | Chaotropic salt; denatures proteins, inhibits RNases/DNases, aids in binding to silica. | 4-6 M | Highly denaturing; compatible with direct column-based purification. |
| Lysozyme | Enzyme that hydrolyzes peptidoglycan in bacterial cell walls. | 1-10 mg/mL | Primarily for Gram-positive bacteria. Use in isotonic buffer to prevent premature lysis. |
| EDTA (Ethylenediaminetetraacetic acid) | Chelating agent; sequesters Mg2+ and Ca2+ to inhibit metallonucleases. | 5-20 mM | Critical for preserving DNA integrity during extended lysis. |
| Triton X-100 / NP-40 | Non-ionic detergents; disrupts lipid-lipid and lipid-protein interactions. | 0.1-1% | Milder than SDS; often used for nuclear membrane lysis or organelle isolation. |
| β-Mercaptoethanol (BME) / DTT | Reducing agents; break disulfide bonds in proteins, critical for tough tissues. | 0.1-1% (v/v BME) or 1-10 mM (DTT) | Add fresh to lysis buffer; protects nucleic acids from oxidation. |
Within the fundamental DNA extraction workflow—comprising cell lysis, purification, and elution—the lysis step is the critical foundation. An effectively formulated lysis buffer disrupts cellular and nuclear membranes, inactivates nucleases, and liberates nucleic acids into a solution primed for subsequent purification. This guide provides an in-depth technical analysis of three core components: ionic detergents like SDS, the enzyme Proteinase K, and chaotropic salts, detailing their mechanisms, synergies, and optimization.
Core Components: Mechanisms and Quantitative Data
Sodium Dodecyl Sulfate (SDS)
SDS is an ionic detergent that disrupts lipid-lipid and lipid-protein interactions in cellular membranes. It denatures proteins by binding to polypeptide backbones, imparting a uniform negative charge.
Table 1: Common SDS Concentrations in Lysis Buffers
| Sample Type | Recommended SDS Concentration | Primary Function |
|---|---|---|
| Mammalian Cells & Tissues | 0.5 - 2.0 % (w/v) | Membrane lysis, protein denaturation |
| Gram-Negative Bacteria | 1.0 - 2.0 % (w/v) | Disruption of outer lipopolysaccharide layer |
| Gram-Positive Bacteria | 2.0 - 4.0 % (w/v) | Degradation of thick peptidoglycan layer |
| Plant Tissues | 1.0 - 3.0 % (w/v) | Disruption of cell wall and membranes |
Proteinase K
This serine protease hydrolyzes peptide bonds at the carboxyl side of aliphatic, aromatic, or hydrophobic amino acids. It remains active in the presence of SDS, urea, and elevated temperatures, making it ideal for degrading nucleases and structural proteins.
Table 2: Proteinase K Incubation Parameters
| Parameter | Standard Conditions | Enhanced Digestion (e.g., for tough tissues) |
|---|---|---|
| Working Concentration | 50 - 200 µg/mL | 200 - 800 µg/mL |
| Incubation Temperature | 50 - 56°C | 56 - 60°C |
| Incubation Time | 30 mins - 3 hours | 3 hours - Overnight |
| pH Range (Effective) | 6.5 - 9.5 | 7.5 - 8.0 (Optimal) |
Chaotropic Salts (e.g., Guanidinium HCl, Guanidinium Isothiocyanate)
These salts disrupt hydrogen bonding networks, denature proteins, and can inactivate RNases and DNases. They are pivotal in single-step extraction methods (e.g., acid guanidinium thiocyanate-phenol-chloroform).
Table 3: Properties of Common Chaotropic Salts
| Chaotropic Salt | Common Working Concentration | Hofmeister Series Ranking (Chaotropicity) | Key Application |
|---|---|---|---|
| Guanidinium Isothiocyanate (GITC) | 4 - 6 M | High | Simultaneous lysis and nuclease inactivation; basis for monophasic lysis. |
| Guanidinium Hydrochloride (GdnHCl) | 4 - 8 M | Very High | Strong protein denaturant, used in plasmid preps and tough lysates. |
| Urea | 6 - 8 M | Moderate | Mild denaturant, often used in combination with detergents. |
Experimental Protocols
Protocol: Formulating and Testing a Universal Tissue Lysis Buffer
Objective: Prepare and validate a lysis buffer for genomic DNA extraction from mouse liver.
Reagents:
- 10% SDS (w/v)
- Proteinase K (20 mg/mL stock)
- 5M NaCl
- 1M Tris-HCl, pH 8.0
- 0.5M EDTA, pH 8.0
- Nuclease-free water
Method:
- Buffer Formulation: Prepare 10 mL of lysis buffer:
- 1 mL 10% SDS (final 1%)
- 1 mL 1M Tris-HCl, pH 8.0 (final 100 mM)
- 2 mL 0.5M EDTA (final 100 mM)
- 0.2 mL 5M NaCl (final 100 mM)
- 5.8 mL nuclease-free water.
- Tissue Lysis: Homogenize 25 mg of fresh-frozen mouse liver in 500 µL of lysis buffer.
- Enzymatic Digestion: Add Proteinase K to a final concentration of 200 µg/mL. Mix thoroughly.
- Incubation: Incubate the lysate at 56°C for 2 hours in a thermomixer with gentle agitation (500 rpm). For complete digestion, incubation can be extended to overnight.
- Heat Inactivation: Incubate at 95°C for 10 minutes to inactivate Proteinase K.
- Clearing: Centrifuge the lysate at 12,000 x g for 10 minutes at 4°C to pellet insoluble debris. Transfer the clear supernatant to a new tube for purification.
- Validation: Assess DNA yield and fragment size by spectrophotometry (A260/A280 ratio) and agarose gel electrophoresis.
Protocol: Evaluating Chaotropic Salt Efficiency in Bacterial Lysis
Objective: Compare the lysis efficiency of GITC versus GdnHCl on E. coli.
Method:
- Prepare two identical 1 mL cultures of E. coli (OD600 ~0.8). Pellet cells.
- Resuspend Pellet A in 200 µL of lysis buffer containing 4M GITC, 50 mM Tris-HCl (pH 7.5), and 25 mM EDTA.
- Resuspend Pellet B in 200 µL of lysis buffer containing 4M GdnHCl, 50 mM Tris-HCl (pH 7.5), and 25 mM EDTA.
- Incubate both suspensions at 70°C for 10 minutes with vortexing every 2 minutes.
- Cool and add 400 µL of binding buffer (e.g., high-salt, high-pH) to each.
- Load onto identical silica spin columns. Proceed with wash and elution steps as per manufacturer's protocol.
- Elute DNA in 50 µL and quantify yield (ng/µL) and purity (A260/A280) in triplicate.
The Scientist's Toolkit: Research Reagent Solutions
Table 4: Essential Materials for Lysis Buffer Formulation and Testing
| Reagent / Material | Function / Purpose |
|---|---|
| SDS (Electrophoresis Grade) | Provides consistent, pure detergent action for membrane disruption. |
| Proteinase K (Molecular Biology Grade) | Digests proteins and nucleases; must be RNase- and DNase-free. |
| Guanidinium Salts (GITC, GdnHCl) | Chaotropic agents for protein denaturation and nuclease inactivation. |
| Tris-HCl Buffer (1M, pH 7.5-8.0) | Maintains optimal buffering capacity during lysis. |
| EDTA (0.5M, pH 8.0) | Chelates Mg2+ and other divalent cations, inhibiting nucleases. |
| RNase A (if extracting DNA) | Degrades RNA to prevent it from co-purifying with DNA. |
| Silica Membrane Spin Columns | For purifying nucleic acids from the created lysate via binding-wash-elute. |
| Thermomixer | Provides precise temperature control and agitation for efficient digestion. |
Visualization: Lysis Buffer Component Synergy and Workflow
Within the fundamental framework of DNA extraction—cell lysis, purification, and elution—the purification phase is the critical determinant of downstream success. This phase, encompassing selective binding, washing, and contaminant removal, is engineered to isolate target nucleic acids from a complex lysate containing proteins, cellular debris, salts, and other inhibitors. For researchers and drug development professionals, mastering these strategies is paramount for applications ranging from PCR and sequencing to diagnostic assay development and biotherapeutic quality control. This guide provides an in-depth technical analysis of contemporary purification methodologies, supported by current experimental data and protocols.
Core Principles of Selective Binding
Selective binding exploits specific physico-chemical interactions between the target DNA and a solid-phase matrix. The primary mechanism is silica-based binding in the presence of high chaotropic salt concentrations (e.g., guanidinium thiocyanate). These salts disrupt hydrogen-bonded networks, dehydrate nucleic acids, and facilitate their adsorption onto silica membranes or magnetic beads. Alternative strategies include:
- Ion-Exchange: Binding via electrostatic interactions between negatively charged DNA phosphate backbone and positively charged matrices.
- Magnetic Bead Technology: Paramagnetic beads coated with silica or carboxyl groups allow for rapid, automatable separation in high-throughput settings.
- Sequence-Specific Capture: Using biotinylated probes for hybridization-based pull-down of specific genomic regions.
Table 1: Comparison of Selective Binding Matrices
| Matrix Type | Binding Principle | Typical Binding Capacity (µg/mg) | Elution Condition | Key Advantage |
|---|---|---|---|---|
| Silica Membrane | Chaotropic salt-mediated adsorption | 15-20 µg/cm² | Low-ionic-strength buffer (TE, water) | Cost-effective, high clarity eluate |
| Silica-Magnetic Beads | Chaotropic salt-mediated adsorption | 5-10 µg/mg beads | Low-ionic-strength buffer or heat | Amenable to automation, no centrifugation |
| Carboxyl-Magnetic Beads | Hydrophobic & ionic interactions (PEG/NaCl) | 3-5 µg/mg beads | Low-ionic-strength buffer | Reduced co-precipitation of impurities |
| Anion-Exchange Resin | Ionic interaction at pH >7.5 | 50-100 µg/mL resin | High-salt elution buffer | Excellent for large-scale plasmid prep |
Washing & Contaminant Removal: A Detailed Protocol
The objective of washing is to remove adsorbed contaminants while retaining the bound DNA. Wash buffer composition is meticulously optimized.
Protocol: Standardized Wash for Silica-Based Spin-Column Purification
- Post-Binding Load: After lysate has passed through the silica membrane under chaotropic conditions, discard the flow-through.
- First Wash (Inhibitor Removal): Apply 700 µL of Wash Buffer I (commonly containing Guanidine HCl and Tris-HCl, pH ~7.5, with 20-30% ethanol). Centrifuge at ≥10,000 x g for 30-60 seconds. Discard flow-through. This step removes residual proteins, lipids, and cellular debris.
- Second Wash (Desalting): Apply 500 µL of Wash Buffer II (commonly 70-80% ethanol with Tris/EDTA or salt). Centrifuge at ≥10,000 x g for 30-60 seconds. Discard flow-through. This step removes chaotropic salts and other low-molecular-weight contaminants.
- Membrane Drying: Centrifuge the empty column at maximum speed for 2 minutes to completely dry the membrane. This is critical for ethanol removal, which can inhibit enzymatic reactions.
- Elution: Transfer column to a clean microcentrifuge tube. Apply 30-100 µL of elution buffer (TE or nuclease-free water, pre-heated to 55-65°C can increase yield) directly to the membrane center. Incubate for 2-5 minutes, then centrifuge.
Table 2: Common Contaminants & Removal Strategies
| Contaminant Class | Source | Interference | Removal Strategy |
|---|---|---|---|
| Proteins & Enzymes | Lysis, cytoplasm | Inhibit polymerases, nucleases | Proteinase K digestion, chaotropic salts, organic extraction |
| Salts & Chaotropes | Lysis/binding buffers | Inhibits enzymatic reactions, alters pH | Ethanol-based wash buffers, thorough drying |
| Organic Solvents (Phenol, Ethanol) | Incomplete removal | Denatures enzymes, affects UV quantitation | Ensure complete evaporation/drying step |
| Polysaccharides & Polyphenols | Plant tissues | Co-precipitate/co-purify with DNA | CTAB or PVPP in lysis buffer, high-salt washes |
| RNA | Cytoplasm | Overestimates DNA yield, competes for binding | RNase A treatment during/after lysis |
| Heavy Metals | Environmental samples | Inhibits polymerases | Chelating agents (EDTA) in buffers |
Advanced Strategies for Challenging Samples
- Inhibitor-Rich Samples (Stool, Soil): Incorporation of inhibitor removal tubes containing proprietary polymers or additional wash steps with specialized buffers (e.g., containing isopropanol or alternative detergents).
- Low-Copy Number Targets: Use of carrier RNA (e.g., poly-A RNA) during binding to improve recovery efficiency from dilute samples.
- Large DNA Fragments (Genomic DNA): Use of wider-bore tips, gentle pipetting, and elution by incubation (not centrifugation) to prevent shearing.
Experimental Validation & Quality Control
A standard protocol to assess purification efficacy:
Experiment: Quantification of Yield and Purity via Spectrophotometry
- Elute purified DNA in 50 µL of TE buffer (pH 8.0).
- Use a microvolume spectrophotometer. Blank with elution buffer.
- Measure absorbance at 260nm (A260) for DNA concentration, 280nm for protein contamination, and 230nm for salt/organic contaminant assessment.
- Calculate:
- DNA Yield (µg/mL) = A260 × 50 µg/mL × Dilution Factor
- Purity Ratios: A260/A280 (~1.8 ideal), A260/A230 (>2.0 ideal).
- Validate integrity via agarose gel electrophoresis (0.8% gel), expecting a tight, high-molecular-weight band with minimal smearing.
Table 3: Typical QC Metrics Post-Purification
| Sample Type | Expected A260/A280 | Expected A260/A230 | Minimum Yield (Human Blood) | Gel Electrophoresis Profile |
|---|---|---|---|---|
| Mammalian Blood | 1.7 - 1.9 | 2.0 - 2.4 | 2-5 µg/mL blood | Single, high molecular weight band |
| Bacterial Culture | 1.8 - 2.0 | 1.8 - 2.2 | 5-10 µg/mL culture | High molecular weight genomic DNA |
| Plant Leaf | 1.8 - 2.0 | 1.8 - 2.2 | Varies by species | May show some shearing, chloroplast band |
| FFPE Tissue | 1.6 - 1.9 | 1.6 - 2.0 | 0.5-2 µg/section | Significant smearing due to fragmentation |
Visualization of Workflows
Silica-Based DNA Purification Core Workflow
Mechanism of Selective DNA Binding to Silica
The Scientist's Toolkit: Key Research Reagent Solutions
| Reagent / Material | Primary Function in Purification |
|---|---|
| Guanidinium Thiocyanate / HCl | Chaotropic agent. Denatures proteins, promotes DNA binding to silica. |
| Silica-Magnetic Beads | Solid phase for DNA capture. Enable magnetic separation, ideal for automation. |
| Proteinase K | Serine protease. Digests nucleases and structural proteins during lysis. |
| RNase A | Ribonuclease. Degrades contaminating RNA to improve DNA purity. |
| Ethanol (70-80%) | Wash solution. Removes salts and residual chaotropes; dehydrates silica matrix. |
| TE Buffer (pH 8.0) | Elution buffer. Tris maintains pH, EDTA chelates Mg2+ to inhibit nucleases. |
| Inhibitor Removal Tubes | Contain proprietary resins to bind humic acids, pigments, and other PCR inhibitors. |
| Carrier RNA | Improves binding efficiency of low-concentration DNA to silica matrices. |
| SPRI (Solid Phase Reversible Immobilization) Beads | Polyethylene glycol (PEG)-based magnetic beads for size-selective DNA purification. |
Within the fundamental workflow of nucleic acid extraction—comprising cell lysis, purification, and elution—the final elution step is often under-optimized, leading to significant, yet preventable, losses of high-value genetic material. This technical guide focuses on the elution phase, a critical determinant of DNA yield, purity, and downstream functionality. Efficient elution directly impacts the success of subsequent applications such as PCR, sequencing, and cloning, which are foundational to biomedical research and drug development. This document provides an in-depth analysis of the core variables in DNA elution: the choice of elution buffer (TE Buffer vs. Nuclease-Free Water) and the application of controlled temperature, synthesizing current best practices into actionable protocols.
Core Elution Variables: A Quantitative Comparison
The efficacy of elution is governed by the interplay between the elution solution and physical parameters. The following tables consolidate key quantitative findings from recent studies.
Table 1: Comparative Analysis of Elution Solutions (TE Buffer vs. Nuclease-Free Water)
| Property / Effect | TE Buffer (10 mM Tris-HCl, 0.1-1 mM EDTA, pH 8.0-8.5) | Nuclease-Free Water (pH often acidic ~5-6) |
|---|---|---|
| DNA Yield (Short-Term) | Typically 5-15% lower than water due to cation chelation. | Higher immediate yield (reference standard). |
| DNA Stability | Excellent long-term storage. Tris maintains pH; EDTA chelates Mg²⁺, inhibiting nucleases. | Poor; susceptible to acid hydrolysis and nuclease degradation over time. |
| Downstream Compatibility | EDTA can inhibit Mg²⁺-dependent enzymes (e.g., PCR, restriction enzymes). Often requires dilution. | Generally compatible, but low pH can affect some enzymatic reactions. |
| Recommended Use Case | Long-term storage (> 1 month), archiving of precious samples. | Immediate use in enzymatic reactions, where chelators are problematic. |
Table 2: Impact of Temperature and Incubation Time on Elution Efficiency
| Elution Condition | Typical Yield Increase (vs. Room Temp) | Optimal Incubation Time | Notes & Caveats |
|---|---|---|---|
| Room Temp (20-25°C) | Baseline | 1-5 minutes | Fast, convenient, but often yields less DNA from silica matrices. |
| 37°C | 10-30% | 1-2 minutes | Effective balance between yield and practicality. Pre-heat elution buffer. |
| 50-60°C | 20-50% | 1-5 minutes | Often optimal for silica-membrane columns. Maximizes DNA solubility and desorption kinetics. |
| 65-70°C | 15-40% (plateau/decline possible) | 1-3 minutes | Risk of evaporating small volumes; may denature dsDNA if prolonged. |
| Pre-Heat Eluent vs. Heat Column | Comparable yields | As above | Pre-heating eluent is simpler. Heating the entire column may help with viscous samples. |
Experimental Protocols for Elution Optimization
Protocol 1: Comparative Elution Efficiency Test
Objective: To empirically determine the optimal elution condition (buffer vs. temperature) for a specific silica-column based kit. Materials: Identical purified DNA-bound columns from a single extraction batch, pre-heated thermoblock, TE Buffer (pH 8.0), Nuclease-Free Water, Qubit fluorometer or spectrophotometer. Procedure:
- Divide columns into 6 groups (n≥3 per group).
- Apply 50 µL of the following pre-warmed eluents to the center of each membrane:
- Group A: Nuclease-Free Water, room temperature.
- Group B: TE Buffer, room temperature.
- Group C: Nuclease-Free Water, 37°C.
- Group D: TE Buffer, 37°C.
- Group E: Nuclease-Free Water, 55°C.
- Group F: TE Buffer, 55°C.
- Incubate columns at their target temperature (place in thermoblock) for 2 minutes.
- Centrifuge at full speed (≥13,000 rpm) for 1 minute to collect eluate.
- Measure DNA concentration and A260/A280 purity for each eluate. Perform a standard PCR assay to assess functionality.
- Analysis: Compare mean yields and purity across groups using ANOVA. The condition offering the best compromise of high yield, purity, and downstream performance is optimal.
Protocol 2: Stability Assessment Under Different Storage Conditions
Objective: To evaluate the degradation rate of DNA eluted in different solutions over time. Materials: High-quality genomic DNA eluted in TE Buffer (pH 8.0) and Nuclease-Free Water. Procedure:
- Aliquot identical DNA samples into multiple tubes.
- Store aliquots under: 4°C, -20°C, and repeated freeze-thaw cycles (e.g., 5 cycles).
- At time points (Day 0, 7, 30, 90), analyze samples by:
- Fluorometric quantitation (yield loss).
- Gel electrophoresis (fragmentation assessment).
- qPCR amplification efficiency (integrity/functionality).
- Analysis: Plot concentration and Cq values over time. TE-stored samples should show minimal degradation compared to water-stored samples, especially at higher temperatures and through freeze-thaw cycles.
Visualizing the Elution Decision Pathway
Title: DNA Elution Buffer and Temperature Decision Pathway
The Scientist's Toolkit: Essential Research Reagent Solutions
Table 3: Key Reagents and Materials for Optimized DNA Elution
| Item | Function & Rationale |
|---|---|
| TE Buffer (10:0.1 or 10:1) | Function: Standard elution/storage buffer. Rationale: Tris stabilizes pH at 8.0 to prevent acid depurination. EDTA chelates divalent cations, inactivating nucleases. The low EDTA (0.1 mM) version is better for downstream enzyme compatibility. |
| Nuclease-Free Water | Function: Metal chelator-free eluent. Rationale: Provides higher immediate yields from silica and is compatible with Mg²⁺-dependent reactions. Must be verified nuclease-free and stored sterile. |
| pH Meter & Calibration Standards | Function: Precise buffer pH verification. Rationale: Elution efficiency is highly pH-dependent. Slightly alkaline pH (8.0-8.5) is critical for DNA stability and effective elution from silica. |
| Precision Heating Block or Water Bath | Function: Temperature-controlled incubation. Rationale: Essential for applying the optimal elution temperature (e.g., 55°C) consistently across samples to maximize DNA desorption. |
| Low-Binding/Non-Stick Microcentrifuge Tubes | Function: Collection and storage of eluate. Rationale: Minimizes surface adsorption of low-concentration DNA samples, preserving yield. |
| Fluorometric Quantitation Kit (e.g., Qubit) | Function: Accurate DNA concentration measurement. Rationale: More specific for nucleic acids than UV absorbance (A260), unaffected by contaminants from buffers or residual reagents, crucial for optimization assays. |
| Silica-Membrane Spin Columns | Function: The purification matrix from which DNA is eluted. Rationale: The binding and elution kinetics of DNA on silica are central to the process. Understanding the manufacturer's recommended conditions provides a baseline for optimization. |
DNA extraction is a foundational process in life sciences, universally built on the three core steps of cell lysis, purification, and elution. However, the downstream application dictates specific quality requirements for the nucleic acid product. This guide details how the fundamental extraction protocol must be tailored to optimize performance in Next-Generation Sequencing (NGS), Polymerase Chain Reaction (PCR), Genotyping, and Biobanking. Each application demands a unique balance of yield, purity, fragment size, and the absence of specific inhibitors.
Application-Specific Quality Requirements & Protocol Modifications
The following table summarizes key quality metrics and the primary focus of protocol modification for each application.
Table 1: Application-Specific DNA Quality Requirements and Protocol Focus
| Application | Primary Quality Metrics | Critical Protocol Focus & Common Challenges | Recommended Yield & Purity (A260/A280) |
|---|---|---|---|
| NGS | High molecular weight, purity from humic substances, RNases, and cross-linkers. Inhibitor-free. | Lysis: Gentle, mechanical (sonication, bead-beating) to control fragment size. Purification: Stringent silica-column or magnetic bead washes to remove PCR inhibitors, proteins, and carbohydrates. | Yield: >1 µg (library prep dependent). Purity: 1.8-2.0. |
| PCR (qPCR/dPCR) | Purity from inhibitors (heme, heparin, EDTA, polyphenols). Integrity secondary. | Lysis: Application-specific (e.g., enzymatic for blood). Purification: Emphasis on inhibitor removal via specialized wash buffers (e.g., with chaotropic salts, detergents). Spin-column protocols are prevalent. | Yield: Varies (often ng amounts). Purity: 1.7-2.0 (inhibitor-free critical). |
| Genotyping (Microarrays, PCR-based) | Consistent yield and purity across many samples. Moderate fragment size. | Lysis: High-throughput, automated 96-well plate formats. Purification: Robust, reproducible magnetic bead-based protocols. Balance of speed and cost-effectiveness. | Yield: 50-250 ng per sample. Purity: ~1.8. |
| Biobanking (Long-term Storage) | Long-term stability, high integrity, and traceability. | Lysis: Non-destructive, scalable methods. Purification: Removal of nucleases and reactive chemicals. Elution: Use of stabilizing buffers (e.g., TE, pH 8.0) over water. Automation for reproducibility. | Yield: High (for multiple future uses). Purity: >1.8. |
Detailed Experimental Protocols
Protocol 1: High Molecular Weight (HMW) DNA Extraction for NGS (e.g., Whole Genome Sequencing)
- Principle: Gentle lysis to preserve long DNA fragments, followed by purification that removes contaminants detrimental to library preparation and sequencing chemistry.
- Method (Magnetic Bead-Based):
- Cell Lysis: Resuspend cells (e.g., from blood or tissue) in a lysis buffer containing Proteinase K, SDS, and EDTA. Incubate at 56°C for 1-3 hours with gentle agitation. For FFPE tissue, include an initial deparaffinization step and a 65°C incubation.
- RNA Removal (Optional): Add RNase A and incubate at room temperature for 2-5 minutes.
- Binding: Add isopropanol and paramagnetic beads to the lysate. Mix thoroughly and incubate at room temperature for 5 minutes. Place on a magnetic stand until the supernatant is clear.
- Washing: Remove supernatant. Wash beads twice with a freshly prepared 70% ethanol solution while on the magnet. Dry beads briefly (~5 min).
- Elution: Elute HMW DNA in a low-EDTA TE buffer (10 mM Tris-HCl, 0.1 mM EDTA, pH 8.0) or nuclease-free water pre-warmed to 55°C. Incubate for 2-5 minutes before separating.
Protocol 2: Inhibitor-Free DNA Extraction for Sensitive PCR (e.g., from Whole Blood)
- Principle: Rapid inactivation of nucleases and specific removal of heme and other PCR inhibitors abundant in blood.
- Method (Spin-Column with Inhibitor Removal Wash):
- Lysis: Mix 200 µL of whole blood with an equal volume of lysis buffer containing guanidine HCl and Triton X-100. Vortex vigorously.
- Protein Precipitation: Add a protein precipitation solution (e.g., high-salt, low-pH). Vortex and centrifuge at >13,000 g for 3 minutes.
- Binding: Transfer supernatant containing DNA to a spin column with a silica membrane. Centrifuge.
- Washing (Critical Step): Perform two washes: First with a standard ethanol-based wash buffer. Second with a specialized "inhibitor removal" wash buffer (often containing proprietary detergents and chelators). Centrifuge thoroughly after each wash.
- Elution: Elute DNA in 50-100 µL of low-EDTA TE buffer or PCR-grade water.
Protocol 3: High-Throughput DNA Extraction for Genotyping Studies
- Principle: Automation-friendly, consistent method for processing hundreds of samples, typically using magnetic beads in a 96-well plate format.
- Method (96-Well Magnetic Bead Protocol):
- Lysis: Aliquot samples (e.g., buccal swabs or small blood spots) into a 96-well plate. Add a lysis/binding buffer (containing guanidine thiocyanate and isopropanol) and Proteinase K. Seal and shake at high speed for 1-2 hours.
- Binding: Add magnetic bead suspension to each well. Shake to mix and incubate for 10 minutes.
- Washing (Automated): Place plate on a magnetic stand. Using a liquid handler, aspirate supernatant. Add wash buffer 1 (high-salt), mix, aspirate. Add wash buffer 2 (ethanol-based), mix, aspirate. Air dry beads.
- Elution: Add low-EDTA TE buffer. Shake to resuspend beads and incubate. Place on magnet and transfer eluate to a new plate.
Visualization of Protocol Selection and Workflow
Diagram 1: DNA Extraction Protocol Decision Tree
The Scientist's Toolkit: Essential Research Reagent Solutions
Table 2: Key Reagents for Application-Specific DNA Extraction
| Reagent / Material | Primary Function | Application-Specific Note |
|---|---|---|
| Proteinase K | Enzymatic digestion of proteins and nucleases. Critical for efficient lysis. | NGS/Biobanking: High-purity, molecular biology grade. PCR: Often included in rapid lysis buffers. |
| Guanidine Hydrochloride/Thiocyanate | Chaotropic salt. Denatures proteins, disrupts cells, and promotes DNA binding to silica. | Core component of lysis/binding buffers across all applications. Concentration varies. |
| Magnetic Beads (Silica-Coated) | Solid phase for DNA binding and purification via magnetic separation. | Genotyping/NGS: Preferred for automation and high-throughput. Bead size impacts yield and fragment selection. |
| Spin Columns (Silica Membrane) | Solid phase for DNA purification via centrifugation. | PCR/Field Work: Ideal for low sample numbers and inhibitor removal workflows. |
| Inhibitor Removal Wash Buffers | Proprietary buffers designed to remove specific contaminants (heme, humics, ions). | Critical for PCR from complex samples (blood, soil, plants). |
| RNase A | Degrades RNA to prevent RNA contamination in DNA extracts. | NGS: Often essential for accurate quantification. Genotyping: Standard step. |
| Low-EDTA TE Buffer (10mM Tris, 0.1mM EDTA, pH 8.0) | Elution and storage buffer. Tris stabilizes pH; low EDTA chelates Mg2+ to inhibit nucleases. | NGS/Biobanking: Elution of choice for long-term stability and compatibility. |
| PCR-Grade Water | Nuclease-free, low-ionic-strength water. | PCR/qPCR: Preferred elution to avoid introducing ions that can inhibit polymerase. |
| Isopropanol & Ethanol (70%) | Facilitates DNA binding to silica and serves as a wash solvent to remove salts. | Used universally. Must be high-purity and nuclease-free. |
Diagnosing and Solving Common DNA Extraction Problems for Reliable Results
Within the fundamental workflow of DNA extraction—cell lysis, purification, and elution—the failure to achieve high yield is a primary bottleneck in downstream research and diagnostic applications. This technical guide deconstructs the three core failure points: incomplete lysis, inefficient binding to the purification matrix, and suboptimal elution. By examining the biochemical and physical principles underlying each step, this paper provides a systematic troubleshooting framework backed by current experimental data.
Incomplete Cell Lysis: The Primary Bottleneck
Incomplete lysis directly caps the maximum possible DNA yield. Efficacy is governed by cell type, lysis buffer composition, and mechanical disruption.
Key Variables and Quantitative Effects
Table 1: Impact of Lysis Methods on Yield from Diverse Cell Types
| Cell Type / Sample | Recommended Lysis Method | Common Pitfall | Average Yield Improvement with Optimization |
|---|---|---|---|
| Gram-positive Bacteria (e.g., Bacillus) | Enzymatic (Lysozyme + Mutanolysin) + Mechanical Bead Beating | Reliance on detergent-only lysis | 300-400% |
| Mammalian Tissue (Heart, Muscle) | Proteinase K Digestion + Detergent, followed by Homogenization | Inadequate tissue disaggregation | 150-200% |
| Plant Leaf (e.g., Arabidopsis) | CTAB Buffer + β-Mercaptoethanol + Grinding with Liquid N₂ | Polysaccharide co-precipitation | 200-300% |
| Yeast (e.g., S. cerevisiae) | Zymolyase Digestion + SDS Lysis | Insufficient cell wall degradation | 250-350% |
| Blood (Whole Blood) | Osmotic Lysis + Proteinase K/SDS | Incomplete white blood cell lysis; heme carryover | 120-180% |
Detailed Protocol: Optimized Lysis for Gram-Positive Bacteria
- Pellet 1 x 10⁸ bacterial cells by centrifugation (5,000 x g, 10 min).
- Resuspend in 200 µL of TE buffer (pH 8.0) containing 20 mg/mL lysozyme and 1 U/µL mutanolysin.
- Incubate at 37°C for 60 minutes.
- Add 200 µL of AL buffer (containing guanidine hydrochloride and 1% SDS) and 20 µL of Proteinase K (20 mg/mL).
- Vortex and incubate at 56°C for 30 minutes.
- Transfer to a tube containing 0.1mm silica beads and bead-beat for 45 seconds at 6 m/s.
- Proceed to purification.
Binding Issues: The Silica Matrix Dilemma
Successful binding of DNA to silica membranes or magnetic beads depends on creating the correct chaotropic salt and pH environment.
Critical Parameters for Binding Efficiency
Table 2: Effects of Binding Conditions on DNA Adsorption to Silica
| Condition Variable | Optimal Range | Suboptimal Effect | Typical Yield Loss |
|---|---|---|---|
| Guanidine HCl Concentration | 4 - 6 M | < 4 M: Poor denaturation, weak binding > 6 M: Salt precipitation | 60-90% |
| Ethanol Concentration | 20 - 50% (v/v) | < 20%: Poor DNA precipitation onto matrix > 50%: Co-precipitation of inhibitors | 40-70% |
| Binding pH | pH ≤ 7.5 (acidic side) | pH > 7.5: Negative charge on silica repels DNA | 50-80% |
| Sample Load Volume vs. Membrane Capacity | ≤ 80% of mfr. stated capacity | Overload: Clogging, flow-through DNA | 30-60% |
| Presence of Interferents (e.g., SDS, EDTA) | Minimal in final mix | Excess SDS: Precipitates with salts, blocks membrane | 20-50% |
Detailed Protocol: Binding Optimization Test
- Prepare a standardized lysate from a control cell line.
- Divide into 5 aliquots of 200 µL each.
- To each aliquot, add 200 µL of a modified binding buffer, varying only one parameter (e.g., Guanidine HCl at 2M, 4M, 6M, 8M; Ethanol at 10%, 30%, 50%, 70%).
- Mix thoroughly and apply to mini spin columns.
- Centrifuge at 10,000 x g for 1 minute. Save the flow-through.
- Quantify DNA in the flow-through using a fluorescent dye to calculate binding efficiency: ((Total DNA loaded - DNA in flow-through) / Total DNA loaded) * 100.
Elution Inefficiency: The Final Hurdle
Elution reverses the binding process. Low-yield elution often results from DNA being incompletely rehydrated or retained on the membrane.
Quantitative Elution Optimization Data
Table 3: Impact of Elution Parameters on Final DNA Yield and Quality
| Elution Parameter | Recommended Practice | Common Error | Effect on Yield (vs. Optimal) |
|---|---|---|---|
| Elution Buffer | Low-EDTA TE buffer (pH 8.0-9.0) or Nuclease-Free Water | Using acidic TE or water at neutral pH | 10-40% reduction |
| Elution Buffer Volume | 30-50 µL for a standard mini-prep column (small volume, high conc.) | Using excessive volume (>100 µL) for concentration | Dilution, not yield loss |
| Elution Incubation Time | 1-5 minutes at room temp before centrifugation | Immediate centrifugation | Up to 50% yield loss |
| Column Pre-warming | Incubate elution buffer on membrane at 37-65°C for 5 min | Elution with cold buffer | 20-60% increase |
| Centrifugation Speed & Time | ≥10,000 x g for 1 minute | Low speed (<6,000 x g) or short time | 10-30% retention in membrane |
Detailed Protocol: Two-Step Warm Elution
- After the final wash, spin the empty column at max speed for 1 minute to dry the membrane.
- Apply 30-50 µL of pre-warmed (55°C) Elution Buffer (10 mM Tris-HCl, pH 8.5) to the center of the silica membrane.
- Close the cap and incubate the column at room temperature for 3 minutes.
- Optionally, incubate at 55°C for 2 minutes for high-GC DNA.
- Centrifuge at ≥10,000 x g for 1 minute to collect eluate.
- For maximum yield: Reload the eluate onto the same membrane and repeat step 5.
The Scientist's Toolkit: Essential Research Reagent Solutions
Table 4: Key Reagents for Troubleshooting DNA Extraction Yield
| Reagent / Material | Primary Function in Extraction | Key Consideration for Yield |
|---|---|---|
| Proteinase K | Broad-spectrum serine protease. Degrades nucleases and structural proteins, facilitating lysis and DNA release. | Activity is cation-dependent. Ensure lysis buffer contains Ca²⁺. Inactivation requires heating to >65°C or phenol. |
| Chaotropic Salts (e.g., Guanidine HCl, NaI) | Denature proteins, disrupt H-bonds, and make nucleic acids adhere to silica by dehydrating the hydration shell. | Concentration is critical. Must be >4M for efficient binding. Can precipitate in high ethanol or with SDS. |
| Silica-Based Membrane/Beeds | Provide a high-surface-area matrix for selective nucleic acid binding in the presence of chaotropes. | Binding capacity is finite. Overloading causes physical clogging and DNA loss in flow-through. |
| RNase A | Degrades RNA to prevent RNA contamination, which can occupy binding sites on the silica matrix. | Pre-treatment of lysate with RNase A before binding can increase effective DNA binding capacity by up to 30%. |
| β-Mercaptoethanol (or DTT) | Reducing agent. Breaks disulfide bonds in proteins, aiding lysis. Critical for plant tissues to inhibit polyphenol oxidases. | Volatile and unstable. Must be added fresh to lysis buffers. |
| Pre-warmed Low-EDTA TE Buffer (pH 8.5-9.0) | Elution buffer. Slightly alkaline pH and low ionic strength promote DNA desorption from silica. Heat increases efficiency. | EDTA can inhibit downstream enzymes (PCR, restriction digest). Use low concentration (0.1 mM) or omit. |
Low DNA yield is rarely attributable to a single factor but is instead the product of cumulative inefficiencies across the lysis, binding, and elution continuum. A systematic, quantitative approach to troubleshooting—beginning with verification of complete lysis, followed by optimization of binding chemistry, and culminating in a controlled, warm elution—is fundamental to reliable nucleic acid research. This guide provides the framework and experimental protocols to diagnose and resolve these core issues, ensuring data quality and reproducibility in downstream applications from genotyping to next-generation sequencing.
Within the fundamental workflow of nucleic acid research—comprising cell lysis, purification, and elution—the accurate assessment of extracted DNA purity is a critical determinant of downstream success. Spectrophotometric ratios (A260/A280 and A260/A230) serve as primary, rapid diagnostics for contamination. However, interpreting deviations requires a deep understanding of how contaminants from each extraction step manifest in these metrics. This guide details the sources, impacts, and remediation strategies for common contaminants, providing a technical framework for ensuring data integrity in research and drug development.
Fundamentals of Spectrophotometric Purity Assessment
Nucleic acids absorb ultraviolet light maximally at 260 nm. The A260/A280 and A260/A230 ratios leverage the differential absorption of common contaminants to indicate purity.
- A260/A280 Ratio: Primarily indicates protein contamination (phenol can also affect this). Pure DNA has an ideal ratio of ~1.8, while pure RNA is ~2.0. Proteins absorb strongly at 280 nm due to aromatic amino acids (tyrosine, tryptophan), lowering the ratio.
- A260/A230 Ratio: A sensitive indicator of contamination by chaotropic salts (e.g., guanidine thiocyanate), carbohydrates, EDTA, or organic solvents (e.g., phenol, ethanol). These compounds often absorb strongly at 230 nm, causing a low ratio. The ideal target is typically >2.0.
Quantitative Analysis of Contaminants and Their Signatures
Table 1: Spectrophotometric Signatures and Sources of Common Contaminants
| Contaminant Class | Specific Example(s) | Primary Source in Extraction | Effect on A260/A280 | Effect on A260/A230 | Additional Indicators |
|---|---|---|---|---|---|
| Protein | Cellular proteins, BSA, enzymes | Incomplete removal during lysis/purification | Decreased (<<1.8) | May be slightly decreased | Broad absorbance ~280 nm; gel electrophoresis. |
| Salts | Guanidine HCl, Chaotropic salts, NaCl | Carry-over from binding/wash buffers | Minimal change | Drastically Decreased (<<2.0) | Conductivity measurement; inhibited enzyme activity. |
| Organic Solvents | Phenol, Ethanol, Isopropanol | Incomplete removal during phase separation or washing | May be increased or variable | Drastically Decreased | Characteristic odor; inhibited PCR/ligation. |
| Carbohydrates | Polysaccharides, Heparin | Plant/biological samples; some blood collection tubes | Minimal change | Decreased | Viscous sample; difficult pipetting. |
| Free Nucleotides | dNTPs, NTPs | RNA carryover, degraded nucleotides | Increased (>1.9 for DNA) | Variable | Overestimation of concentration. |
Detailed Experimental Protocols for Diagnosis and Remediation
Protocol 1: Diagnostic Re-precipitation for Salt/Solvent Contamination
Purpose: To confirm and remove residual salt or solvent contamination suspected from low A260/A230 ratios.
Materials:
- Sodium acetate (3M, pH 5.2)
- Absolute ethanol (100% and 70%, ice-cold)
- Nuclease-free water
- Microcentrifuge tubes
- Refrigerated microcentrifuge
Methodology:
- Measure the initial volume of the DNA sample.
- Add 0.1 volumes of 3M sodium acetate (pH 5.2) and mix thoroughly.
- Add 2.5 volumes of ice-cold absolute ethanol. Mix by inversion.
- Incubate at -20°C for 30 minutes to 2 hours.
- Centrifuge at >12,000 × g for 15 minutes at 4°C. Carefully decant the supernatant.
- Wash the pellet with 500 µL of ice-cold 70% ethanol. Centrifuge at 12,000 × g for 5 minutes at 4°C.
- Carefully remove all ethanol supernatant. Air-dry the pellet for 5-10 minutes (do not over-dry).
- Resuspend the DNA pellet in an appropriate volume of nuclease-free water or TE buffer.
- Re-measure A260/A230 and A260/A280 ratios.
Protocol 2: Silica Column Clean-up for Complex Contaminants
Purpose: To remove a broad spectrum of contaminants (proteins, salts, solvents, organics) using selective binding.
Materials:
- Commercial silica-membrane spin column kit (e.g., QIAquick, NucleoSpin)
- Binding buffer (usually containing guanidine salt and chaotropic agent)
- Wash buffer (typically ethanol-based)
- Elution buffer (TE or nuclease-free water)
- Microcentrifuge
Methodology:
- Adjust the DNA sample to a consistent volume with nuclease-free water.
- Add 3-5 volumes of binding buffer to the sample and mix thoroughly. This condition promotes DNA binding to the silica membrane while contaminants remain in solution.
- Transfer the mixture to the spin column assembly. Centrifuge at ~11,000 × g for 30-60 seconds. Discard the flow-through.
- Add wash buffer (as specified in the kit, often containing ethanol). Centrifuge as in step 3. Discard flow-through. Repeat wash step if directed.
- Centrifuge the empty column for an additional 1 minute to dry the membrane completely, ensuring ethanol removal.
- Place the column in a clean collection tube. Apply 30-50 µL of elution buffer (pre-heated to 55°C can increase yield) directly to the center of the membrane.
- Let it stand for 1-2 minutes, then centrifuge at full speed for 1 minute to elute the purified DNA.
- Quantify the DNA via spectrophotometry and note the improvement in purity ratios.
The Scientist's Toolkit: Research Reagent Solutions
Table 2: Essential Materials for Addressing DNA Purity Issues
| Item | Function & Relevance to Purity |
|---|---|
| Silica-Membrane Spin Columns | Selective binding of DNA under high-salt conditions; washing removes proteins, salts, and organics. Core tool for remediation. |
| Chaotropic Salts (e.g., Guanidine HCl) | Component of binding buffers. Denature proteins and promote DNA-silica binding but are a key contaminant if not fully washed. |
| RNase A | Enzyme that degrades RNA contamination, which can skew A260/A280 ratios and DNA concentration measurements. |
| Phase Lock Gel Tubes | Facilitate clean separation of organic (phenol) and aqueous phases during phenol-chloroform extraction, minimizing solvent carryover. |
| Magnetic Beads (SPRI) | Paramagnetic particles that bind DNA in PEG/salt conditions. Enable efficient washing and elution, reducing salt contamination. |
| TE Buffer (pH 8.0) | Optimal elution/storage buffer. EDTA chelates Mg2+ to inhibit nucleases; Tris stabilizes pH. Prevents acidic pH degradation. |
| Fluorometric Assay Kits (e.g., Qubit) | Dye-based quantification specific to DNA or RNA. Unaffected by common contaminants that skew spectrophotometric ratios. |
| Solid-Phase Reversible Immobilization (SPRI) Beads | Magnetic beads used for high-throughput purification. Efficient removal of salts, solvents, and dNTPs via ethanol-based washes. |
Logical Workflow for Diagnosing Purity Problems
Diagram Title: Diagnostic & Remediation Workflow for DNA Purity Issues
Contaminant Origin in Core Extraction Workflow
Diagram Title: Contaminant Sources in DNA Extraction Steps
Effectively addressing DNA purity problems requires linking spectrophotometric deviations to their root causes in the extraction protocol. Low A260/A280 ratios reliably signal protein carryover from inadequate lysis or purification, while depressed A260/A230 ratios are hallmark indicators of residual salts or solvents. The remediation strategies outlined—from targeted re-precipitation to silica-based clean-up—provide robust solutions. Integrating these diagnostic and corrective steps into the core lysis-purification-elution thesis ensures the yield of high-integrity DNA, a non-negotiable foundation for reliable research and translational drug development.
Within the fundamental workflow of DNA extraction—cell lysis, purification, and elution—the integrity of the isolated nucleic acid is paramount. DNA degradation, stemming from enzymatic activity (DNases, RNases) or physical shearing, directly compromises downstream applications such as PCR, sequencing, and cloning. This technical guide details the core mechanisms of degradation and provides current, actionable strategies to preserve high-molecular-weight DNA throughout the isolation process.
- Enzymatic Degradation: DNases are Mg²⁺/Ca²⁺-dependent endo- or exonucleases that hydrolyze phosphodiester bonds. They are ubiquitous and robust. RNases, often co-isolated with DNA, can degrade carrier RNA or contaminate samples, interfering with sensitive assays.
- Physical Shearing: High molecular weight DNA is susceptible to hydrodynamic forces. Vortexing, vigorous pipetting, or passage through narrow orifices generates shear stress, fragmenting the DNA.
- Chemical Degradation: Acidic conditions or excessive heat can cause depurination and strand breakage.
Quantitative Impact of Degradation Factors
The following table summarizes key quantitative data on degradation factors and inhibitory conditions.
Table 1: Degradation Agents and Their Inactivation
| Agent | Optimal Activity | Inactivation Method | Effective Concentration/ Condition | Residual Risk |
|---|---|---|---|---|
| DNase I | pH 7.6, 37°C, Mg²⁺/Ca²⁺ | Chelation (EDTA, EGTA) | 2-10 mM EDTA | Reactivates if divalent cations are restored. |
| RNase A | pH 7-8, broad temperature | Denaturants (Guanidine HCl) | >4 M Guanidine HCl | Extremely stable; resistant to autoclaving. |
| Physical Shearing | Forces > ~2 nN on dsDNA | Gentle Handling | Pipette tips with >1mm orifice; wide-bore tips for viscous lysates. | Inherent in column-based purifications. |
| Acidic Hydrolysis | pH < 5.0, >65°C | Buffered Solutions | Maintain pH 7.0-8.5 (Tris-HCl, TE buffer). | Depurination can occur during long-term storage. |
Detailed Experimental Protocols for Assessing Integrity
Protocol 1: Assessing DNA Integrity via Gel Electrophoresis
- Purpose: To visually evaluate DNA fragment size distribution and detect shearing or smearing indicative of degradation.
- Reagents: Agarose, TAE or TBE buffer, DNA ladder (High Molecular Weight, e.g., λ-HindIII), loading dye, fluorescent nucleic acid stain (e.g., GelRed, SYBR Safe).
- Method:
- Prepare a 0.6-0.8% agarose gel in running buffer.
- Mix 1-2 µL of DNA sample with 6X loading dye.
- Load sample alongside an appropriate DNA ladder.
- Run gel at 4-6 V/cm for 45-60 minutes.
- Visualize under appropriate transillumination.
- Interpretation: High-quality genomic DNA appears as a single, compact, high-molecular-weight band with minimal smearing toward lower weights.
Protocol 2: Quantifying Degradation via Fragment Analyzer/Bioanalyzer
- Purpose: To obtain a quantitative size profile and calculate a Degradation Factor (DQN) or DNA Integrity Number (DIN).
- Reagents: Appropriate kit for genomic DNA analysis (e.g., Genomic DNA Analysis Kit).
- Method:
- Prepare samples and ladder according to kit instructions.
- Prime the system and load the gel-dye mix.
- Load ladder and samples into specified wells.
- Run analysis using manufacturer's software.
- Interpretation: Software calculates a DIN score (1-10); >7 indicates high integrity. The electrophoretogram shows a clear main peak with minimal low-fragment background.
Integrated Prevention Strategy: A Workflow Diagram
Diagram 1: Integrated Workflow for Preventing DNA Degradation
The Scientist's Toolkit: Essential Reagents & Materials
Table 2: Key Research Reagent Solutions for DNA Integrity Preservation
| Item | Function & Rationale |
|---|---|
| 0.5 M EDTA, pH 8.0 | Chelates Mg²⁺ and Ca²⁺, irreversibly inhibiting metalloenzyme DNases. |
| Proteinase K | Broad-spectrum serine protease; degrades nucleases and other proteins during lysis. |
| Guanidine Hydrochloride (GuHCl) | Chaotropic salt at >4 M concentration denatures proteins (including RNases) and facilitates nucleic acid binding to silica. |
| RNase A (Optional) | Used deliberately in some protocols to remove contaminating RNA after DNA is protected by GuHCl or other denaturants. |
| TE Buffer (10 mM Tris, 1 mM EDTA, pH 8.0) | Standard elution/storage buffer. Tris maintains neutral pH; EDTA provides ongoing DNase inhibition. |
| Wide-Bore/ Low-Binding Pipette Tips | Minimizes hydrodynamic shear stress during transfer of viscous lysates or high-molecular-weight DNA. |
| Silica-Membrane Columns | Provide a solid-phase purification method that separates DNA from nucleases in solution after binding. |
| Magnetic Beads (SPRI) | Allow gentle, tube-side nucleic acid purification without centrifugation-induced shearing. |
The fundamental steps of DNA extraction—cell lysis, purification, and elution—form the cornerstone of molecular biology. However, these steps face significant challenges when applied to complex sample types such as Formalin-Fixed Paraffin-Embedded (FFPE) tissues, forensic specimens, and diverse microbiomes. This guide details optimized protocols grounded in recent research to overcome issues of DNA fragmentation, inhibitor co-purification, and bias, thereby ensuring high-quality, representative nucleic acid yields for downstream applications.
The table below summarizes the primary challenges and key performance metrics for each sample type based on current literature.
Table 1: Challenges and Performance Metrics for Challenging Sample Types
| Sample Type | Core Challenge | Key Quality Metric | Typical Yield Range | Inhibition Risk |
|---|---|---|---|---|
| FFPE Tissue | Cross-linking, fragmentation, paraffin carryover | DIN (DNA Integrity Number), DV200 (%>200bp) | 0.5 - 2.0 µg per 10µm section | Low-Medium |
| Forensic Sample | Low quantity, degradation, PCR inhibitors (e.g., humics, indigo) | RFU (Relative Fluorescent Units) in qPCR, degradation index | <1 ng - 100 ng (swab) | Very High |
| Complex Microbiome | Bias from lysis method, host DNA contamination, diverse cell walls | 260/280, 260/230, Shannon Index (post-sequencing) | 1 - 50 µg (from stool) | Medium-High |
Optimized Experimental Protocols
Protocol for FFPE Tissue DNA Extraction (Heat-Induced, Enzyme-Assisted Lysis)
Materials: FFPE section (10-20 µm), xylene, absolute ethanol, proteinase K, specialized FFPE lysis buffer (e.g., with detergents), magnetic beads (silica-coated), elution buffer (TE or low-EDTA).
Method:
- Deparaffinization: Add 1 ml xylene to the sample, vortex, incubate at 56°C for 3 min. Centrifuge. Discard supernatant.
- Wash: Add 1 ml absolute ethanol, vortex, centrifuge. Discard supernatant. Air-dry pellet.
- Lysis: Resuspend in 180 µl lysis buffer and 20 µl proteinase K (20 mg/ml). Incubate at 56°C for 1-3 hours, followed by a 1-2 hour incubation at 90°C to reverse formaldehyde crosslinks.
- Purification: Bind DNA to magnetic silica beads per manufacturer's instructions. Wash twice with 80% ethanol.
- Elution: Air-dry beads and elute in 30-50 µl of pre-heated (65°C) elution buffer. Incubate at 65°C for 5 min before magnetic separation.
Protocol for Challenging Forensic Samples (Differential Lysis & Inhibitor Removal)
Materials: Swab or substrate, AL lysis buffer (Qiagen), carrier RNA, proteinase K, inhibitor removal beads (e.g., Sera-X, Qiagen PowerClean), magnetic silica beads, elution buffer.
Method:
- Lysis: Cut swab tip into a tube. Add AL buffer, carrier RNA, and proteinase K. Incubate at 56°C with shaking (900 rpm) for 1 hour.
- Inhibitor Removal: Add a defined volume of inhibitor removal slurry. Vortex, incubate at room temp for 5 min. Centrifuge and transfer supernatant to a new tube.
- DNA Binding: Add magnetic silica beads to the supernatant. Bind according to manufacturer's protocol.
- Wash: Perform two stringent washes with a wash buffer containing ethanol.
- Elution: Elute in a low-volume (20-30 µl) of low-EDTA TE or molecular-grade water.
Protocol for Microbial Community DNA (Mechanical & Enzymatic Lysis for Bias Reduction)
Materials: Sample (e.g., 200 mg stool, soil), PBS, lysozyme, mutanolysin, proteinase K, bead-beating tubes (0.1 mm zirconia/silica beads), SDS lysis buffer, phenol:chloroform:isoamyl alcohol (25:24:1), isopropanol, 70% ethanol.
Method:
- Pre-treatment: Suspend sample in PBS. Centrifuge to pellet coarse debris. Treat pellet with lysozyme (30 min, 37°C) and mutanolysin.
- Mechanical Lysis: Transfer to bead-beating tube. Add lysis buffer and beads. Beat in a homogenizer for 2-3 cycles of 45 sec each, with cooling on ice between cycles.
- Chemical Lysis: Add SDS and proteinase K. Incubate at 56°C for 1 hour.
- Purification: Extract with phenol:chloroform:isoamyl alcohol. Precipitate aqueous phase with isopropanol and glycogen.
- Wash & Elution: Wash pellet with 70% ethanol. Air-dry and resuspend in TE buffer. Optional: Clean with size-selection magnetic beads to remove residual inhibitors and small fragments.
Visualization of Workflows
Diagram 1: FFPE DNA Extraction Workflow
Diagram 2: Forensic DNA Extraction Workflow
Diagram 3: Microbiome DNA Extraction Workflow
The Scientist's Toolkit: Essential Research Reagents & Materials
Table 2: Key Reagent Solutions for Challenging Sample DNA Extraction
| Reagent/Material | Function | Key Application |
|---|---|---|
| Proteinase K | Broad-spectrum serine protease; digests histones and nucleases. | Universal for enzymatic lysis in FFPE, forensic, and microbiome protocols. |
| Magnetic Silica Beads | Paramagnetic particles coated with silica for reversible DNA binding. | High-throughput purification; used in FFPE and modern forensic protocols. |
| Inhibitor Removal Beads (e.g., Sera-X) | Functionalized particles that bind PCR inhibitors (humics, tannins, indigo). | Critical for forensic and environmental (soil, stool) sample cleanup. |
| Zirconia/Silica Beads (0.1 mm) | Dense, inert beads for mechanical disruption of tough cell walls. | Essential for unbiased lysis of Gram-positive bacteria in microbiome studies. |
| Carrier RNA | Co-precipitates with, and increases recovery of, very low quantity DNA. | Standard in forensic and low-biomass microbiome kits to improve yield. |
| Specialized FFPE Lysis Buffer | Contains detergents and buffering agents optimized for paraffin removal and crosslink reversal. | Maximizes recovery from FFPE tissues; often paired with high-heat steps. |
1. Introduction
Within the fundamental workflow of DNA extraction—cell lysis, purification, and elution—the transition from manual processing to automated high-throughput systems presents critical trade-offs. This technical guide examines the core considerations of implementing automation, focusing on the interlinked parameters of consistency, operational cost, and final nucleic acid yield. For researchers in genomics, diagnostics, and drug development, optimizing this balance is essential for scaling discoveries without compromising data integrity or fiscal viability.
2. Quantitative Trade-offs in Automated DNA Extraction
The decision to automate hinges on quantifiable metrics. The following tables consolidate current data from platform evaluations and life-cycle analyses.
Table 1: Performance Comparison of Manual vs. Automated DNA Extraction (96 samples)
| Parameter | Manual (Single Tech) | Automated Liquid Handler | Integrated Workstation |
|---|---|---|---|
| Total Hands-on Time | ~240 minutes | ~45 minutes | ~15 minutes |
| Total Process Time | ~4 hours | ~2.5 hours | ~2 hours |
| Yield Consistency (CV%) | 15-25% | 7-12% | 5-8% |
| A260/A280 Purity Avg. | 1.80 ± 0.15 | 1.85 ± 0.05 | 1.86 ± 0.03 |
| Cross-Contamination Risk | Medium-High | Low (with well design) | Very Low |
Table 2: Cost-Benefit Analysis Over 5 Years (High-Throughput Lab Scenario)
| Cost Factor | Manual ($) | Automated ($) | Notes |
|---|---|---|---|
| Capital Equipment | 10,000 | 150,000 | Automated: liquid handler + accessories |
| Annual Consumables | 50,000 | 65,000 | Higher cost per kit for automated formats |
| Annual Labor | 125,000 | 75,000 | Based on proportional FTE reduction |
| Annual Maintenance | 1,000 | 15,000 | Service contract for automated system |
| Total 5-Year Cost | ~ 710,000 | ~ 1,025,000 | |
| Total Samples Processed | 40,000 | 200,000 | Assumes 5x throughput for automated |
| Cost Per Sample | $17.75 | $5.13 | Includes capital depreciation |
3. Optimizing Core Steps for High-Throughput Automation
3.1. Cell Lysis Automated lysis must be robust across varied sample types.
- Methodology for Bead-Based Homogenization: Program a handler to aspirate 200 µL of sample (e.g., tissue homogenate, bacterial culture) and dispense into a 96-well plate containing 0.5mm silica/zirconia beads and 400 µL of lysis/binding buffer. Seal the plate with a pierceable mat. Transfer the sealed plate to a high-frequency, high-throughput plate shaker. Program a shaking protocol of 2,800 RPM for 90 seconds, pause for 30 seconds (to prevent overheating), and repeat for a total of 4 cycles. This mechanical lysis is compatible with downstream magnetic-bead purification.
3.2. Purification Magnetic bead-based purification is the de facto standard for automation.
- Detailed Protocol for Magnetic Bead Cleanup:
- Binding: Following lysis, the handler adds 50 µL of well-mixed magnetic silica bead suspension directly to the lysate. It then performs slow, reciprocal mixing (10 cycles) to bind DNA.
- Immobilization: The plate is positioned on a magnetic stand (integrated or off-deck) for 180 seconds or until the supernatant clears.
- Washing: The handler aspirates and discards the supernatant. With the plate magnetized, it dispenses 500 µL of freshly prepared 80% ethanol wash buffer. After a 30-second incubation, it aspirates the wash. This step is repeated for a total of two washes.
- Drying: After removing the final wash, the plate remains magnetized for 5-10 minutes to allow residual ethanol to evaporate. Critical drying time is empirically determined to balance ethanol removal and bead over-drying, which impacts elution yield.
3.3. Elution Elution efficiency dictates final yield and concentration.
- Optimized Elution Method: The handler dispenses 50-100 µL of low-EDTA TE buffer or nuclease-free water (pre-heated to 55°C on deck) onto the dried bead pellet. It moves the plate off the magnetic stand and mixes by pipetting up and down 15 times, followed by orbital shaking at 800 RPM for 120 seconds at room temperature. The plate is returned to the magnetic stand for 120 seconds. The final eluate is then aspirated and transferred to a clean output plate.
4. Visualizing Workflows and Decision Logic
Automated DNA Extraction and QC Workflow
Automation Strategy Decision Logic
5. The Scientist's Toolkit: Research Reagent Solutions
Table 3: Essential Materials for Automated High-Throughput DNA Extraction
| Item | Function & Rationale |
|---|---|
| Magnetic Silica Beads | Surface-functionalized particles for selective DNA binding in high salt, enabling magnetic separation and automation. |
| Lysis/Binding Buffer (Gu-HCl) | Chaotropic salt solution (e.g., Guanidine Hydrochloride) denatures proteins and promotes DNA binding to silica. |
| 96-Well Deep-Well Plates | Polypropylene plates (2 mL well volume) withstand high-speed shaking and chemical exposure during lysis and washing. |
| Pierceable Sealing Mats | Provide a sterile seal to prevent aerosol contamination during bead beating while allowing robotic pipette access. |
| Ethanol Wash Buffer (80%) | Removes salts, proteins, and other contaminants from bead-bound DNA without causing elution. Fresh prep is critical. |
| Low-EDTA TE Buffer (pH 8.0) | Elution buffer stabilizes DNA; low EDTA prevents interference in downstream enzymatic assays like PCR. |
| Liquid Handler Tips (Filtered) | Disposable tips with aerosol barriers prevent cross-contamination and carryover between samples. |
Assessing Quality and Performance: A Guide to Validating and Comparing DNA Extraction Methods
Within the critical workflow of nucleic acid research—encompassing the fundamental steps of cell lysis, purification, and elution—the assessment of DNA quality and quantity is paramount. The success of downstream applications, from PCR and sequencing to cloning and drug development, hinges on accurate post-extraction analysis. This technical guide details the core Quality Control (QC) metrics provided by spectrophotometry, fluorometry, and gel electrophoresis, forming an essential toolkit for researchers and scientists.
Spectrophotometry (UV Absorbance)
Spectrophotometry measures the absorption of ultraviolet light by nucleic acids and common contaminants.
Experimental Protocol (NanoDrop/Microvolume Spectrophotometer):
- Initialize the instrument and perform a blank measurement with the elution buffer (e.g., TE buffer, nuclease-free water).
- Carefully pipette 1-2 µL of the purified DNA sample onto the measurement pedestal.
- Lower the sampling arm and initiate the measurement.
- The software records absorbance at 230nm, 260nm, 280nm, and often 320nm.
- Clean the pedestal thoroughly with lint-free lab wipes and deionized water.
Key Ratios and Interpretations:
- A260/A280: Assesses protein contamination. Pure DNA has a ratio of ~1.8.
- A260/A230: Assesses contamination by salts, chaotropic agents, or organic compounds (e.g., phenol, EDTA). Pure DNA typically has a ratio of 2.0-2.2.
Table 1: Spectrophotometric QC Metrics and Interpretation
| Metric | Target Value (Pure DNA) | Significance of Deviation |
|---|---|---|
| A260/A280 | 1.8 | <1.8: Protein/phenol contamination. >1.8: Possible RNA contamination. |
| A260/A230 | 2.0 - 2.2 | Significantly <2.0: Contamination with salts, carbohydrates, or guanidine. |
| A320 (Turbidity) | ~0 | High absorbance indicates particulate matter or light scattering. |
Fluorometry
Fluorometry utilizes DNA-binding fluorescent dyes to provide specific quantitation, unaffected by common contaminants or the presence of RNA.
Experimental Protocol (Qubit Assay):
- Prepare the working solution by diluting the fluorescent dye concentrate in the assay buffer.
- Prepare standards (e.g., 0 ng/µL and a known high standard) and samples by mixing 1-20 µL of DNA with the working solution in assay tubes (total volume 200 µL).
- Vortex briefly and incubate at room temperature, protected from light, for 2-5 minutes.
- Insert tubes into the fluorometer, select the appropriate assay (e.g., dsDNA High Sensitivity), and run standards followed by samples.
- The instrument calculates concentration based on the standard curve.
Table 2: Comparative Analysis of DNA Quantitation Methods
| Parameter | UV Spectrophotometry (NanoDrop) | Fluorometry (Qubit) |
|---|---|---|
| Principle | UV light absorbance at 260nm | Fluorescence of dye bound specifically to dsDNA |
| Sample Volume | 1-2 µL | 1-20 µL |
| Specificity | Low (measures all nucleic acids) | High (specific to dsDNA or ssDNA) |
| Contaminant Interference | Highly susceptible | Minimal to none |
| Ideal Use Case | Initial purity check, concentrated samples | Accurate quantitation for sensitive applications (NGS, cloning) |
Gel Electrophoresis
This technique provides qualitative and semi-quantitative assessment of DNA integrity, size, and the presence of contamination.
Experimental Protocol (Agarose Gel Electrophoresis):
- Prepare an agarose gel (0.8%-2.0% depending on fragment size) in 1X TAE or TBE buffer, with a nucleic acid stain (e.g., ethidium bromide, SYBR Safe).
- Mix 1-5 µL (50-100 ng) of DNA sample with 6X loading dye.
- Load the mixture into wells alongside a DNA ladder of known molecular weights.
- Run the gel at 5-10 V/cm until the dye front migrates sufficiently.
- Visualize under UV or blue light transillumination.
Key Observations:
- Intact Genomic DNA: A single, high-molecular-weight band near the well.
- Degraded DNA: A smear extending downward from the high-molecular-weight position.
- RNA Contamination: A diffuse smear or low-molecular-weight bands below 500 bp.
- Residual Contaminants: Distorted band migration or fluorescent background.
The Scientist's Toolkit: Research Reagent Solutions
Table 3: Essential Materials for DNA QC Assessment
| Reagent/Material | Function |
|---|---|
| TE Buffer (pH 8.0) | Standard elution/dilution buffer; EDTA chelates nucleases, Tris stabilizes pH. |
| Fluorometric dsDNA HS Assay Kit | Provides dye and buffer for highly specific, sensitive quantitation of low-abundance DNA. |
| DNA Ladder (e.g., 1 kb plus) | Molecular weight standard for sizing DNA fragments on agarose gels. |
| Agarose (Molecular Biology Grade) | Matrix for gel electrophoresis; separates DNA fragments by size. |
| Intercalating Dye (e.g., SYBR Safe) | Binds specifically to dsDNA and fluoresces under blue light for safe visualization. |
| 6X DNA Loading Dye | Contains glycerol to sink samples into wells and tracking dyes to monitor migration. |
| TAE or TBE Buffer (10X) | Provides ionic conductivity and buffering capacity for gel electrophoresis. |
Workflow and Data Interpretation Diagrams
Title: Integrated DNA QC Assessment Workflow
Title: Interpreting Spectrophotometric A260/A280 Ratios
A robust DNA QC strategy integrates all three complementary techniques. Spectrophotometry offers a rapid purity screen, fluorometry delivers precise concentration for sensitive workflows, and gel electrophoresis confirms structural integrity. This multi-faceted assessment, conducted after the elution step, is non-negotiable for ensuring the reliability of data in subsequent research and development phases.
Within the fundamental workflow of DNA extraction—comprising cell lysis, purification, and elution—the choice of purification technology is pivotal. This technical guide provides an in-depth comparison of three core methodologies: silica columns, magnetic beads, and precipitation methods. Each technique exploits distinct biochemical principles to isolate nucleic acids from lysates, with significant implications for yield, purity, automation potential, and throughput in research and drug development.
Core Principles and Methodologies
Silica Column (Spin-Column) Technology This method relies on the high-affinity binding of DNA to a silica membrane under chaotropic salt conditions. The lysate is passed through a column under centrifugal force. DNA binds while contaminants are washed away. Elution in a low-ionic-strength buffer (e.g., TE or water) releases pure DNA.
- Key Principle: DNA adsorption to silica in the presence of high chaotropic salt concentrations.
- Experimental Protocol: 1) Load lysate onto column. 2) Centrifuge at ≥10,000 x g for 1 minute. 3) Discard flow-through. 4) Add wash buffer (often ethanol-based). 5) Centrifuge for 1 minute; repeat wash step. 6) Centrifuge empty column for 2 minutes to dry membrane. 7) Apply elution buffer to membrane center. 8) Incubate 1-2 minutes, centrifuge for 2 minutes to collect DNA.
Magnetic Bead Technology Paramagnetic or superparamagnetic beads coated with a silica surface bind DNA in the presence of chaotropic salts and polyethylene glycol (PEG). An external magnet is used to immobilize the bead-DNA complex, allowing for facile washing and elution without centrifugation.
- Key Principle: Solid-phase reversible immobilization (SPRI) on paramagnetic particles.
- Experimental Protocol: 1) Add magnetic beads and binding buffer (containing PEG and salt) to lysate. 2) Incubate for 5 minutes with mixing. 3) Place tube on a magnet; wait 2-5 minutes for supernatant clearance. 4) Discard supernatant. 5) With tube on magnet, add wash buffer (80% ethanol); incubate 30 seconds; discard. 6) Repeat wash. 7) Air-dry beads for 5-10 minutes. 8) Resuspend beads in elution buffer. 9) Incubate 2 minutes, place on magnet, and transfer pure eluate.
Precipitation Methods (Organic & Salting-Out) These classic methods involve deproteination followed by DNA precipitation using alcohol. The phenol-chloroform method denatures and partitions proteins into an organic phase, leaving DNA in the aqueous phase. Ethanol/isopropanol precipitation then concentrates the DNA.
- Key Principle: Liquid-liquid partitioning and differential solubility of nucleic acids in alcohol.
- Experimental Protocol (Phenol-Chloroform): 1) Add equal volume phenol:chloroform:isoamyl alcohol (25:24:1) to lysate. 2) Mix vigorously; centrifuge at 12,000 x g for 5 minutes. 3) Transfer aqueous (top) phase to new tube. 4) Add 1/10 volume 3M sodium acetate (pH 5.2) and 2-2.5 volumes ice-cold 100% ethanol. 5) Mix; incubate at -20°C for 30+ minutes. 6) Centrifuge at >12,000 x g for 15 minutes at 4°C to pellet DNA. 7) Discard supernatant. 8) Wash pellet with 70% ethanol. 9) Centrifuge for 5 minutes; discard ethanol. 10) Air-dry pellet for 5-15 minutes. 11) Resuspend in elution buffer.
Comparative Data Analysis
The following tables summarize quantitative performance metrics and operational characteristics based on current literature and product specifications.
Table 1: Performance Metrics Comparison
| Metric | Silica Columns | Magnetic Beads | Precipitation |
|---|---|---|---|
| Typical Yield (%) | 60-80% | 70-90% | 50-70% |
| Purity (A260/A280) | 1.7-1.9 | 1.8-2.0 | 1.6-1.8 (often lower) |
| DNA Size Range | Up to 50 kb (standard) | Up to 150+ kb (specialized) | Full genomic DNA (very high MW) |
| Inhibitor Removal | High | High | Low to Moderate |
| Processing Time (for 12 samples) | 20-30 minutes | 15-25 minutes (manual); faster automated | 60-90 minutes |
Table 2: Operational & Practical Considerations
| Consideration | Silica Columns | Magnetic Beads | Precipitation |
|---|---|---|---|
| Ease of Automation | Moderate (requires centrifugation) | High (liquid handling only) | Low |
| Throughput Scalability | Medium (batch centrifugation) | High (96-well + robotics) | Low |
| Cost per Sample | Medium | Low to Medium (bulk reagents) | Very Low |
| Hazardous Waste | Low (ethanol-based washes) | Low (ethanol-based washes) | High (phenol, chloroform) |
| Required Hands-on Time | Medium | Low | High |
| Suitability for High-Throughput Sequencing | Good | Excellent | Poor |
The Scientist's Toolkit: Essential Reagent Solutions
| Item | Primary Function |
|---|---|
| Chaotropic Salt (e.g., Guanidine HCl) | Disrupts hydrogen bonding, denatures proteins, and enables DNA binding to silica in column/bead methods. |
| Silica Matrix (Membrane or Beads) | Solid-phase substrate for selective DNA adsorption. |
| Polyethylene Glycol (PEG) | Promotes nucleic acid aggregation and binding to magnetic beads via a "molecular crowding" effect. |
| Wash Buffer (Ethanol-Based) | Removes salts and residual contaminants while keeping DNA bound to the silica matrix. |
| Elution Buffer (TE or Tris Low-EDTA) | Low-ionic-strength solution disrupts DNA-silica interaction, releasing purified DNA. |
| Phenol:Chloroform:Isoamyl Alcohol | Organic mixture that denatures and partitions proteins away from aqueous nucleic acids. |
| 3M Sodium Acetate (pH 5.2) | Provides counter-ions to neutralize DNA phosphate backbone, facilitating alcohol precipitation. |
Method Selection and Application Context
- Silica Columns: Ideal for routine, medium-throughput lab work where consistency and high purity are required (e.g., PCR, cloning, clinical diagnostics).
- Magnetic Beads: The preferred choice for automation, ultra-high-throughput applications (e.g., NGS library preparation, population genomics), and rapid processing.
- Precipitation Methods: Used when cost is paramount, for very high molecular weight DNA (e.g., genomic DNA for PacBio sequencing), or when specific downstream applications require removal of small molecules.
Visualized Workflows
Title: Silica Column DNA Extraction Workflow
Title: Magnetic Bead DNA Extraction Workflow
Title: Organic Precipitation DNA Extraction Workflow
The efficacy of any downstream genomic application—Polymerase Chain Reaction (PCR), sequencing, or microarray analysis—is fundamentally constrained by the quality and suitability of the input DNA. This validation process is a critical extension of the core DNA extraction workflow, which comprises cell lysis, purification, and elution. The extraction method must be selected and optimized with the specific downstream application in mind, as each imposes unique requirements on DNA attributes such as purity, integrity, concentration, and absence of inhibitors. This guide provides a technical framework for validating DNA extracts to ensure they are fit-for-purpose.
DNA Quality Parameters and Their Impact on Downstream Applications
Each downstream application has distinct sensitivities to different DNA quality parameters. The following table summarizes key quantitative thresholds and their impacts.
Table 1: DNA Quality Requirements for Major Downstream Applications
| Quality Parameter | PCR (qPCR/dPCR) | Next-Generation Sequencing (NGS) | Microarrays (e.g., CGH, SNP) |
|---|---|---|---|
| Purity (A260/A280) | 1.8 - 2.0 (Critical) | 1.8 - 2.0 | 1.8 - 2.0 |
| Purity (A260/A230) | >2.0 (Critical for inhibitors) | >2.0 | >1.8 |
| Integrity (DV200 for FFPE) | Not critical for short amplicons | >50-70% (application-dependent) | >50% |
| Fragment Size | >200 bp sufficient | Application-specific (e.g., 300bp for WGS) | Large (>2 kb) for some platforms |
| Concentration Range | Wide (fg-ng/µL) | Narrow (1-10 ng/µL for library prep) | Specific (e.g., 50-250 ng/µL) |
| Key Inhibitors | Hemoglobin, heparin, phenol, ionic detergents | Carryover silica beads, EDTA, phenol | Proteins, organic solvents |
| Primary Quality Assessment | qPCR inhibition assay (dilution test) | Fluorometry, qPCR-based QC (e.g., Qubit, qPCR) | UV-Vis Spectrophotometry, Gel Electrophoresis |
Validation Protocols for Key Applications
PCR Fitness Validation
Protocol: Standardized Dilution Amplification Efficiency Test
- Preparation: Dilute the extracted DNA sample in a series (e.g., 1:1, 1:10, 1:100) using nuclease-free water or TE buffer.
- qPCR Setup: For each dilution, set up a qPCR reaction targeting a single-copy reference gene (e.g., RNase P, GAPDH) and a multi-copy target (e.g., mitochondrial gene) if assessing sample degradation. Use a standardized master mix.
- Run and Analyze: Perform qPCR. Calculate amplification efficiency (E) from the standard curve generated from the dilution series. Ideal efficiency = 90-110%. A significant drop in efficiency at lower dilutions indicates the presence of PCR inhibitors.
- Interpretation: DNA is fit-for-purpose for PCR if the amplification efficiency is within the ideal range and the Cq values are as expected for the template concentration.
Sequencing Fitness Validation (NGS Focus)
Protocol: Fluorometric Quantification and Fragment Analyzer Assessment
- Quantification: Use a fluorescent dye-based assay (e.g., Qubit dsDNA HS Assay) for accurate concentration measurement. Do not rely solely on A260.
- Integrity Analysis: Analyze DNA integrity using a Fragment Analyzer, TapeStation, or agarose gel electrophoresis. For FFPE samples, calculate the DV200 value (percentage of fragments >200 bp).
- Library Prep QC: Perform a small-scale test library preparation. After adapter ligation and PCR enrichment, quantify the library yield (Qubit) and profile its size distribution (Fragment Analyzer).
- Interpretation: DNA is fit-for-purpose if its concentration is accurately known, its integrity meets the platform-specific threshold (e.g., DV200 > 50% for whole-exome), and the test library shows a distinct peak in the expected size range with minimal adapter dimer.
Microarray Fitness Validation
Protocol: UV-Vis Spectrophotometry and Electrophoretic Integrity Check
- Purity Assessment: Measure absorbance at 230nm, 260nm, and 280nm. Calculate A260/A280 and A260/A230 ratios. Acceptable ranges are 1.8-2.0 and >1.8, respectively.
- Concentration Calculation: Determine concentration using the formula: [DNA] = A260 × 50 ng/µL × dilution factor.
- Visual Integrity Check: Run 100-200 ng of DNA on a 0.8-1.0% agarose gel. High-molecular-weight genomic DNA should appear as a tight, high-mass band with minimal smearing toward lower molecular weights.
- Interpretation: DNA is fit-for-purpose for microarrays if purity ratios are optimal, the concentration is sufficient for labeling, and the gel shows a predominant high-molecular-weight band.
Visualization of the Validation Workflow
Decision Workflow for DNA Fit-for-Purpose Validation
The Scientist's Toolkit: Essential Research Reagent Solutions
Table 2: Key Reagents and Kits for DNA Validation
| Item / Kit Name | Primary Function | Application Relevance |
|---|---|---|
| Qubit dsDNA HS/BR Assay Kits | Fluorometric, dye-based accurate DNA quantification. | Critical for NGS library quantification; insensitive to RNA/salt. |
| Agilent TapeStation / Fragment Analyzer | Capillary electrophoresis for precise sizing and integrity number (e.g., DIN, DV200). | Gold standard for NGS and microarray DNA integrity assessment. |
| PCR Inhibitor Detection Spin Columns | Selective removal of humic acids, heparin, hematin, etc. | Remediation of samples failing the dilution efficiency test. |
| RNase A | Degrades contaminating RNA that can inflate UV absorbance readings. | Essential for clean A260/A280 ratios prior to microarray analysis. |
| SPRI (Solid Phase Reversible Immobilization) Beads | Size-selective cleanup and purification of DNA fragments. | Core reagent for NGS library purification and size selection. |
| TaqMan-based DNA QC Assays | qPCR assays targeting single- and multi-copy genomic regions. | Quantifies amplifiable DNA and detects degradation (e.g., FFPE). |
| PicoGreen / Quant-iT dsDNA Assay | High-sensitivity fluorescent DNA quantitation for plate readers. | Alternative to Qubit for high-throughput sample screening. |
| Proteinase K | Broad-spectrum serine protease for digesting contaminating proteins. | Critical component of lysis buffers; used in post-elution cleanup. |
Within the fundamental workflow of DNA extraction—cell lysis, purification, and elution—a critical operational decision is whether to use commercial extraction kits or develop in-house reagent solutions. This analysis provides a technical framework for evaluating the cost, quality, scalability, and time implications of both approaches for research and clinical-scale applications in drug development and molecular biology.
Quantitative Cost-Benefit Framework
The total cost of ownership (TCO) for DNA extraction extends beyond per-sample reagent costs to include labor, equipment, validation, and quality control. The following tables summarize core quantitative data.
Table 1: Direct Cost & Time Comparison per 100 Samples (Typical Mammalian Cell DNA)
| Component | Commercial Spin-Column Kit | In-House (Phenol-Chloroform) | In-House (Silica-Magnetic Beads) |
|---|---|---|---|
| Reagent Cost | $200 - $500 | $50 - $150 | $75 - $200 |
| Hands-on Time | 1.5 - 2.5 hours | 3 - 5 hours | 2 - 3.5 hours |
| Total Process Time | ~2 hours | ~4-6 hours (incl. phase sep.) | ~2.5 hours |
| Yield Range | 1-5 µg ± 15% | 5-20 µg ± 25% | 2-8 µg ± 20% |
| A260/A280 Purity | 1.8 - 2.0 | 1.7 - 1.9 (often carries over organics) | 1.8 - 2.0 |
| Amenable to Automation | High | Low | Very High |
Table 2: Indirect Cost & Operational Factors
| Factor | Commercial Kit | In-House Reagents |
|---|---|---|
| Initial R&D/Protocol Optimization | Minimal | Significant (weeks to months) |
| QC/Validation Burden | Lower (vendor's CoA) | High (in-house responsibility) |
| Scalability Flexibility | Moderate (batch size constraints) | High (can mix bulk reagents) |
| Supply Chain Risk | Vendor-dependent | Dependent on raw material stocks |
| Waste Management | Pre-defined, often plastic-heavy | Variable, may involve hazardous waste (phenol) |
| Regulatory Support (IVD/GMP) | Often available (for a premium) | Must be generated in-house |
Detailed Methodologies for Key Experiments
Protocol 1: In-House Phenol-Chloroform Isoamyl Alcohol (PCI) DNA Extraction
Purpose: High-yield, cost-effective genomic DNA isolation from tissues. Reagents: Lysis Buffer (10 mM Tris-Cl pH 8.0, 100 mM EDTA, 0.5% SDS), Proteinase K (20 mg/mL), PCI (25:24:1), Chloroform, 100% Ethanol, 70% Ethanol, TE Buffer. Procedure:
- Cell Lysis: Homogenize tissue in 500 µL Lysis Buffer. Add 5 µL Proteinase K. Incubate at 55°C overnight with agitation.
- Purification: Add equal volume PCI (500 µL). Mix vigorously for 1 minute. Centrifuge at 12,000 x g for 10 minutes at 4°C. Transfer aqueous top phase to a fresh tube.
- Repeat step 2 with chloroform only.
- Precipitation: Add 0.1 volume 3M sodium acetate (pH 5.2) and 2.5 volumes ice-cold 100% ethanol. Mix by inversion. Precipitate at -20°C for 1 hour.
- Pellet: Centrifuge at 12,000 x g for 20 minutes at 4°C. Wash pellet with 500 µL 70% ethanol. Air dry 10 minutes.
- Elution: Resuspend DNA pellet in 50-100 µL TE Buffer. Incubate at 55°C for 1 hour to dissolve. Quantify via spectrophotometry.
Protocol 2: In-House Silica Magnetic Bead DNA Extraction
Purpose: Automatable, high-throughput DNA purification for clinical scales. Reagents: Guanidine HCl Lysis Buffer (4M), Silica-coated magnetic beads (e.g., 10 mg/mL), Isopropanol, Wash Buffer (10 mM Tris-Cl pH 7.5, 80% Ethanol), Elution Buffer (10 mM Tris-Cl, pH 8.5). Procedure:
- Cell Lysis: Combine 200 µL sample with 200 µL Guanidine HCl Lysis Buffer. Vortex thoroughly.
- Binding: Add 20 µL magnetic bead suspension and 200 µL isopropanol. Mix by pipetting. Incubate at RT for 5 minutes.
- Capture: Place tube on magnetic rack for 2 minutes until clear. Discard supernatant.
- Wash (x2): With tube on magnet, add 500 µL Wash Buffer. Resuspend beads fully off magnet. Return to magnet, discard supernatant.
- Dry: Air dry beads on magnet for 5-10 minutes.
- Elution: Remove from magnet. Add 50 µL Elution Buffer. Resuspend beads and incubate at 65°C for 5 minutes. Capture beads on magnet and transfer eluted DNA to a clean tube.
Decision Pathways and Workflows
Decision Tree: Kit vs. In-House Workflow
DNA Extraction Workflow & Component Mapping
The Scientist's Toolkit: Essential Research Reagent Solutions
Table 3: Key Reagents for DNA Extraction Protocols
| Item | Function in DNA Extraction | Typical Formulation/Example |
|---|---|---|
| Proteinase K | Serine protease that digests nucleases and structural proteins during lysis, preventing DNA degradation. | 20 mg/mL stock in storage buffer (e.g., 10 mM Tris-HCl, pH 7.5). |
| Guanidine HCl | Chaotropic salt. Disrupts hydrogen bonding, denatures proteins, and facilitates DNA binding to silica surfaces. | 4-6 M solution in lysis/binding buffer. |
| Silica Magnetic Beads | Solid-phase support for DNA binding via chaotrope-salt mediation. Enables automatable magnetic separation. | Paramagnetic particles with a silica coating, suspended in storage solution with preservatives. |
| Phenol-Chloroform-Isoamyl Alcohol (PCI) | Organic solvent mixture for liquid-liquid extraction. Denatures and dissolves proteins/lipids, leaving DNA in aqueous phase. | Ratio 25:24:1, saturated with Tris buffer (pH 7.9-8.0). Isoamyl alcohol reduces foaming. |
| Spin Column (Silica Membrane) | Miniaturized silica filter for solid-phase purification. DNA binds in high-salt, washed, and eluted in low-salt buffer. | Polyethylene frit with embedded silica membrane in a plastic column. |
| Ethanol (70-100%) | Wash agent to remove salts and residual contaminants without eluting DNA from silica. Also used in precipitation. | Prepared with molecular biology-grade water and absolute ethanol. |
| TE Buffer | Standard elution/storage buffer. Tris maintains pH, EDTA chelates Mg2+ to inhibit nucleases. | 10 mM Tris-HCl, 1 mM EDTA, pH 8.0. |
The choice between kits and in-house reagents is not static but depends on the evolving priorities of scale, cost, quality, and time. For research-scale projects with unique sample types or extreme cost constraints, in-house methods offer flexibility. For clinical-scale work requiring high throughput, robust validation, and regulatory compliance, commercial kits often provide a lower total risk profile despite higher per-unit cost. A hybrid strategy, using kits for routine applications and in-house methods for specialized, high-volume needs, is common in large-scale drug development operations.
Within the critical workflow of DNA extraction—comprising cell lysis, purification, and elution—the selection of specific methodologies is foundational to downstream success in drug development and diagnostics. The purity, yield, and integrity of extracted nucleic acids directly influence the reliability of genomic, transcriptomic, and epigenomic analyses. This guide presents case studies where methodological choices in DNA extraction and subsequent analysis are driven by precise research objectives, from biomarker discovery to pharmacogenomic profiling.
Case Study 1: Circulating Tumor DNA (ctDNA) Analysis for Oncology Diagnostics
Research Goal: Isolate and sequence ultra-low abundance ctDNA from patient plasma for non-invasive cancer diagnosis and monitoring of minimal residual disease (MRD).
Method Selection Rationale: Standard silica-membrane column kits often fail to recover fragmented, low-concentration ctDNA efficiently. Methods prioritizing high recovery of short fragments are essential.
Detailed Protocol: Magnetic Bead-Based ctDNA Extraction and NGS Library Prep
- Sample Preparation: Collect 10 mL of peripheral blood in Streck Cell-Free DNA BCT tubes. Centrifuge at 1,600 x g for 10 min at 4°C to separate plasma. Transfer supernatant and perform a second centrifugation at 16,000 x g for 10 min to remove residual cells.
- Cell Lysis: Mix 4-5 mL of plasma with an equal volume of Proteinase K and a proprietary lysis buffer (containing 4M guanidine hydrochloride, 0.5% SDS, 10 mM Tris-HCl pH 8.0). Incubate at 56°C for 30 min with agitation.
- Purification: Add paramagnetic carboxylate beads (size-selected for optimal binding of 80-250 bp fragments) in a binding buffer containing PEG-8000. Bind for 15 min with rotation. Capture beads on a magnetic rack, wash twice with 80% ethanol.
- Elution: Dry beads briefly and elute ctDNA in 25 µL of 10 mM Tris-HCl, pH 8.5. Quantify using a droplet digital PCR (ddPCR) assay specific for a single-copy gene.
- Library Preparation: Use a commercially available library prep kit optimized for low-input, fragmented DNA (e.g., incorporating unique molecular identifiers - UMIs). Perform size selection (140-220 bp) using double-sided SPRI bead cleanup.
Key Performance Data: Table 1: Comparison of ctDNA Extraction Methods
| Method | Input Plasma Volume | Median DNA Yield | Fragment Size Profile | Limit of Detection (VAF) | Suitability for MRD |
|---|---|---|---|---|---|
| Silica Column (QIAamp) | 2 mL | 15 ng | Skewed to >500 bp | ~1% | Low |
| Magnetic Beads (Maximized Recovery) | 5 mL | 42 ng | Enriched at 160-180 bp | ~0.1% | High |
| Precipitation-based | 3 mL | 30 ng | Broad, includes proteins | ~0.5% | Medium |
Title: ctDNA Extraction and Analysis Workflow for MRD Detection
Case Study 2: High-Throughput Pharmacogenomic (PGx) Screening
Research Goal: Extract high-quality genomic DNA from thousands of buccal swab or blood samples for reliable SNP genotyping on microarray platforms.
Method Selection Rationale: Throughput, cost-effectiveness, and consistency are paramount. Automation compatibility and high DNA purity (A260/A280 ~1.8) are required to prevent microarray hybridization artifacts.
Detailed Protocol: 96-Well Plate Salting-Out DNA Extraction
- Cell Lysis: Transfer buccal swab heads or 100 µL of whole blood to a deep-well plate. Add 500 µL of Lysis Solution (10 mM Tris-HCl pH 8.0, 10 mM EDTA, 50 mM NaCl, 0.5% SDS) and 10 µL of Proteinase K (20 mg/mL). Seal plate, mix, and incubate at 56°C for 1 hour with shaking.
- Protein Precipitation: Cool plate to room temperature. Add 200 µL of saturated ammonium acetate (6-7 M) solution. Vortex vigorously for 30 seconds. Centrifuge at 4000 x g for 10 min.
- DNA Precipitation: Transfer supernatant to a new 96-well plate containing 600 µL of 100% isopropanol. Invert plate gently 50 times. Centrifuge at 4000 x g for 15 min. Decant supernatant carefully.
- Purification: Wash pellet with 500 µL of 70% ethanol. Centrifuge at 4000 x g for 5 min. Decant and air-dry pellet for 15-20 min.
- Elution: Resuspend DNA in 100 µL of Low TE Buffer (10 mM Tris-HCl, 0.1 mM EDTA, pH 8.0). Seal plate and incubate at 4°C overnight with gentle shaking. Quantify via UV spectrophotometry on a plate reader.
Key Performance Data: Table 2: High-Throughput DNA Extraction Methods for PGx
| Method | Throughput (Samples/Day) | Cost per Sample | Average Yield (Buccal) | A260/A280 Ratio | Automation Friendly |
|---|---|---|---|---|---|
| Manual Column | 96 | High | 2-5 µg | 1.7-1.9 | No |
| 96-Well Salting-Out | 960 | Very Low | 3-8 µg | 1.8-2.0 | Yes (Liquid Handler) |
| Magnetic Bead (Automated) | 1536 | Low | 2-6 µg | 1.8-1.9 | Yes |
Title: High-Throughput Salting-Out DNA Extraction for PGx
The Scientist's Toolkit: Key Research Reagent Solutions
Table 3: Essential Reagents for DNA Extraction in Featured Case Studies
| Reagent / Material | Function | Critical Property | Example Use Case |
|---|---|---|---|
| Guanidine Hydrochloride (GuHCl) | Chaotropic agent. Denatures proteins, disrupts H-bonds, and enables nucleic acid binding to silica/magnetic beads. | High molar concentration (4-6 M). | Cell lysis and conditioning in column/bead-based kits. |
| Proteinase K | Serine protease. Digests nucleases and structural proteins, enhancing DNA yield and stability. | Broad activity, stable in SDS and at high temp (56°C). | Digestion step in both ctDNA and PGx protocols. |
| Carboxylate-Modified Magnetic Beads | Solid-phase for DNA binding. Surface chemistry allows reversible DNA binding in PEG/salt conditions. | Size uniformity; optimized surface area for fragment-specific binding. | Selective capture of short-fragment ctDNA. |
| Polyethylene Glycol (PEG) 8000 | Polymer that causes macromolecular crowding, precipitating DNA onto beads or out of solution. | Specific molecular weight for size-selective precipitation. | Increase binding efficiency of short DNA to beads. |
| Saturated Ammonium Acetate | Salt solution for "salting-out" proteins. Proteins precipitate while DNA remains in solution. | High ionic strength, near-neutral pH. | Protein removal in high-throughput salting-out protocol. |
| Solid-Phase Reversible Immobilization (SPRI) Beads | Magnetic beads for size-selective cleanup and concentration of DNA. | Controlled bead size and carboxylate coating. | NGS library purification and size selection. |
| Unique Molecular Identifiers (UMIs) | Short random nucleotide tags ligated to DNA fragments pre-amplification. | High complexity to tag individual molecules. | Error correction in ctDNA sequencing for ultra-sensitive variant detection. |
| Low-EDTA TE Buffer | Elution and storage buffer. Tris maintains pH; minimal EDTA prevents inhibition of downstream enzymes. | 0.1 mM EDTA or less (vs. standard 1 mM). | Elution of DNA for PCR/NGS applications. |
Conclusion
Successful DNA extraction, built upon the robust execution of lysis, purification, and elution, is a non-negotiable foundation for credible research and diagnostic outcomes. Mastering these steps—from selecting the appropriate methodological approach to rigorous troubleshooting and validation—ensures the isolation of high-quality DNA that faithfully supports downstream analyses. As biomedical research advances towards single-cell genomics, liquid biopsies, and point-of-care diagnostics, the principles of efficient and reproducible nucleic acid isolation will remain paramount. Future directions will likely involve further integration of automation, development of rapid, inhibitor-resistant chemistries, and standardized protocols that bridge research and clinical validation, directly impacting the pace of drug discovery and personalized medicine.