Mastering ChIP-seq: A Complete Guide to Profiling Genome-Wide Protein-DNA Interactions
This comprehensive guide provides researchers, scientists, and drug development professionals with a complete framework for Chromatin Immunoprecipitation followed by sequencing (ChIP-seq).
Mastering ChIP-seq: A Complete Guide to Profiling Genome-Wide Protein-DNA Interactions
Abstract
This comprehensive guide provides researchers, scientists, and drug development professionals with a complete framework for Chromatin Immunoprecipitation followed by sequencing (ChIP-seq). We cover the fundamental principles of chromatin biology and protein-DNA binding, present a detailed, step-by-step optimized protocol from cell fixation to library preparation, address common troubleshooting and optimization challenges for low-input and difficult samples, and discuss rigorous validation strategies and comparative analysis with complementary techniques like CUT&RUN and ATAC-seq. This resource equips users to design robust ChIP-seq experiments for accurate identification of transcription factor binding sites, histone modifications, and chromatin regulators across the genome.
ChIP-seq Fundamentals: From Chromatin Biology to Binding Site Discovery
Chromatin Immunoprecipitation followed by sequencing (ChIP-seq) is the cornerstone method for mapping protein-DNA interactions across the entire genome in vivo. Within the context of a thesis on ChIP-seq protocol for genome-wide binding sites research, this Application Notes document details the core principles, current protocols, and essential resources. The method enables researchers to identify transcription factor binding sites, histone modifications, and other epigenetic markers critical for understanding gene regulation and developing targeted therapeutics.
Core Principle: CapturingIn VivoInteractions
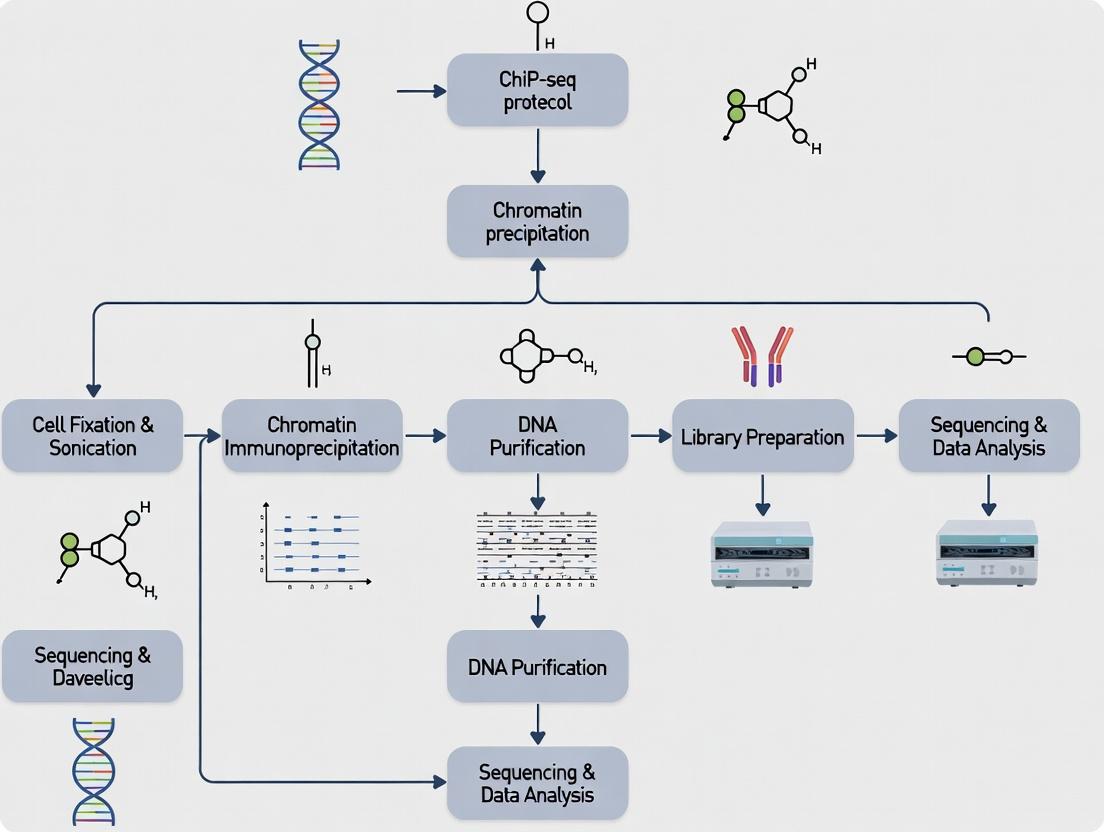
The fundamental principle of ChIP-seq is the cross-linking and stabilization of protein-DNA complexes as they exist inside living cells (in vivo), followed by their selective isolation and high-throughput sequencing. The workflow ensures that the captured DNA fragments represent genuine, biologically relevant interactions.
Key Sequential Steps:
- In Vivo Cross-linking: Cells/tissues are treated with formaldehyde, creating covalent bonds between proteins and the DNA they are bound to at that moment, "freezing" the interactome.
- Chromatin Fragmentation: The cross-linked chromatin is physically sheared (via sonication or enzymatic digestion) into small fragments (200–700 bp).
- Immunoprecipitation: An antibody specific to the protein of interest (e.g., a transcription factor or modified histone) is used to pull down the protein-DNA complexes.
- Cross-link Reversal & DNA Purification: Protein-DNA cross-links are reversed, proteins are digested, and the co-precipitated DNA is purified.
- Sequencing Library Prep & NGS: The DNA fragments are converted into a sequencing library, amplified, and sequenced using next-generation platforms.
- Bioinformatics Analysis: Reads are aligned to a reference genome, and regions with significant enrichment (peaks) are identified, representing putative binding sites.
Diagram: ChIP-seq Experimental Workflow
Detailed Protocols
Protocol 1: Standard Cross-linking & Sonication-based ChIP-seq for Cultured Cells
Objective: To map binding sites of a transcription factor in mammalian cell lines.
Materials: See "The Scientist's Toolkit" below.
Methodology:
- Cross-linking: Grow cells to 70-90% confluency. Add 1% formaldehyde directly to culture medium. Incubate for 10 min at room temperature with gentle shaking. Quench with 125 mM glycine for 5 min.
- Cell Lysis: Wash cells twice with cold PBS. Scrape and pellet cells. Resuspend pellet in 1 mL Cell Lysis Buffer I (with PMSF/PIC). Incubate 10 min on ice. Pellet nuclei.
- Nuclei Lysis & Sonication: Resuspend nuclei in 1 mL Nuclei Lysis Buffer. Sonicate using a focused ultrasonicator (e.g., Covaris) or bath sonicator to shear DNA to 200-500 bp fragments. Centrifuge to remove debris.
- Immunoprecipitation: Dilute chromatin 1:10 in ChIP Dilution Buffer. Pre-clear with Protein A/G beads for 1 hour at 4°C. Incubate supernatant with 2-5 µg of target-specific antibody overnight at 4°C. Add beads and incubate for 2 hours.
- Washes: Pellet beads and wash sequentially with: Low Salt Wash Buffer (once), High Salt Wash Buffer (once), LiCl Wash Buffer (once), and TE Buffer (twice).
- Elution & Reversal: Elute complexes twice with 250 µL Fresh Elution Buffer (1% SDS, 0.1M NaHCO3). Combine eluates, add NaCl to 200 mM, and reverse cross-links at 65°C overnight.
- DNA Purification: Treat with RNase A (30 min, 37°C) then Proteinase K (2 hours, 55°C). Purify DNA using silica-membrane columns or SPRI beads. Elute in 20-50 µL TE or nuclease-free water.
- Library Preparation & Sequencing: Use a commercial library prep kit (e.g., NEBNext Ultra II) for Illumina, following manufacturer's instructions. Sequence on an Illumina NovaSeq or NextSeq platform to obtain 20-40 million single-end 50bp reads per sample.
Protocol 2: Native ChIP-seq for Histone Modifications
Objective: To map histone modification profiles (e.g., H3K27ac) without cross-linking.
Key Variation: This protocol omits formaldehyde cross-linking, relying on micrococcal nuclease (MNase) to digest linker DNA between nucleosomes, preserving histone-DNA interactions natively.
- Nuclei Isolation: Wash and lyse cells in MNase Digestion Buffer. Pellet nuclei.
- MNase Digestion: Resuspend nuclei in digestion buffer. Add MNase enzyme and incubate at 37°C (typically 5-20 min) to yield mostly mononucleosomes. Stop with EGTA.
- Chromatin Release & IP: Lyse nuclei with mild detergent. Centrifuge. The supernatant containing soluble native chromatin is used directly for immunoprecipitation (as in Protocol 1, steps 4-8, but often with adjusted buffer compositions).
The Scientist's Toolkit: Essential Research Reagent Solutions
| Reagent/Material | Function & Explanation |
|---|---|
| Formaldehyde (37%) | Cross-linking agent that creates methylene bridges between proteins and DNA, freezing in vivo interactions. |
| Protease Inhibitor Cocktail (PIC) | Prevents proteolytic degradation of the target protein and chromatin complexes during extraction. |
| Protein A/G Magnetic Beads | Solid-phase support that binds the Fc region of antibodies, enabling efficient pull-down and washing of immune complexes. |
| Target-Validated Antibody | The critical reagent; must be highly specific and ChIP-grade to minimize off-target precipitation. |
| Micrococcal Nuclease (MNase) | Enzyme used in Native ChIP to digest linker DNA, generating mononucleosomes for histone mark analysis. |
| Covaris Focused-ultrasonicator | Instrument for consistent, reproducible acoustic shearing of cross-linked chromatin to desired fragment size. |
| SPRI (Solid Phase Reversible Immobilization) Beads | Magnetic beads for size-selective purification and cleanup of DNA during library prep and after IP. |
| NEBNext Ultra II DNA Library Prep Kit | A widely used, optimized commercial kit for constructing sequencing-compatible libraries from low-input ChIP DNA. |
| Illumina Sequencing Reagents (e.g., NovaSeq XP) | Flow cells and chemistry kits required for cluster generation and sequencing-by-synthesis on Illumina platforms. |
Table 1: Key Quantitative Parameters for a Robust ChIP-seq Experiment.
| Parameter | Typical Range / Value | Notes & Impact on Data |
|---|---|---|
| Formaldehyde Concentration | 0.5 - 1.5% | Lower (0.5-1%) for transcription factors; higher (1-1.5%) for loosely bound complexes. |
| Cross-linking Time | 5 - 15 minutes | Prolonged cross-linking (>15 min) reduces antigen accessibility and shearing efficiency. |
| Sonication Fragment Size | 200 - 700 bp | Optimal: 200-500 bp. Smaller fragments give higher resolution binding sites. |
| DNA Amount for IP | 5 - 25 µg | Depends on target abundance. Histones: 5-10 µg; TFs: 10-25 µg. |
| Antibody Amount per IP | 1 - 10 µg | Must be titrated. Too little reduces yield; too much increases background. |
| Sequencing Depth | 20 - 50 million reads | Histone marks: ~20M; TFs: 30-50M. Complex genomes require more reads. |
| Peak Calling p-value/q-value | 1e-5 to 1e-9 | Statistical threshold for identifying enriched regions. Lower for higher stringency. |
Diagram: ChIP-seq Data Analysis Pathway
The power of ChIP-seq lies in its direct capture of in vivo protein-DNA interactions, providing an unbiased view of the genomic landscape occupied by regulatory proteins. The protocols and tools detailed here form the foundation for generating high-quality, reproducible genome-wide binding data. This methodological rigor is essential for downstream analyses in gene regulation studies, biomarker discovery, and identifying novel therapeutic targets in drug development.
Application Notes
ChIP-seq (Chromatin Immunoprecipitation followed by sequencing) is the cornerstone technology for mapping the genomic locations of transcription factors (TFs), histone modifications, and chromatin regulators in vivo. This protocol enables researchers to decipher the regulatory circuitry controlling gene expression, a critical focus in basic research and drug discovery, particularly for diseases like cancer and neurological disorders.
Transcription Factor Mapping: Identifies precise DNA binding sites for sequence-specific TFs, revealing direct gene targets and core regulatory networks. Quantitative data from peak calling (e.g., -log10(p-value), fold enrichment) indicates binding strength.
Histone Modification Mapping: Provides an epigenetic landscape, marking active promoters (H3K4me3), enhancers (H3K27ac), repressed regions (H3K9me3, H3K27me3), and transcribed regions (H3K36me3). This is quantified as normalized read density (e.g., Reads Per Kilobase per Million mapped reads - RPKM).
Chromatin Regulator Mapping: Locates complexes like SWI/SNF, Polycomb, or histone modifiers (e.g., EZH2), linking their occupancy to downstream epigenetic and transcriptional outcomes.
Table 1: Representative Targets & Their Functional Interpretation
| Target Class | Specific Example | Typical Peak Location | Biological Significance | Common Analysis Metric |
|---|---|---|---|---|
| Transcription Factor | p53 | Promoters, Enhancers | Tumor suppressor, stress response | Peak score (p-value) |
| Activating Histone Mark | H3K27ac | Active Enhancers, Promoters | Marks active regulatory elements | Normalized Read Density (RPKM) |
| Repressive Histone Mark | H3K27me3 | Promoters of silenced genes | Polycomb-mediated repression | Broad peak size (kb) |
| Chromatin Regulator | BRG1 (SWI/SNF) | Nucleosome-depleted regions | ATP-dependent chromatin remodeling | Peak enrichment over Input |
Detailed Protocol: Cross-linked ChIP-seq for Transcription Factors
This protocol is optimized for mapping transcription factors with high resolution.
Day 1: Cell Fixation & Lysis
- Cell Culture & Crosslinking: Grow ~10^7 mammalian cells per immunoprecipitation (IP). Add 1% formaldehyde directly to culture medium. Incubate for 10 min at room temperature (RT) with gentle agitation.
- Quenching: Add glycine to a final concentration of 0.125 M. Incubate for 5 min at RT.
- Cell Harvesting: Wash cells twice with ice-cold PBS. Scrape and pellet cells. Flash-freeze pellet in liquid N2 or proceed.
- Cell Lysis: Resuspend pellet in 1 mL Cell Lysis Buffer (10 mM Tris-HCl pH 8.0, 10 mM NaCl, 0.2% NP-40) with protease inhibitors. Incubate 10 min on ice. Centrifuge at 5,000g for 5 min at 4°C. Discard supernatant.
- Nuclear Lysis: Resuspend nuclear pellet in 1 mL Nuclei Lysis Buffer (50 mM Tris-HCl pH 8.0, 10 mM EDTA, 1% SDS) with protease inhibitors. Incubate 10 min on ice.
Day 1: Chromatin Shearing
- Sonication: Sonicate lysate to shear DNA to an average fragment size of 200-500 bp. Use a focused ultrasonicator (e.g., Covaris) per manufacturer's protocol. Critical: Optimize cycles for your cell type and target.
- Clearing: Centrifuge sonicated lysate at 20,000g for 10 min at 4°C. Transfer supernatant (sheared chromatin) to a new tube. Dilute 10-fold with ChIP Dilution Buffer (16.7 mM Tris-HCl pH 8.0, 167 mM NaCl, 1.2 mM EDTA, 1.1% Triton X-100).
Day 2: Immunoprecipitation & Washing
- Pre-clearing (Optional): Add 50 µL of Protein A/G beads per IP. Rotate for 1 hour at 4°C. Centrifuge briefly, transfer supernatant to new tube.
- Antibody Incubation: Take 10 µL as "Input" control. Store at 4°C. Add 1-10 µg of target-specific antibody (validated for ChIP) to the chromatin. Rotate overnight at 4°C.
- Bead Capture: Add 50 µL pre-blocked Protein A/G beads. Rotate for 2 hours at 4°C.
- Washing: Pellet beads and wash sequentially for 5 min each on a rotator at 4°C with:
- Low Salt Wash Buffer (0.1% SDS, 1% Triton X-100, 2 mM EDTA, 20 mM Tris-HCl pH 8.0, 150 mM NaCl).
- High Salt Wash Buffer (0.1% SDS, 1% Triton X-100, 2 mM EDTA, 20 mM Tris-HCl pH 8.0, 500 mM NaCl).
- LiCl Wash Buffer (0.25 M LiCl, 1% NP-40, 1% deoxycholate, 1 mM EDTA, 10 mM Tris-HCl pH 8.0).
- TE Buffer (10 mM Tris-HCl pH 8.0, 1 mM EDTA). Perform twice.
Day 3: Elution & DNA Purification
- Elution: Prepare Elution Buffer (1% SDS, 0.1 M NaHCO3). Add 150 µL to beads and 150 µL to saved Input. Vortex and incubate at 65°C for 15 min with shaking. Pellet beads, transfer supernatant. Repeat elution, combine supernatants per sample.
- Reverse Crosslinking: Add NaCl to a final concentration of 0.2 M to all samples (IPs and Input). Incubate at 65°C overnight.
Day 4: DNA Recovery
- Digestion: Add RNase A (final 0.2 µg/µL). Incubate 30 min at 37°C.
- Protein Digestion: Add Proteinase K (final 0.2 µg/µL). Incubate 2 hours at 55°C.
- DNA Purification: Purify DNA using phenol-chloroform extraction or silica membrane-based kits (e.g., QIAquick PCR Purification Kit). Elute in 30 µL EB buffer (10 mM Tris-Cl, pH 8.5).
- QC & Sequencing: Quantify DNA by qPCR (at positive and negative control genomic loci) and fluorometry (e.g., Qubit). Use 1-10 ng for library preparation (e.g., NEBNext Ultra II DNA Library Prep Kit) and high-throughput sequencing (minimum 20 million reads per sample for TFs).
Visualizations
ChIP-seq Core Workflow Diagram
Regulatory Elements Control Gene Expression
The Scientist's Toolkit: Essential Research Reagent Solutions
Table 2: Key Reagents for Successful ChIP-seq
| Reagent/Material | Supplier Examples | Critical Function |
|---|---|---|
| Validated ChIP-seq Grade Antibody | Cell Signaling Tech (CST), Abcam, Diagenode | Target-specific immunoprecipitation; the single most critical factor for success. |
| Protein A/G Magnetic Beads | Thermo Fisher, MilliporeSigma | Efficient capture of antibody-bound chromatin complexes; low non-specific binding. |
| Formaldehyde (37%), Molecular Biology Grade | Thermo Fisher, MilliporeSigma | Reversible crosslinking of proteins to DNA. |
| Covaris microTUBES & AFA Fiber | Covaris, part of Revvity | Consistent, reproducible acoustic shearing of chromatin. |
| ChIP-seq Library Prep Kit | Illumina, NEB, Roche | Preparation of sequencing libraries from low-input, fragmented DNA. |
| Protease Inhibitor Cocktail (PIC) | Roche, MilliporeSigma | Preserves protein integrity and epitopes during lysis. |
| RNase A & Proteinase K | Qiagen, Thermo Fisher | Removal of RNA and proteins during final DNA purification. |
| DNA Clean/Concentration Kit | Zymo Research, Qiagen | Purification of low-abundance ChIP DNA. |
| qPCR Assays (Positive/Negative Control Loci) | IDT, Thermo Fisher | Essential quantitative QC prior to sequencing. |
In the context of a broader thesis utilizing Chromatin Immunoprecipitation followed by sequencing (ChIP-seq) to map genome-wide protein-DNA interactions, the pre-experimental planning phase is arguably the most critical determinant of success. This application note details the essential decisions regarding antibody selection, experimental and biological controls, and overall experimental design that must be addressed prior to any wet-lab work. Robust decisions at this stage prevent the costly generation of uninterpretable or irreproducible data.
Antibody Selection and Validation
The specificity of the antibody for the target epitope is the cornerstone of any ChIP-seq experiment. A non-specific antibody will generate noise and false-positive peaks.
Key Selection Criteria
The following table summarizes quantitative metrics and qualitative factors to evaluate when selecting an antibody for ChIP-seq.
Table 1: Criteria for ChIP-seq-Grade Antibody Selection
| Criterion | Optimal Specification / Target | Validation Method |
|---|---|---|
| Application Citation | Explicitly listed for "ChIP-seq" or "ChIP" in datasheet. | Review published literature using the antibody for ChIP. |
| Species Reactivity | Matches the model organism of your study (e.g., human, mouse). | Check datasheet and independent validation portals. |
| Clonality | Monoclonal (higher specificity) or well-validated polyclonal. | Datasheet should state clone number (e.g., "Clone D4E5D"). |
| Host Species | Different from target organism to avoid interference in IP. | Typically rabbit anti-mouse target, mouse anti-human target. |
| Immunogen | Epitope should be accessible in cross-linked chromatin. | Prefer antibodies raised against a large fragment of the protein. |
| Specificity Validation | Knockout/Knockdown control showing signal loss. | Western blot or ChIP-qPCR in control vs. KO cell lines. |
| Lot-to-Lot Consistency | High. Manufacturer should provide QC data per lot. | Request lot-specific validation data from supplier. |
| Titer/Amount Required | 1-5 µg per IP is typical; higher need may indicate low affinity. | Consult published protocols using the same antibody. |
Protocol: Antibody Validation via Knockout Cell Line
- Objective: To confirm antibody specificity by demonstrating loss of ChIP signal in cells lacking the target protein.
- Materials: Wild-type (WT) and target protein knockout (KO) isogenic cell lines, ChIP-validated antibody, IgG control antibody, PCR reagents, primers for a known strong binding site (positive control locus) and a non-binding site (negative control locus).
- Method:
- Culture WT and KO cells under identical conditions.
- Perform parallel ChIP experiments on both cell lines using the same protocol (cross-linking, sonication, immunoprecipitation) with the test antibody and an IgG control.
- Elute and purify DNA from all IP samples.
- Analyze enrichment by quantitative PCR (ChIP-qPCR) at the positive and negative control genomic loci.
- Expected Result: The test antibody should show significant enrichment at the positive locus in WT cells, but this enrichment should be abolished in the KO cells. Signal at the negative locus and from the IgG control should be low in both cell lines.
Experimental and Biological Controls
Incorporating the correct controls is non-negotiable for data interpretation. They account for technical noise and biological variability.
Table 2: Essential Controls for a ChIP-seq Experiment
| Control Type | Purpose | Ideal Outcome |
|---|---|---|
| Immunoglobulin G (IgG) | Accounts for non-specific antibody binding and background noise from Protein A/G beads. | Genome-wide read profile should be flat. Used to normalize specific antibody signal (e.g., in peak calling). |
| Input DNA | Represents the whole population of sheared chromatin prior to IP. Controls for chromatin accessibility, sonication efficiency, and sequencing bias. | Serves as the background control for peak calling algorithms. |
| Positive Control Locus (by qPCR) | Confirms the IP worked successfully. A known strong binding site for the target protein. | Significant enrichment (e.g., 10-100 fold over IgG) in ChIP-qPCR before sequencing. |
| Negative Control Locus (by qPCR) | Confirms antibody specificity. A genomic region devoid of the target protein's binding. | No enrichment over IgG or Input. |
| Biological Replicates | Accounts for natural biological variability. Distinguishes reproducible binding from stochastic noise. | Minimum of 2, but 3 is standard for robust statistical analysis and publication. |
| Antibody Competition | Further validates specificity. IP is performed with antibody pre-incubated with its immunogen peptide. | Significant reduction or abolition of signal at positive control loci. |
Experimental Design Considerations
A well-designed experiment addresses variables from sample preparation through data analysis.
Protocol: Standard Cross-Linking ChIP-seq Workflow
- Cell Fixation: Treat cells with 1% formaldehyde for 8-10 minutes at room temperature to cross-link proteins to DNA. Quench with glycine.
- Cell Lysis & Chromatin Shearing: Lyse cells. Shear cross-linked chromatin to fragments of 200-500 bp using optimized sonication (e.g., Covaris sonicator). Check fragment size by agarose gel electrophoresis.
- Immunoprecipitation: Incubate sheared chromatin with pre-blocked Protein A/G magnetic beads bound to the target-specific antibody. Include an IgG bead aliquot for the control. Wash beads stringently to remove non-specific binding.
- Cross-link Reversal & Purification: Reverse cross-links at 65°C with high salt. Treat with RNase A and Proteinase K. Purify immunoprecipitated DNA using a column-based method.
- Library Preparation & Sequencing: Prepare sequencing libraries from ChIP and Input DNA using a compatible kit (e.g., NEBNext Ultra II). Perform quality control (Bioanalyzer) and sequence on an appropriate platform (Illumina NovaSeq) to a minimum depth of 20 million non-duplicate reads for transcription factors, or 40-50 million for broad histone marks.
Visualizations
Title: ChIP-seq Pre-Experimental Decision Workflow
Title: The Role of IgG Control in ChIP Specificity
The Scientist's Toolkit: Key Research Reagent Solutions
Table 3: Essential Materials for Robust ChIP-seq Experiments
| Item | Function & Importance | Example Product/Type |
|---|---|---|
| ChIP-Validated Antibody | Specifically immunoprecipitates the target protein-DNA complex. The primary determinant of data quality. | Cell Signaling Technology (CST) "PATHWAY" antibodies, Abcam "ChIP-seq Grade" antibodies. |
| Protein A/G Magnetic Beads | Efficiently capture antibody-antigen complexes, enabling easy washing and buffer changes. | Invitrogen Dynabeads, Millipore Sepharose beads. |
| Covaris Sonicator | Provides consistent, tunable acoustic shearing for precise chromatin fragmentation with low heat generation. | Covaris M220 or E220. |
| Cross-linking Reagent | Forms covalent bonds between the target protein and bound DNA, freezing interactions. | Ultrapure Formaldehyde (1% final conc.). |
| ChIP-seq Library Prep Kit | Converts low-input, sheared ChIP DNA into sequencing-ready libraries with high efficiency. | NEBNext Ultra II DNA Library Prep, Takara Bio ThruPLEX. |
| SPRI Beads | For post-library prep size selection and clean-up, removing adapter dimers and large fragments. | Beckman Coulter AMPure XP. |
| Validated qPCR Primers | For positive/negative control loci to validate IP efficiency and specificity before sequencing. | Primers for active promoter (e.g., GAPDH) and gene desert region. |
| Cell Line or Tissue | Biologically relevant source material. Isogenic KO/WT pairs are gold standard for validation. | Cultured cells (e.g., HEK293, K562) or frozen tissue samples. |
This application note details the computational workflow for analyzing Chromatin Immunoprecipitation followed by sequencing (ChIP-seq) data, framed within a broader thesis on establishing a robust ChIP-seq protocol for identifying genome-wide transcription factor binding sites or histone modification landscapes. This pipeline is critical for researchers, scientists, and drug development professionals investigating gene regulation, epigenetic mechanisms, and therapeutic target discovery.
Core Experimental Protocol: ChIP-seq
Materials: Crosslinked cells, specific antibody for target protein, Protein A/G magnetic beads, sonicator, library preparation kit, high-throughput sequencer.
Detailed Methodology:
- Crosslinking: Treat cells with 1% formaldehyde for 10 minutes at room temperature to fix protein-DNA interactions. Quench with 125mM glycine.
- Cell Lysis & Chromatin Shearing: Lyse cells in appropriate buffers. Sonicate chromatin to fragment DNA to an average size of 200-500 bp. Confirm fragment size by agarose gel electrophoresis.
- Immunoprecipitation: Incubate sheared chromatin with target-specific antibody overnight at 4°C. Add magnetic beads for 2 hours to capture antibody-protein-DNA complexes. Wash beads with low-salt, high-salt, LiCl, and TE buffers.
- Reverse Crosslinking & Purification: Elute complexes and reverse crosslinks by incubating at 65°C overnight with 200mM NaCl. Treat with RNase A and Proteinase K. Purify DNA using silica membrane columns.
- Library Preparation & Sequencing: Use a commercial library prep kit to add sequencing adapters. Amplify via 10-14 cycles of PCR. Validate library quality (Bioanalyzer) and quantify (qPCR). Sequence on an Illumina platform to achieve 20-40 million reads per sample.
Computational Workflow & Key Data
The analysis pipeline transforms raw sequencing data into biologically interpretable annotations.
Table 1: Key Quantitative Metrics at Each Analysis Stage
| Stage | Metric | Typical Target/Value | Purpose |
|---|---|---|---|
| Raw Data | Total Reads | 20-40 million | Sequencing depth. |
| Alignment | Alignment Rate | >70-80% (for common species) | Data quality & contaminant check. |
| Filtering | PCR Duplicates | <20-30% of aligned reads | Remove technical artifacts. |
| Peak Calling | Number of Peaks | Varies by target (e.g., TF: 10k-50k) | Identify binding sites. |
| Peak Quality | FRiP Score | >1% (TF), >10-30% (histones) | Signal-to-noise ratio. |
Table 2: Common Peak Callers & Key Features
| Software | Primary Use Case | Key Statistical Model | Input Control Recommended |
|---|---|---|---|
| MACS2 | Transcription Factors, Broad/Narrow Peaks | Poisson distribution | Highly Recommended |
| Genrich | Robust, minimal preprocessing | AUC-based, no filtering needed | Optional |
| SEACR | Sparse data, CUT&RUN/TAG | Relative enrichment thresholding | Required (for stringent call) |
| HOMER | De novo motif discovery & analysis | Binomial/Peak Localization | Recommended |
Visualization of the ChIP-seq Analysis Workflow
Diagram Title: ChIP-seq Data Analysis Computational Pipeline
The Scientist's Toolkit: Research Reagent Solutions
Table 3: Essential Materials for ChIP-seq Experimentation
| Item | Function | Example/Notes |
|---|---|---|
| High-Quality Antibody | Specific immunoprecipitation of target protein or histone mark. | Validate for ChIP-grade specificity. Key success factor. |
| Magnetic Beads (Protein A/G) | Efficient capture of antibody-antigen complexes. | Reduce background vs. agarose beads. |
| Covaris/Sonicator | Consistent chromatin shearing to optimal fragment size. | Covaris for reproducibility. |
| DNA Clean/Concentrator Kit | Purification of low-concentration ChIP DNA after elution. | Zymo Research or Qiagen kits. |
| Library Prep Kit for Illumina | Preparation of sequencing-ready libraries from ChIP DNA. | KAPA HyperPrep, NEBNext Ultra II. |
| Size Selection Beads | Library fragment size selection (e.g., 200-500 bp). | SPRIselect/AMPure XP beads. |
| Qubit dsDNA HS Assay | Accurate quantification of low-yield ChIP and library DNA. | Fluorometric, specific for dsDNA. |
| Bioanalyzer/TapeStation | Assess fragment size distribution of sheared chromatin & final library. | Essential QC before sequencing. |
Step-by-Step ChIP-seq Protocol: Cell Fixation to Sequencing Library
Within the broader thesis investigating chromatin immunoprecipitation followed by sequencing (ChIP-seq) for genome-wide protein-DNA binding site mapping, the initial crosslinking step is critical. This stage determines the efficiency and accuracy of capturing transient or stable protein-DNA interactions. Traditional single-agent formaldehyde (FA) crosslinking is compared against dual crosslinker strategies, typically combining FA with a longer-arm crosslinker like ethylene glycol bis(succinimidyl succinate) (EGS) or disuccinimidyl glutarate (DSG). This application note details the optimization protocol and comparative analysis.
Table 1: Comparison of Crosslinking Agent Properties
| Property | Formaldehyde (FA) | EGS | DSG | FA + EGS (Dual) |
|---|---|---|---|---|
| Crosslink Type | Protein-DNA, Protein-Protein | Protein-Protein | Protein-Protein | Combined |
| Spacer Arm Length | ~2 Å | ~16.1 Å | ~7.7 Å | Mixed |
| Primary Target | Amines | Amines | Amines | Amines |
| Reversibility | Reversible (heat) | Reversible (pH) | Reversible (pH) | Sequential reversal |
| Typical Conc. for ChIP | 1% | 1-3 mM | 1-3 mM | 1% + 1-3 mM |
| Optimal Fixation Time | 8-12 min | 30-45 min | 30-45 min | 10 min FA + 30 min EGS/DSG |
Table 2: Performance Metrics in ChIP-seq for Transcription Factor (TF) vs. Chromatin Regulator
| Crosslinking Method | TF ChIP-seq Efficiency (Yield) | TF Background Signal | Chromatin Regulator Efficiency | DNA Fragment Size Post-Sonication | Protocol Complexity |
|---|---|---|---|---|---|
| Formaldehyde (1%, 10 min) | High | Moderate | Moderate | 200-500 bp | Low |
| FA + EGS Dual | Very High | Low | High | 300-700 bp | Moderate |
| FA + DSG Dual | High | Low | High | 250-600 bp | Moderate |
Detailed Experimental Protocols
Protocol A: Standard Formaldehyde Crosslinking for Adherent Cells
Materials: Phosphate-Buffered Saline (PBS), 37% Formaldehyde solution, 2.5M Glycine, cell scraper. Procedure:
- Grow adherent cells to 70-80% confluency in a 150 mm dish.
- Add 1/10 volume of fresh 11% formaldehyde solution (1% final concentration) directly to the culture medium.
- Incubate for 10 minutes at room temperature (RT) on a rocking platform.
- Quench the reaction by adding 1/20 volume of 2.5M glycine (125 mM final). Rock for 5 min at RT.
- Aspirate medium. Wash cells twice with ice-cold PBS.
- Scrape cells in PBS with protease inhibitors. Pellet at 800 x g for 5 min at 4°C. Flash-freeze pellet or proceed to lysis.
Protocol B: Dual Crosslinking with Formaldehyde and EGS
Materials: PBS, 37% Formaldehyde, 2.5M Glycine, EGS (dissolved in DMSO), 1M Tris-HCl pH 7.5. Procedure:
- Prepare a 25mM EGS stock solution in DMSO immediately before use.
- For adherent cells, aspirate medium and wash once with PBS. Add PBS containing 1.5-3mM EGS (final concentration).
- Incubate for 30-45 minutes at RT with gentle rocking.
- Without quenching, add formaldehyde to the EGS/PBS solution to a final concentration of 1%. Rock for an additional 10 minutes at RT.
- Quench with 125 mM glycine (final) for 5 min.
- Wash, scrape, and pellet cells as in Protocol A.
- Critical Reversal Step: After cell lysis and nuclear isolation, resuspend the pellet in 1X RIPA buffer and incubate at 65°C for 15-20 minutes. This reverses the formaldehyde crosslinks while leaving the EGS protein-protein crosslinks intact.
Visualization of Workflows
Diagram Title: Comparison of FA and dual crosslinking ChIP-seq workflows.
Diagram Title: Dual crosslinker mechanism stabilizing TF complexes.
The Scientist's Toolkit: Key Research Reagent Solutions
Table 3: Essential Materials for Crosslinking Optimization
| Reagent/Material | Function in Protocol | Key Consideration |
|---|---|---|
| 37% Formaldehyde (Methanol-free) | Primary crosslinker for protein-DNA & proximal protein-protein bonds. | Methanol-free is critical for consistency; aliquot to avoid oxidation. |
| EGS (Ethylene glycol bis(succinimidyl succinate)) | Homobifunctional NHS-ester crosslinker for protein-protein bonds with long spacer arm. | Must be fresh or aliquoted in anhydrous DMSO; hygroscopic. |
| DSG (Disuccinimidyl glutarate) | Homobifunctional NHS-ester crosslinker; shorter arm than EGS. | Alternative to EGS; may be more efficient for some targets. |
| 2.5M Glycine (Sterile) | Quenches unreacted formaldehyde by amine competition. | Must be sterile for cell culture work. |
| Protease Inhibitor Cocktail (PIC) | Prevents proteolytic degradation of crosslinked complexes during harvest. | Add fresh to all buffers post-quenching. |
| Dimethyl Sulfoxide (DMSO), Anhydrous | Solvent for preparing EGS/DSG stock solutions. | High-quality, anhydrous DMSO ensures crosslinker stability. |
| 1M Tris-HCl pH 7.5 | Provides buffer capacity during EGS crosslinking step in PBS. | Neutral pH optimal for NHS-ester reactivity. |
| RIPA Lysis Buffer | Lyses cells and nuclei while maintaining crosslink integrity. | Must include PIC and often PMSF. |
Within the ChIP-seq protocol for genome-wide binding site research, chromatin shearing is a critical step that determines the resolution and specificity of the final data. Optimal fragmentation into 150-500 bp fragments is essential for efficient immunoprecipitation and high-quality sequencing library preparation. This application note details current best practices for sonication-based shearing and subsequent size selection.
Key Principles of Chromatin Shearing
Effective shearing must balance DNA fragment size with the preservation of protein-DNA interactions. Under-shearing leads to poor resolution and non-specific signals, while over-shearing can disrupt epitopes, reducing ChIP efficiency. Sonication uses high-frequency sound waves to create cavitation bubbles in the sample, whose collapse generates shear forces.
Sonication Parameters: Optimization & Comparison
The optimal parameters vary significantly by sonicator model, cell type, and fixation conditions. The following table summarizes standard parameters for two common device types.
Table 1: Comparative Sonication Parameters for Common Devices
| Parameter | Diagenode Bioruptor (Water Bath) | Covaris S220/S2 (Focused Acoustics) |
|---|---|---|
| Sample Volume | 130 µL - 1.5 mL in microtubes | 50 µL - 1 mL in milliTUBEs |
| Cycle Definition | "30 sec ON, 30 sec OFF" cycles | Continuous treatment |
| Total Duration | 15-30 cycles (15-30 min total) | 2-15 minutes |
| Peak Power | Fixed (High or Low setting) | Adjustable (50-200 W) |
| Duty Cycle | Fixed at 50% (by cycle design) | Adjustable (5-20%) |
| Cycles per Burst | N/A | 200-1000 |
| Temperature Control | Chilled water bath (4°C) | Active cooling (4-6°C) |
| Typical Output | 200-700 bp range | Tighter distribution (e.g., 150-300 bp) |
| Key Advantage | Simplicity, multiple samples | Reproducibility, tunability |
Detailed Protocol: Chromatin Shearing via Sonication
Materials & Reagents
- Cross-linked cell pellet (1-10 x 10^6 cells).
- Lysis Buffer I: 50 mM HEPES-KOH (pH 7.5), 140 mM NaCl, 1 mM EDTA, 10% Glycerol, 0.5% NP-40, 0.25% Triton X-100, protease inhibitors.
- Lysis Buffer II: 10 mM Tris-HCl (pH 8.0), 200 mM NaCl, 1 mM EDTA, 0.5 mM EGTA, protease inhibitors.
- Shearing Buffer: 10 mM Tris-HCl (pH 8.0), 100 mM NaCl, 1 mM EDTA, 0.5 mM EGTA, 0.1% SDS, 0.1% Na-Deoxycholate, protease inhibitors.
- PBS.
- Refrigerated microcentrifuge.
- Sonicator (e.g., Diagenode Bioruptor, Covaris S220) with cooling system.
- Magnetic rack for SPRI bead cleanup.
Procedure
A. Cell Lysis and Nuclei Preparation
- Resuspend the fixed cell pellet in 1 mL of cold Lysis Buffer I. Incubate for 10 minutes at 4°C with gentle rotation.
- Centrifuge at 1350 x g for 5 minutes at 4°C. Discard supernatant.
- Resuspend pellet in 1 mL of cold Lysis Buffer II. Incubate for 10 minutes at 4°C with gentle rotation.
- Centrifuge at 1350 x g for 5 minutes at 4°C. Discard supernatant.
- Resuspend pellet in Shearing Buffer to a final volume appropriate for your sonicator (e.g., 130 µL for a 0.65 mL tube for Bioruptor). Adjust volume based on cell count. Ensure the pellet is fully resuspended.
B. Sonication For Diagenode Bioruptor (Pico setting): a. Pre-cool the water bath to 4°C. b. Transfer sample to a 0.65 mL microfuge tube. Ensure no bubbles. c. Sonicate using the following optimization protocol: Run 6 cycles of "30 sec ON, 30 sec OFF". Remove 15 µL for analysis. Repeat, removing an aliquot every 3-5 cycles until 15-30 total cycles are completed. d. Keep samples on ice between runs.
For Covaris S220: a. Pre-cool the chamber to 4-6°C. b. Transfer sample to a focused-ultrasonication milliTUBE. c. Set parameters based on desired size. Example for ~250 bp fragments: Peak Incident Power: 140 W, Duty Factor: 10%, Cycles per Burst: 200, Treatment Time: 5 minutes. d. Perform sonication.
C. Post-Sonication Processing
- Centrifuge sonicated samples at 16,000 x g for 10 minutes at 4°C to pellet debris.
- Transfer the supernatant (sheared chromatin) to a new tube.
- Quantify DNA concentration using a fluorometric assay (e.g., Qubit dsDNA HS Assay).
- Analyze fragment size distribution by running 20-50 ng on a high-sensitivity Bioanalyzer or TapeStation chip.
Size Selection Protocols
Post-shearing size selection removes fragments too small (<100 bp) or too large (>600 bp) to improve mapping efficiency and resolution.
Table 2: Size Selection Methods Comparison
| Method | Principle | Target Range | Yield | Input Requirements |
|---|---|---|---|---|
| SPRI Bead Double Selection | Differential binding of DNA to magnetic beads in PEG/NaCl buffer. | 150-500 bp | Moderate to High | Flexible (0.1-1 µg) |
| Gel Electrophoresis & Extraction | Physical separation via agarose gel and column/electro-elution. | Very tight (e.g., 200-300 bp) | Low | High (>1 µg) |
| Size-Exclusion Columns | Chromatographic separation by size. | Broad range | High | High (>1 µg) |
Detailed Protocol: Two-Sided SPRI Bead Selection
This protocol uses a lower bead-to-sample ratio to bind and remove large fragments, followed by a higher ratio to recover the desired mid-size fragments.
Reagents: SPRI beads (e.g., AMPure XP, Sera-Mag), 80% ethanol, TE buffer. Procedure:
- Bring sheared chromatin volume to 100 µL with TE buffer in a low-bind tube.
- Remove Large Fragments: Add SPRI beads at a 0.5x ratio (50 µL). Mix thoroughly. Incubate 5 minutes at RT.
- Place on a magnetic rack for 5 minutes until clear. Transfer supernatant (contains small/mid fragments) to a new tube. Discard beads (with bound large fragments).
- Recover Mid-Size Fragments: To the supernatant, add SPRI beads at a 1.5x ratio (relative to the original 100 µL volume, add 150 µL). Mix thoroughly. Incubate 5 minutes at RT.
- Place on magnet for 5 minutes. Discard supernatant.
- With tube on magnet, wash beads twice with 200 µL of 80% ethanol. Air-dry beads for 5 minutes.
- Elute DNA in 30-50 µL TE buffer or nuclease-free water. Quantify and check size profile.
Quality Control
- Fragment Size Analysis: Bioanalyzer/TapeStation profile should show a smooth smear centered at the desired size (e.g., ~250 bp) with minimal small-molecular-weight RNA/DNA peaks.
- Concentration: Typical yield is 20-100 ng/µL from 1 million cells. Low yield may indicate poor shearing or loss during cleanup.
- Cross-link Reversal Test: Reverse cross-links on 50-100 ng of sheared chromatin (65°C overnight with 200 mM NaCl + Proteinase K) and run on agarose gel. Should appear as a broad smear without a distinct high-molecular-weight band, confirming efficient shearing.
The Scientist's Toolkit: Research Reagent Solutions
Table 3: Essential Materials for Chromatin Shearing & Size Selection
| Item | Function & Rationale |
|---|---|
| Diagenode Bioruptor Pico | Ultrasonic water bath sonicator for simultaneous processing of multiple samples with minimal heat transfer. |
| Covaris S220/S2 AFA System | Focused-ultrasonicator for highly reproducible, tunable shearing with active temperature control. |
| Covaris milliTUBE (130 µL) | AFA fiber & plastic tubes optimized for focused acoustics, minimizing sample loss and absorption. |
| AMPure XP / SPRIselect Beads | Magnetic beads for solid-phase reversible immobilization (SPRI) based size selection and cleanup. |
| Agilent High Sensitivity DNA Kit | For precise fragment size distribution analysis on the Bioanalyzer 2100 system. |
| Qubit dsDNA HS Assay Kit | Fluorometric quantification specific for double-stranded DNA, unaffected by RNA or contaminants. |
| Protease Inhibitor Cocktail (PIC) | Added to all buffers to prevent degradation of transcription factors and histone modifications. |
| Nuclease-Free Low-Bind Microtubes | Minimizes adsorption of low-input chromatin samples to tube walls. |
| Dynabeads Protein A/G | Magnetic beads for subsequent chromatin immunoprecipitation, compatible with many antibody hosts. |
Visual Workflow & Decision Pathways
Title: Chromatin Shearing and QC Optimization Workflow
Title: Decision Logic for Post-Sonication Size Selection
Application Notes Within the broader ChIP-seq thesis for mapping transcription factor occupancy, the immunoprecipitation (IP) stage is critical for determining the final signal-to-noise ratio. Optimizing bead type and buffer composition directly impacts specificity by maximizing target antigen-antibody-bead recovery while minimizing non-specific background DNA capture. This protocol details systematic optimization for high-resolution, genome-wide binding site data.
Experimental Protocols
Protocol 1: Bead Type Comparison for Target Antigen Recovery Objective: To compare magnetic bead substrates for optimal antibody coupling and antigen pull-down efficiency. Method:
- Antibody Coupling: For each bead type (see Table 1), aliquot 50 µL of bead slurry. Wash twice in 1 mL PBS/0.1% BSA. Resuspend in 100 µL PBS/0.1% BSA with 5 µg of the validated ChIP-grade antibody against the target transcription factor. Incubate with rotation for 12 hours at 4°C.
- Blocking: Wash beads twice with PBS/0.1% BSA. Incubate in 1 mL PBS/1% BSA for 1 hour at 4°C with rotation to block non-specific sites.
- Chromatin Incubation: Incubate antibody-coupled beads with 100 µL of sheared, cross-linked chromatin (containing ~25 µg DNA) from the cell line of interest in 1 mL of RIPA-150 buffer (150 mM NaCl) for 4 hours at 4°C with rotation.
- Wash & Elution: Perform five washes: three with RIPA-150, one with RIPA-500 (500 mM NaCl), and one with LiCl wash buffer. Elute DNA in 200 µL of freshly prepared elution buffer (1% SDS, 100 mM NaHCO3) with agitation at 65°C for 15 minutes. Reverse cross-links and purify DNA using a PCR purification kit.
- Quantification: Quantify recovered DNA by qPCR using primers for a known positive binding site and a non-binding negative control region. Calculate % input recovery.
Protocol 2: IP Buffer Ionic Strength Optimization Objective: To determine the optimal NaCl concentration in wash buffers for minimizing non-specific DNA carryover. Method:
- Standardized IP: Using the optimal bead type from Protocol 1, perform IP as described in Steps 1-3 of Protocol 1, using RIPA-150 for incubation.
- Differential Washes: After chromatin incubation, split the bead slurry into four equal aliquots. Wash each aliquot with a series of five buffers where the primary wash buffer (used for three of the five washes) varies in NaCl concentration: 150 mM, 300 mM, 500 mM, or 750 mM. Complete all washes with the standard LiCl wash and TE buffer.
- Analysis: Elute and purify DNA as in Protocol 1. Quantify DNA via qPCR at positive and negative genomic sites. Calculate the signal-to-noise ratio (Positive Control qPCR Cq / Negative Control qPCR Cq). Analyze DNA fragment size distribution via Bioanalyzer.
Data Presentation
Table 1: Bead Type Performance Metrics
| Bead Type (Core Chemistry) | Surface Coating | Avg. % Input Recovery (Positive Locus) | Signal-to-Noise Ratio (qPCR) | Non-Specific DNA Carryover (ng) |
|---|---|---|---|---|
| Protein A | Native Protein | 2.1% | 12.5 | 8.5 |
| Protein G | Native Protein | 2.4% | 14.2 | 7.1 |
| Protein A/G | Recombinant | 2.6% | 15.8 | 6.3 |
| Sheep Anti-Mouse IgG | Cross-linked | 1.8% | 18.5 | 4.9 |
Table 2: Effect of Wash Buffer Stringency on IP Specificity
| Primary Wash [NaCl] | Recovery at Positive Locus (% Input) | Signal-to-Noise Ratio (qPCR) | Average DNA Fragment Size (bp) |
|---|---|---|---|
| 150 mM | 2.6% | 8.1 | 310 |
| 300 mM | 2.4% | 15.8 | 295 |
| 500 mM | 1.9% | 22.3 | 280 |
| 750 mM | 0.7% | 25.1 | 270 |
The Scientist's Toolkit
Table 3: Research Reagent Solutions
| Item | Function in Optimization |
|---|---|
| Magnetic Beads (Protein A/G) | Provide a solid phase for antibody immobilization and magnetic separation. Recombinant A/G binds broadest range of IgG subtypes. |
| ChIP-Grade Primary Antibody | Specifically recognizes and binds the target protein-DNA complex. Must be validated for immunoprecipitation. |
| RIPA Buffer Variants (150-750 mM NaCl) | Lysis and wash buffer. Varying salt concentration disrupts weak, non-specific protein-DNA interactions to reduce background. |
| LiCl Wash Buffer | Removes non-specific protein aggregates and residual detergent from beads. |
| Proteinase K | Digests proteins post-elution to release cross-linked DNA for purification. |
| qPCR Assays for Positive/Negative Genomic Loci | Provide quantitative metrics for enrichment and specificity during optimization. |
Diagrams
Title: IP Optimization Workflow for ChIP-seq
Title: Buffer Stringency Mechanism
Within the broader thesis on ChIP-seq protocol for genome-wide binding sites research, the library preparation stage is the critical bridge between immunoprecipitated chromatin and sequencer-compatible DNA libraries. For low-input and single-cell ChIP-seq (scChIP-seq), this step demands specialized strategies to overcome the severe limitations of starting material, minimize bias, and preserve the biological signal from minute quantities of chromatin. This application note details current best practices and protocols for this high-stakes phase.
Core Challenges & Strategic Approaches
The primary challenges in low-input/scChIP-seq library prep include DNA loss during cleanup, amplification bias, and loss of complexity. Modern strategies to address these are summarized below.
Table 1: Comparison of Key Low-Input/SC Library Preparation Methods
| Method | Principle | Optimal Input | Key Advantage | Primary Limitation |
|---|---|---|---|---|
| Linear Amplification (e.g., LiA) | T7 in vitro transcription followed by reverse transcription | 10-1000 cells | Reduces amplification bias, high complexity | Multi-step, longer protocol |
| Tagmentation-based (e.g., scChIP-seq) | Simultaneous fragmentation and adapter tagging by Tn5 transposase | Single cell to 1000 cells | Fast, minimal handling, integrated fragmentation | Sequence bias of Tn5, GC bias |
| Ligation-based with Post-Bisulfite Adapter Tagging (PBAT) | Adapter ligation after bisulfite treatment (for ChIP-BS) | Ultra-low input | Efficient for DNA methylation analysis post-ChIP | Harsh bisulfite treatment degrades DNA |
| Methylase-based (e.g., scChIP-seq with mCI) | Intragenomic DNA methylation barcoding | Single cell | Enables sample multiplexing | Requires specific methylation compatibility |
| Microfluidic Platforms (e.g., Drop-ChIP) | Nanodroplet-based compartmentalization | Single cell | High-throughput, automated | Specialized equipment required |
Detailed Protocols
Tn5 Tagmentation-Based scChIP-seq Protocol (Adapted from Rotem et al., 2015)
This protocol is widely adopted for its simplicity and efficiency in handling single cells.
A. Materials & Input: Immunoprecipitated DNA from a single cell or ~100 cells in a maximum volume of 5 µL (in EB or TE buffer).
B. Procedure:
- Tagmentation Reaction: Combine the 5 µL ChIP DNA with 10 µL of TD Buffer (Illumina) and 5 µL of engineered Tn5 transposase loaded with sequencing adapters (e.g., Nextera). Mix gently.
- Incubate: Run the reaction at 55°C for 10 minutes in a thermocycler.
- Neutralization: Immediately add 5 µL of 0.2% SDS and mix thoroughly. Incubate at room temperature for 5 minutes to stop the tagmentation.
- Direct PCR Amplification: Add 25 µL of PCR master mix containing a universal primer and a sample-indexing primer (e.g., i5 and i7 indexes). Use a high-fidelity, low-bias polymerase (e.g., KAPA HiFi HotStart ReadyMix).
- PCR Cycling: Use minimal cycles.
- 72°C for 3 min (gap filling)
- 98°C for 30 sec
- 12-16 cycles of: 98°C for 10 sec, 63°C for 30 sec, 72°C for 30 sec
- 72°C for 5 min, hold at 4°C.
- Cleanup: Purify the amplified library using 1.8x SPRIselect beads. Elute in 20 µL of EB buffer.
- QC: Analyze library size distribution (e.g., Bioanalyzer High Sensitivity DNA chip; expected peak ~200-500 bp) and quantify via qPCR.
Linear Amplification (LiA) Protocol for Ultra-Low Input
This method is preferred when minimizing amplification bias is paramount.
A. Materials & Input: Purified ChIP DNA from 10-1000 cells.
B. Procedure:
- Poly(A) Tailing: To the ChIP DNA in 8.5 µL, add 1 µL of 10x Tailing Buffer, 0.5 µL of 10 mM dATP, and 1 µL of Terminal Transferase (TdT). Incubate at 37°C for 30 min, then inactivate at 70°C for 10 min.
- First-Strand Synthesis: Add 1 µL of a primer containing a poly(T) sequence and the T7 promoter (e.g., 5'-TTT TTT TTT TTT TTT TTT TTT TTA ATT TAA TAC GAC TCA CTA TAG GG-3'). Anneal by heating to 70°C and cooling slowly to 4°C. Add reverse transcription mix and synthesize cDNA.
- Second-Strand Synthesis: Use RNase H and DNA Polymerase I to generate double-stranded DNA with a functional T7 promoter.
- In Vitro Transcription (IVT): Use T7 RNA Polymerase to amplify the template linearly, generating hundreds of RNA copies. Incubate at 37°C for 12-16 hours.
- Reverse Transcription: Random primed RT converts amplified RNA back into single-stranded DNA.
- Final Library PCR: Perform 8-12 cycles of PCR with indexed primers to generate the sequencing library.
- Purification & QC: SPRI bead cleanups after RT and final PCR. Assess yield and size.
Visualization of Workflows
Diagram 1: Single-Cell ChIP-seq Tagmentation Workflow
Diagram 2: Linear Amplification Workflow for Ultra-Low Input
The Scientist's Toolkit: Key Research Reagent Solutions
Table 2: Essential Materials for Low-Input/scChIP-seq Library Prep
| Item | Function & Critical Feature | Example Product(s) |
|---|---|---|
| High-Activity Tn5 Transposase | For efficient tagmentation/fragmentation of low-DNA inputs. Pre-loaded with adapters saves steps. | Illumina Nextera, DIY loaded Tn5, Vazyme TruePrep |
| Low-Bias, High-Fidelity PCR Mix | Critical for limited-cycle amplification to minimize duplicates and GC bias. | KAPA HiFi HotStart, Takara ThruPLEX, NEB Next Ultra II |
| SPRIselect Beads | For size selection and clean-up with minimal DNA loss; crucial for retaining low-concentration libraries. | Beckman Coulter SPRIselect, Sera-Mag SpeedBeads |
| DNA High Sensitivity Assay | Accurate quantification and sizing of picogram-level libraries before sequencing. | Agilent Bioanalyzer HS DNA, Fragment Analyzer, TapeStation |
| Single-Cell/Ultra-Low Input Kit | Integrated, optimized systems to maximize efficiency. | Takara Bio ICELL8 scChIP-seq, Diagenode METHYL- kit for low input |
| Unique Dual Indexes (UDIs) | To demultiplex samples and remove index hopping artifacts in multiplexed runs. | Illumina UD Indexes, IDT for Illumina UDIs |
| Microcentrifuge Tubes with Low Retention | Minimizes sample adhesion to tube walls during critical purification steps. | LoBind Tubes (Eppendorf), PCR tubes with polymer coating |
Sequencing Depth and Platform Recommendations (Illumina, NovaSeq)
This application note provides guidance on sequencing depth and platform selection for Chromatin Immunoprecipitation Sequencing (ChIP-seq), a core methodology for genome-wide profiling of transcription factor binding sites and histone modifications. Within the broader thesis on optimizing ChIP-seq protocols for drug target discovery, appropriate sequencing depth and platform choice are critical for generating statistically robust, reproducible, and cost-effective data. This document synthesizes current recommendations for researchers and drug development professionals.
Recommended Sequencing Depth by Target Type
The required sequencing depth is dictated by the biological target's genomic footprint size and abundance.
Table 1: Recommended ChIP-seq Sequencing Depth Guidelines
| Target Type | Recommended Depth (Mapped Reads) | Justification & Key Considerations |
|---|---|---|
| Transcription Factors (TFs) | 20 - 50 million | TFs bind at specific, localized sites. Higher depth (>30M) is needed for lower-abundance factors or for detecting weak binding events. |
| Histone Modifications (Broad marks, e.g., H3K27me3) | 40 - 60 million | Broad domains require more reads for accurate peak shape and boundary definition. Increased depth improves signal-to-noise. |
| Histone Modifications (Sharp marks, e.g., H3K4me3) | 20 - 40 million | Localized peaks similar to TFs. Lower end sufficient for promoter-associated marks. |
| Input/Control DNA | Equivalent to or exceeding IP sample depth | Crucial for accurate peak calling. Sequencing deeper than the IP sample can improve background model fidelity. |
| Pilot Experiments | 10 - 15 million | For cost-effective assay optimization and antibody validation before full-scale sequencing. |
Illumina Platform Comparison and Recommendations
Table 2: Illumina Platform Comparison for ChIP-seq Applications
| Platform | Output Range (Pb) | Read Lengths | Optimal ChIP-seq Use Case | Throughput & Cost Consideration |
|---|---|---|---|---|
| NovaSeq X Series | 10 - 160 | 2x150 bp | Ultra-high-throughput population studies, large-scale drug screening campaigns, consortium projects. | Highest throughput, lowest cost per Gb. Requires extensive multiplexing; best for batched, large projects. |
| NovaSeq 6000 | 0.8 - 120 | 2x50, 2x100, 2x150 bp | Large cohort studies, multi-omics integration projects requiring vast data. | Very high throughput. S4 flow cells ideal for batched runs of hundreds of samples. |
| NextSeq 1000/2000 | 0.12 - 120 | 1x50-300, 2x150 bp | Mid-scale projects, targeted validation studies, or lower-plex runs needing faster turnaround. | Flexible P1-P3 flow cells. Good balance of speed and capacity for core facilities. |
| MiSeq | 0.3 - 15 Gb | Up to 2x300 bp | Small-scale pilot studies, protocol optimization, library QC (size distribution, cluster density). | Low throughput, fast turnaround. Not cost-effective for full-scale experiments. |
Platform Selection Protocol:
- Define Experimental Scale: Determine total number of samples (IPs + controls) and required depth per sample (Table 1).
- Calculate Total Data Needed: Total Reads = (Number of Samples) x (Recommended Depth per Sample).
- Choose Platform & Flow Cell:
- NovaSeq (X/6000): Select if total reads > 2 billion. Choose S4/X Plus flow cell for >120 samples, S2 for 30-120 samples.
- NextSeq 2000: Select for 0.5 - 2 billion total reads. P3 flow cell for 50-100 samples, P2 for 15-50.
- NextSeq 1000/NextSeq 550: Select for <0.5 billion total reads (P2/P1 flow cells).
- Design Multiplexing Strategy: Use dual-indexed adapters (e.g., IDT for Illumina UD Indexes) to pool libraries. Ensure unique index combinations to avoid cross-talk.
- Sequencing Parameters: Standard ChIP-seq uses 2x50 bp or 2x75 bp paired-end reads. Increase to 2x150 bp for complex genomes or if planning nucleosome positioning analysis.
Detailed ChIP-seq Library Preparation and Sequencing Protocol
Reagents and Equipment:
- Sonicator (e.g., Covaris M220)
- Magnetic rack for beads
- Thermocycler
- Qubit Fluorometer and dsDNA HS Assay Kit
- Bioanalyzer/TapeStation (Agilent)
- Library Preparation Kit (e.g., NEBNext Ultra II DNA Library Prep)
- SPRIselect beads (Beckman Coulter)
- Indexing primers
- PCR purification kit
Protocol:
A. Chromatin Immunoprecipitation & DNA Recovery (Pre-sequencing)
- Cross-link cells with 1% formaldehyde for 10 min, quench with glycine.
- Lyse cells and sonicate chromatin to 200-500 bp fragments (Covaris settings: 140W Peak Power, 5% Duty Factor, 200 cycles/burst for 45-60 min).
- Immunoprecipitate with target-specific antibody and Protein A/G magnetic beads overnight at 4°C.
- Wash beads, reverse crosslinks, and purify DNA with elution buffer and Proteinase K treatment.
- Quantify eluted DNA by Qubit.
B. Library Preparation for Illumina Sequencing
- End Repair & A-tailing: Use 1-10 ng of ChIP DNA. Perform end repair to generate blunt ends, followed by 3' adenylation (per kit instructions).
- Adapter Ligation: Ligate indexed, forked Illumina adapters to DNA fragments. Use a 5:1 to 15:1 adapter-to-insert molar ratio.
- Size Selection: Clean up ligation with SPRIselect beads. Perform double-sided size selection (e.g., 0.55x and 0.8x bead ratios) to isolate fragments ~250-400 bp.
- Library Amplification: Perform 8-15 cycles of PCR to enrich adapter-ligated fragments. Use a high-fidelity polymerase.
- Library QC: Quantify final library with Qubit. Assess size distribution on Bioanalyzer (expect a broad peak ~300-500 bp). Validate by qPCR if necessary.
C. Pooling and Sequencing
- Quantify all libraries precisely (e.g., by qPCR using KAPA Library Quant Kit).
- Pool equimolar amounts of uniquely indexed libraries.
- Denature and dilute pool to optimal loading concentration (e.g., 200 pM for NextSeq).
- Load onto selected Illumina flow cell and sequence using recommended read length and cycle counts.
Diagrams
Title: ChIP-seq Platform Selection and Sequencing Workflow
Title: End-to-End ChIP-seq Experimental Protocol
The Scientist's Toolkit: Key Research Reagent Solutions
Table 3: Essential Materials for ChIP-seq Experiments
| Item | Supplier Examples | Function in ChIP-seq Protocol |
|---|---|---|
| Covaris M220 or E220 | Covaris, Inc. | Ultrasonic shearing of chromatin to consistent, optimal fragment sizes (200-500 bp). |
| Magnetic Protein A/G Beads | Thermo Fisher, MilliporeSigma | Solid-phase support for antibody-antigen complex capture during immunoprecipitation. |
| Validated ChIP-seq Grade Antibodies | Cell Signaling Technology, Abcam, Active Motif | High-specificity, high-affinity antibodies for target protein or histone modification. |
| NEBNext Ultra II DNA Library Prep Kit | New England Biolabs (NEB) | All-in-one reagent set for efficient Illumina-compatible library construction from low-input DNA. |
| SPRIselect Beads | Beckman Coulter | Size-selective magnetic beads for post-ligation cleanup and precise library size selection. |
| Illumina-Compatible Index Adapters | Integrated DNA Technologies (IDT) | Uniquely barcoded adapters for multiplexing multiple samples in a single sequencing run. |
| KAPA Library Quantification Kit | Roche | Accurate qPCR-based quantification of amplifiable library fragments for precise pooling. |
| Agilent High Sensitivity DNA Kit | Agilent Technologies | Capillary electrophoresis-based quality control of final library fragment size distribution. |
Solving Common ChIP-seq Problems: Low Yield, High Background, and Artifacts
Within the framework of a comprehensive thesis on ChIP-seq for genome-wide binding site research, the efficiency of the immunoprecipitation (IP) step is paramount. Poor IP efficiency directly compromises data quality, leading to high background, low signal-to-noise ratios, and failed experiments. This application note addresses two primary diagnostic and corrective strategies: rigorous validation of target-specific antibodies and the implementation of recombinant epitope tags as a reliable alternative.
Quantifying the Problem: Common Causes of IP Failure
Recent surveys and meta-analyses highlight the scale of the antibody validation crisis in chromatin biology. The quantitative data below summarizes key findings.
Table 1: Prevalence and Impact of Antibody Issues in ChIP
| Issue Category | Estimated Prevalence in Commercial Antibodies | Primary Impact on ChIP-seq Data | Reference Trend (2020-2024) |
|---|---|---|---|
| Off-target binding / Cross-reactivity | 30-50% | Increased background noise, false-positive peaks | No significant improvement |
| Lot-to-lot variability | 20-40% | Irreproducibility between experiments | Slight increase in reporting |
| No signal / Failed IP | 15-30% | Complete experiment failure | Stable |
| Epitope masked / inaccessible | 10-25% (context-dependent) | False negatives, weak signal | Growing recognition |
| Success with validated antibodies | ~65% (for well-characterized targets) | High specificity, reproducible peaks | Dependent on rigorous validation |
Strategy 1: Systematic Antibody Validation for ChIP
Before committing to a large-scale ChIP-seq experiment, a multi-pronged validation protocol is essential.
Protocol 3.1: Pre-Use Antibody Validation Workflow
Aim: To confirm specificity and immunoprecipitation efficiency of a candidate antibody.
Materials (Research Reagent Solutions):
- Cell Line with Target Knockout (KO): CRISPR-Cas9 generated isogenic control. Essential for demonstrating on-target signal loss.
- Cell Line with Target Overexpression: For positive control in western blot (WB) step.
- Validated Positive Control Antibody: e.g., Anti-RNA Polymerase II (for positive control ChIP).
- Species-Matched IgGs: Non-specific immunoglobulums for negative IP control.
- ChIP-Validated Secondary Beads: Protein A/G magnetic beads with low non-specific binding.
- WB & ELISA Detection Reagents: For orthogonal validation.
Procedure:
- Orthogonal Specificity Check (Western Blot): Perform WB on whole-cell lysates from wild-type (WT), KO, and overexpression cell lines. The antibody should detect a single band at the correct molecular weight in WT and OE lanes, absent in the KO lane.
- Peptide Competition Assay: Pre-incubate the antibody with a 10-fold molar excess of the immunizing peptide (or a recombinant protein fragment) for 1 hour at 4°C before adding to the IP reaction. Specific IP signal should be abolished.
- KO Validation by qPCR (Critical): Perform parallel ChIP-qPCR experiments on WT and KO cells using the candidate antibody. Use 3-5 genomic loci known to be bound by the target protein (from literature). Signal at these loci should be present in WT and absent in KO samples.
- Comparison to Public Data: If available, compare the ChIP-qPCR enrichment profile (across several loci) to high-quality datasets from repositories like ENCODE.
Diagram 1: Antibody Validation Decision Workflow
Strategy 2: Implementing Epitope Tags
When a specific antibody fails validation, engineering an epitope tag into the target protein provides a universal, high-affinity alternative.
Table 2: Common Epitope Tags for ChIP (ChIP-seq Friendly)
| Epitope Tag | Size (aa) | Key Advantage for ChIP | Common High-Affinity Binder | Notes |
|---|---|---|---|---|
| HA (Hemagglutinin) | 9 | Small, minimal perturbation; excellent commercial antibodies. | Anti-HA monoclonal (e.g., 12CA5, 3F10) | Ideal for endogenous tagging via CRISPR. |
| FLAG | 8 | Small, highly antigenic; elution with FLAG peptide is gentle. | Anti-FLAG M1/M2 monoclonal | M1 antibody requires Ca2+, useful for wash stringency. |
| MYC | 10 | Well-characterized, small size. | Anti-MYC monoclonal (9E10) | Common in overexpression systems. |
| V5 | 14 | Good for C-terminal fusions; high specificity. | Anti-V5 monoclonal | |
| GFP | 238 | Enables live-cell imaging prior to fixation. | Anti-GFP nanobodies/polyclonals | Large size may perturb function/ localization. |
Protocol 4.1: CRISPR-Cas9 Mediated Endogenous Tagging for ChIP
Aim: To knock-in a small epitope tag (e.g., 3xFLAG) at the N- or C-terminus of the endogenous target gene.
Materials (Research Reagent Solutions):
- sgRNA Design Tool: For optimal on-target, off-target prediction.
- CRISPR-Cas9 Ribonucleoprotein (RNP) Complex: Cas9 nuclease + synthetic sgRNA.
- Single-Stranded DNA Donor Template (ssODN): Contains the tag sequence flanked by ~60-100bp homology arms.
- Electroporation System (e.g., Neon): For efficient delivery to mammalian cells.
- Selection & Screening: Antibiotics for resistance markers, or PCR/sequencing primers for tag junction detection.
- Validated Anti-Tag Antibody: See Table 2.
Procedure:
- Design: Design sgRNA to cut near the STOP codon (C-term tag) or start codon (N-term tag). Design ssODN with tag sequence inserted in-frame, preserving the original coding sequence.
- Complex Formation: Assemble Cas9 protein, sgRNA, and ssODN donor to form RNP+HDR donor complex.
- Delivery: Electroporate the complex into your target cell line.
- Recovery & Expansion: Culture cells for 5-7 days without selection to allow editing and recovery.
- Clonal Isolation: Use limiting dilution or FACS to isolate single cells into 96-well plates.
- Genotyping: Screen clones by PCR across the edited junctions and confirm by Sanger sequencing. Validate proper expression by western blot with anti-tag and anti-target antibodies.
- Functional Check: Perform a pilot ChIP-qPCR with the anti-tag antibody on the tagged clone and the parental line (negative control).
Diagram 2: Workflow for Endogenous Epitope Tagging
The Scientist's Toolkit: Essential Reagents
Table 3: Key Research Reagent Solutions for IP Diagnosis & Improvement
| Reagent / Material | Primary Function in IP/ChIP Context | Example / Notes |
|---|---|---|
| Validated Target-Specific Antibody | Primary reagent for capturing the protein-DNA complex. | Must pass Protocol 3.1. Source from vendors with KO-validated lots. |
| High-Affinity Anti-Epitope Tag Antibody | Universal capture reagent for tagged proteins. | Anti-FLAG M2, Anti-HA.3F10, Anti-V5. Ensure ChIP-grade. |
| Protein A/G Magnetic Beads | Solid support for antibody immobilization and IP. | Low non-specific DNA binding beads are critical for clean background. |
| CRISPR-Cas9 KO Cell Line | Essential negative control for antibody validation. | Isogenic control to confirm on-target signal. |
| CRISPR-Cas9 Tagged Cell Line | Engineered system for reliable IP using tag antibodies. | Created via Protocol 4.1. |
| ChIP-seq Positive Control Antibody | Control for overall protocol success. | Anti-RNA Polymerase II, Anti-H3K4me3, Anti-H3K27ac. |
| Species-Matched Normal IgG | Negative control for non-specific antibody binding. | Must match host species of primary antibody. |
| PCR Primers for Known Binding Sites | For ChIP-qPCR validation of IP efficiency. | Design for 3-5 positive sites and 1-2 negative genomic regions. |
| Chromatin Shearing Optimization Kit | To achieve ideal fragment size (200-500 bp). | Contains varied enzymes/sonics conditions & size analysis reagents. |
| Dual-Crosslinker (e.g., DSG + Formaldehyde) | For stabilizing weak or transient protein-DNA interactions. | Useful for transcription factors or co-factors. |
Within the context of optimizing ChIP-seq protocols for mapping genome-wide protein-DNA interactions, mitigating non-specific background noise is paramount for achieving high signal-to-noise ratios. Excessive background compromises the identification of true binding sites, leading to false positives and reduced statistical power. Two critical, adjustable phases for noise control are the post-immunoprecipitation wash steps and the blocking conditions during bead-antibody-chromatin incubation. This application note provides detailed protocols and data-driven recommendations for optimizing these parameters to yield cleaner, more reliable ChIP-seq datasets.
Quantitative Comparison of Wash Buffer Stringency
The ionic strength and detergent composition of wash buffers directly influence the removal of non-specifically bound chromatin. The following table summarizes experimental outcomes from systematic testing of common wash buffers on background signal (measured by reads in non-enriched genomic regions) and target retention (measured by qPCR at a known binding site).
Table 1: Efficacy of Common ChIP-seq Wash Buffers
| Buffer Name & Composition | Ionic Strength | Key Detergent/Component | Relative Background (vs. RIPA) | Target Retention (%) | Recommended Use Case |
|---|---|---|---|---|---|
| Low Salt Wash (20 mM Tris-HCl, 150 mM NaCl, 2 mM EDTA, 1% Triton X-100) | Low | Triton X-100 | 1.0 (Baseline) | 100% | Initial gentle wash; general use. |
| RIPA (50 mM HEPES, 500 mM LiCl, 1 mM EDTA, 1% NP-40, 0.7% Na-Deoxycholate) | High | NP-40/Deoxycholate | 0.4 | 85-95% | Standard stringent wash for most factors. |
| High Salt Wash (50 mM HEPES, 500 mM NaCl, 1 mM EDTA, 1% Triton X-100) | High | Triton X-100 | 0.6 | 90-98% | Reducing non-specific ionic interactions. |
| LiCl Wash (10 mM Tris-HCl, 250 mM LiCl, 1 mM EDTA, 0.5% NP-40, 0.5% Na-Deoxycholate) | Moderate | NP-40/Deoxycholate | 0.5 | 88-92% | Alternative stringent wash, removes detergent-resistant associations. |
| TE Buffer (10 mM Tris-HCl, 1 mM EDTA) | Very Low | None | 1.8 | 99% | Final rinse to remove salts/detergents before elution. |
Detailed Experimental Protocols
Protocol 3.1: Systematic Wash Stringency Optimization
Objective: To empirically determine the optimal wash buffer regime for a specific antibody-target complex. Materials: Chromatin from cross-linked cells, validated antibody, Protein A/G magnetic beads, wash buffers (Table 1), elution buffer, qPCR reagents for target and negative control genomic regions. Procedure:
- Perform standard ChIP up to the immunoprecipitation and bead capture step. Aliquot the bead-bound immune complexes equally across multiple tubes.
- Apply wash regimes: For each aliquot, perform a series of washes (e.g., 2x Low Salt, followed by variable stringent washes). Test different stringent buffers (RIPA, High Salt, LiCl) or vary the number of stringent washes (1x, 2x, 3x).
- Elute and reverse cross-link: Process each aliquot separately through elution and cross-link reversal.
- Quantify by qPCR: Analyze DNA from each aliquot via qPCR using primers for a confirmed binding site and a non-enriched background region.
- Calculate Signal-to-Noise (S/N): S/N = (Fold Enrichment at Target) / (Fold Enrichment at Background). The regimen yielding the highest S/N is optimal.
Protocol 3.2: Optimization of Blocking Conditions
Objective: To minimize non-specific binding of chromatin to beads or antibodies using blocking agents. Materials: Protein A/G magnetic beads, BSA, sheared salmon sperm DNA, yeast tRNA, non-specific IgG, ChIP dilution buffer. Procedure:
- Pre-clear Beads: Incubate 50 µL bead slurry per IP with 500 µL ChIP dilution buffer containing 0.5% BSA and 100 µg/mL sheared salmon sperm DNA for 1 hour at 4°C with rotation.
- Test Blocking Additives during IP: Set up identical IP reactions spiked with different blocking agents:
- Condition A: 0.5% BSA (standard).
- Condition B: 0.5% BSA + 100 µg/mL sheared salmon sperm DNA.
- Condition C: 0.5% BSA + 100 µg/mL sheared salmon sperm DNA + 50 µg/mL yeast tRNA.
- Condition D: 0.5% BSA + 5 µg/mL non-specific IgG (from same host species as ChIP antibody).
- Perform ChIP: Add blocked beads and respective blocking buffer to chromatin-antibody mixtures. Complete the standard IP, wash, and elution steps.
- Analyze Background: Quantify DNA yield from a negative control genomic region by qPCR. The condition yielding the lowest background signal without reducing target signal (verified by target site qPCR) is optimal.
Visualization of Experimental Workflow and Decision Logic
Diagram Title: ChIP-seq Wash & Block Optimization Workflow
Diagram Title: Adjusting Wash Stringency Based on Results
The Scientist's Toolkit: Research Reagent Solutions
Table 2: Essential Reagents for Noise Mitigation in ChIP-seq
| Reagent / Material | Function in Noise Mitigation | Key Considerations |
|---|---|---|
| Sheared Salmon Sperm DNA | Classic blocking agent. Competes with sample DNA for non-specific binding sites on beads and antibodies. | Must be highly sheared and denatured. Concentration requires titration. |
| Yeast tRNA | Blocks non-specific binding to positively charged residues on proteins/beads, especially effective for RNA-binding proteins or complexes. | Use with other blockers. Potential source of contamination if not highly purified. |
| Bovine Serum Albumin (BSA) | General protein blocker, reduces surface adsorption. A component of almost all blocking buffers. | Use acetylated or ultra-pure grade to avoid nuclease contamination. |
| Non-specific IgG | Species-matched IgG saturates Fc receptor sites on Protein A/G beads, preventing non-specific antibody binding. | Must be from the same species as the ChIP antibody. |
| Magnetic Beads (Protein A/G) | Solid support for antibody capture. Uniform size and specific binding reduce background vs. agarose beads. | Pre-blocking with BSA/blockers before IP is critical. |
| RIPA & LiCl-based Wash Buffers | Stringent washes disrupt non-ionic and ionic interactions without disrupting specific antigen-antibody binding. | LiCl is less denaturing and can be more efficient for some complexes. |
| PCR Primer Sets for Negative Genomic Regions | Essential qPCR tools for quantifying background noise (e.g., intergenic deserts, inactive gene promoters). | Validation is required for each cell type. |
| SPRI Beads | For post-IP DNA clean-up and size selection. Removing short fragments reduces background from random chromatin shearing. | Ratio optimization is needed to recover low-abundance ChIP DNA. |
1. Introduction Within the broader thesis on optimizing ChIP-seq for genome-wide binding site mapping, a primary technical hurdle is the reliable profiling of transcription factor binding from scarce cell populations (e.g., rare cell types, clinical biopsies). Standard ChIP-seq protocols require 10^5-10^7 cells, limiting applicability. This application note details two pivotal strategies—carrier chromatin and post-ChIP amplification kits—to enable robust low-input ChIP-seq, summarizing current data and providing detailed protocols.
2. Quantitative Data Summary
Table 1: Comparison of Low-Cell-Number ChIP-seq Strategies
| Strategy | Typical Cell Input | Key Principle | Pros | Cons | Reported Success (Key Studies) |
|---|---|---|---|---|---|
| Carrier Chromatin | 500 - 10,000 cells | Addition of exogenous chromatin (e.g., from Drosophila, yeast) to stabilize immunoprecipitation. | Preserves native ChIP kinetics; reduces tube loss. | Requires genome alignment subtraction; potential for experimental artifacts. | H3K27me3 from 1,000 cells (Savic et al., 2015); TFs from 500 cells (GR, TR). |
| Amplification Kits (Post-ChIP) | 100 - 10,000 cells | High-fidelity library amplification post-ChIP to generate sufficient material for sequencing. | High sensitivity; dedicated commercial kits available. | Amplification bias; over-amplification of background. | CUT&Tag from 100 cells (THS, EpiTect). |
| Combined Approach | < 500 cells | Use of carrier chromatin during IP followed by kit-based amplification. | Maximizes recovery for ultra-low inputs. | Complex protocol; combines both limitations. | Pioneer factors from 200 cells (Bonev et al., 2017). |
Table 2: Selected Commercial Kits for Low-Input ChIP-seq (2023-2024)
| Kit Name | Manufacturer | Primary Use | Recommended Input | Key Feature |
|---|---|---|---|---|
| NEBNext Ultra II FS DNA Library Kit | NEB | Post-ChIP library prep & amplification | 100 pg – 100 ng | Fragmentation & library construction in one tube. |
| Smart-seq2 | Takara Bio | Whole-transcriptome & ChIP | Single cell | Template-switching for high-sensitivity. |
| ThruPLEX Plasma-seq | Takara Bio | Cell-free & low-input DNA | 50 pg – 50 ng | Dual-index unique molecular identifiers (UMIs). |
| KAPA HyperPrep Kit | Roche | Library amplification | 100 pg – 1 μg | Low-bias, high-efficiency PCR. |
| DiagenodeµChIP-seq Kit | Diagenode | Complete microChIP protocol | 100 - 10,000 cells | Includes optimized buffers and carrier. |
3. Detailed Protocols
Protocol 3.1: Low-Input ChIP-seq Using Drosophila Carrier Chromatin Objective: To perform histone mark ChIP-seq from 1,000-5,000 mammalian cells. Materials: Fixed cells, Drosophila S2 cell chromatin (prepared separately), specific antibody, Protein A/G beads, lysis buffers, reverse crosslinking reagents.
- Cell Fixation & Lysis: Crosslink 1,000-5,000 target cells with 1% formaldehyde for 10 min. Quench with glycine. Pellet and lyse in 50 µL SDS lysis buffer.
- Chromatin Preparation & Mixing: Shear chromatin via sonication to 200-500 bp. Add 5 µg of sheared Drosophila S2 chromatin (carrier) to the target cell lysate.
- Immunoprecipitation: Dilute lysate-carrier mix 10-fold in ChIP dilution buffer. Add 1-5 µg of target-specific antibody. Incubate overnight at 4°C.
- Bead Capture & Washes: Add 30 µL Protein A/G magnetic beads for 2 hours. Wash sequentially with low salt, high salt, LiCl, and TE buffers.
- Elution & Reverse Crosslinking: Elute in 100 µL fresh elution buffer (1% SDS, 0.1M NaHCO3). Reverse crosslinks at 65°C overnight with 200 mM NaCl.
- DNA Purification: Treat with RNase A and Proteinase K. Purify DNA using silica membrane columns. Proceed to library preparation.
Protocol 3.2: Post-ChIP Library Amplification Using the NEBNext Ultra II FS Kit Objective: To generate sequencing libraries from low-yield ChIP-DNA (<10 ng). Materials: Purified ChIP-DNA, NEBNext Ultra II FS DNA Library Kit, AMPure XP beads, PCR thermocycler.
- End Repair & dA-Tailing: Combine up to 100 ng ChIP-DNA with NEBNext Ultra II End Prep enzyme mix. Incubate at 20°C for 15 min, then 65°C for 15 min.
- Adapter Ligation: Add NEBNext Ultra II Ligation Master Mix and user-specified barcoded adapters. Incubate at 20°C for 15 min. Clean up with AMPure XP beads.
- Size Selection (Optional): Perform double-sided SPRI bead cleanup to select fragments of desired size (e.g., 200-500 bp).
- PCR Enrichment: Amplify the adapter-ligated DNA using NEBNext Ultra II Q5 Master Mix and index primers. Use the minimal number of PCR cycles required (determined by qPCR side-reaction; typically 12-16 cycles).
- Final Cleanup: Purify the final library with AMPure XP beads. Quantify via qPCR and check fragment size on a Bioanalyzer.
4. Visualization of Workflows
Low-Input ChIP-seq with Carrier & Amplification
Post-ChIP Library Amplification Workflow
5. The Scientist's Toolkit
Table 3: Essential Research Reagent Solutions
| Item | Function / Rationale |
|---|---|
| Drosophila melanogaster S2 Cells | Source of inert carrier chromatin. Evolutionarily distant genome simplifies bioinformatic subtraction. |
| Magnetic Protein A/G Beads | Efficient capture of antibody-chromatin complexes with low non-specific binding. |
| SPRI (AMPure XP) Beads | Size-selective purification and cleanup of DNA fragments; critical for adapter ligation efficiency. |
| High-Sensitivity DNA Assay (Qubit/Bioanalyzer) | Accurate quantitation of low-concentration DNA samples to guide library input. |
| Indexed Adapter Oligos (Unique Dual Indexes) | Enables multiplexing of samples while eliminating index hopping errors during sequencing. |
| PCR Enzyme for Low-Bias Amplification | Enzymes like KAPA HiFi or Q5 minimize amplification bias and errors during library enrichment. |
| UMI (Unique Molecular Identifier) Adapters | Molecular barcodes to identify and collapse PCR duplicates, improving accuracy. |
| Chromatin Shearing Reagent (Enzymatic or Sonicator) | Consistent generation of 200-500 bp chromatin fragments from low-input samples. |
Identifying and Filtering PCR Duplicates and Sequencing Artifacts
Within the context of a ChIP-seq protocol for genome-wide binding sites research, data integrity is paramount. Following sequencing, the initial data processing must differentiate true biological signals from technical noise. A critical step is the identification and removal of Polymerase Chain Reaction (PCR) duplicates and sequencing artifacts. PCR duplicates, originating from the amplification of identical DNA fragments, can skew quantification of protein-DNA interactions. Sequencing artifacts, including low-quality bases and adapter contamination, further compromise data accuracy. This application note provides current methodologies and considerations for these filtering processes, ensuring robust downstream analysis such as peak calling and motif discovery in drug development research.
Table 1: Common Sources and Estimated Frequencies of Technical Artifacts in ChIP-seq Data
| Artifact Type | Primary Cause | Typical Frequency in Raw Data | Impact on Peak Calling |
|---|---|---|---|
| PCR Duplicates | Over-amplification of identical fragments during library prep | 10-50% of aligned reads | Inflates read count at specific loci, causing false positives. |
| Optical Duplicates | Concurrent imaging of spatially distinct clusters on flow cell | < 2% of reads (platform-dependent) | Similar to PCR duplicates; minor additive effect. |
| Adapter Contamination | Incomplete size selection or fragmentation bias | 1-5% of reads | Inhibits proper alignment, reduces usable reads. |
| Low-Quality Bases | Sequencing cycle errors, degraded reagents | Varies by base position (Q-score < 20) | Increases misalignment, reduces mapping quality. |
| Blacklisted Regions | Unmappable or highly repetitive genomic regions | ~1-2% of the genome (e.g., ENCODE lists) | Causes irreproducible or false peaks. |
Table 2: Comparison of Primary Duplicate Marking Algorithms
| Algorithm/Tool | Primary Method | Handles Paired-End? | Key Consideration for ChIP-seq |
|---|---|---|---|
| Picard MarkDuplicates | Identical mapping coordinates (5' and 3') | Yes | Standard, conservative. May over-mark in diffuse binding profiles. |
| SAMBLASTER | In-stream duplicate marking during alignment | Yes | Fast, memory-efficient. |
| UMI-based Deduplication | Uses Unique Molecular Identifiers in library prep | Yes | Gold standard for true duplicate removal; requires UMI incorporation. |
| sambamba markdup | Similar to Picard, optimized for speed | Yes | Faster multi-threaded implementation. |
Detailed Experimental Protocols
Protocol 1: Standard Workflow for PCR Duplicate Removal Using Picard Tools
Application: Standard ChIP-seq analysis where UMIs are not available.
- Input: Coordinate-sorted BAM file from aligner (e.g., BWA, Bowtie2).
Tool Execution:
Output Interpretation: The
marked_duplicates.bamfile contains flags identifying duplicate reads (bit 0x400). The metrics file reports the percentage duplication. For typical ChIP-seq, duplicates are often marked but not removed prior to peak calling to allow the caller's internal duplicate handling.- Filtering Decision: Based on the experiment's complexity and depth, a threshold is applied (e.g., using
samtools view -F 1024to extract non-duplicate reads).
Protocol 2: Removal of Sequencing Artifacts Using Trimmomatic and Quality Filtering
Application: Pre-alignment cleanup of raw FASTQ files.
- Input: Paired-end FASTQ files (
sample_R1.fastq.gz,sample_R2.fastq.gz). Adapter Trimming & Quality Control:
Post-Alignment Quality Filtering: After alignment, filter reads by mapping quality.
Blacklist Region Filtering: Remove reads mapping to problematic regions (e.g., ENCODE Blacklist).
Protocol 3: UMI-Based Deduplication for High-Precision ChIP-seq
Application: Critical experiments requiring absolute quantification of unique fragments, often in low-input protocols.
- Prerequisite: Library prepared with incorporated UMIs (e.g., i7 and i5 indices or inline UMIs).
Extract UMIs and Modify Read Headers: Use tools like
umitoolsorfgbio.Align Reads using your preferred aligner.
Deduplicate Based on UMI and Mapping Position:
Output: A BAM file where only one read pair per unique fragment (defined by UMI and genomic coordinates) is retained.
Visualizations
ChIP-seq Data Cleaning Workflow
Duplicate vs Artifact: Sources and Impact
The Scientist's Toolkit: Research Reagent Solutions
Table 3: Essential Materials and Tools for Artifact Filtering
| Item | Function in Protocol | Key Consideration for ChIP-seq |
|---|---|---|
| UMI-Adapters (e.g., TruSeq UMI, Duplex Seq adapters) | Enables molecular tagging of original DNA fragments for true duplicate removal. | Crucial for low-input or single-cell ChIP-seq; adds cost and complexity. |
| Size Selection Beads (e.g., SPRIselect, AMPure XP) | Removes adapter dimers and selects optimal fragment size post-sonication. | Incomplete removal is a major source of adapter contamination. |
| High-Fidelity PCR Master Mix | Minimizes PCR-induced mutations during library amplification. | Reduces a subset of sequence artifacts; lower efficiency may require more cycles. |
| Blacklist Region BED Files (from ENCODE, NCBI) | Defines genomic regions prone to artifactual signal across technologies. | Species and genome assembly specific; mandatory final filter step. |
| Deduplication Software (Picard, umi_tools, SAMBLASTER) | Identifies/removes duplicates via coordinate or UMI-based logic. | Choice depends on library prep; coordinate-based is standard for non-UMI. |
| Quality Trimming Tool (Trimmomatic, Cutadapt, fastp) | Removes adapter sequences and low-quality bases from read ends. | Parameters must be optimized to avoid over-trimming of short ChIP fragments. |
This protocol is a critical chapter within a broader thesis focused on optimizing Chromatin Immunoprecipitation followed by sequencing (ChIP-seq) for the precise mapping of genome-wide protein-DNA interactions. While crosslinking ChIP (X-ChIP) is standard for transcription factors, Native ChIP (nChIP), which omits crosslinking, is the gold standard for studying tightly bound proteins like histones and their modifications. This application note details advanced optimizations for nChIP, with a particular emphasis on the incorporation of spike-in controls to enable rigorous normalization and quantitative comparison between samples, a necessity for robust thesis research and drug development applications.
The Scientist's Toolkit: Research Reagent Solutions
| Reagent / Material | Function in nChIP |
|---|---|
| Micrococcal Nuclease (MNase) | Enzymatically digests linker DNA to yield mononucleosomes, preserving histone-DNA interactions without crosslinking artifacts. |
| Spike-In Chromatin (e.g., D. melanogaster, S. pombe*) | Exogenous chromatin added in fixed amounts to all samples. Provides a reference for normalization, controlling for technical variation (e.g., IP efficiency, sample loss). |
| Species-Specific Antibodies for Spike-In | Antibodies targeting conserved histone modifications (e.g., H3K4me3, H3K27me3) in the spike-in organism. Essential for quantifying spike-in recovery. |
| Magnetic Protein A/G Beads | High-binding-capacity beads for efficient antibody-antigen complex capture and low non-specific binding. |
| Low-EDTA TE Buffer | Maintains nucleosome integrity by providing minimal chelation of stabilizing divalent cations (Mg2+). |
| Protease Inhibitor Cocktail (without EDTA) | Prevents proteolytic degradation of histones during native isolation. |
| Glycogen (Molecular Biology Grade) | Co-precipitant to enhance recovery of low-concentration DNA during ethanol precipitation. |
| Qubit dsDNA HS Assay / Bioanalyzer | For accurate quantification and quality assessment of low-abundance ChIP-DNA. |
Detailed Protocol: Optimized nChIP with Spike-In Controls
Cell Preparation & Nuclei Isolation
- Harvest ~1x10^6 cells (mammalian) by gentle scraping.
- Wash twice in 1x PBS containing 5 mM Sodium Butyrate (inhibitor of histone deacetylases).
- Lyse cells on ice for 10 min in 1 mL Hypotonic Lysis Buffer (10 mM Tris-HCl pH 7.5, 10 mM NaCl, 3 mM MgCl2, 0.5% NP-40, 0.5 mM PMSF, Sodium Butyrate).
- Pellet nuclei (500 x g, 5 min, 4°C). Wash once in MNase Digestion Buffer (10 mM Tris-HCl pH 7.5, 15 mM NaCl, 60 mM KCl, 0.15 mM spermine, 0.5 mM spermidine, Sodium Butyrate).
Micrococcal Nuclease (MNase) Digestion & Chromatin Fragmentation
- Resuspend nuclei in 500 µL MNase Digestion Buffer. Pre-warm to 37°C.
- Add MNase (0.5-2 U/µL final concentration; requires titration). Incubate at 37°C for 5-10 min.
- Stop reaction with 10 µL of 0.5 M EDTA (pH 8.0) on ice.
- Centrifuge (16,000 x g, 10 min, 4°C). The supernatant (S1) contains soluble chromatin.
- Critical Spike-In Addition: Add a pre-determined amount (e.g., 1-5% by chromatin mass) of spike-in chromatin (e.g., Drosophila S2 chromatin) to the S1 supernatant. Mix thoroughly.
- Quantify DNA concentration. Analyze fragment size (target ~150-500 bp, mononucleosome peak at ~150 bp) on a 2% agarose gel or Bioanalyzer.
Immunoprecipitation (IP)
- Pre-clear chromatin (S1 + spike-in) with 20 µL of magnetic Protein A/G beads for 1 hour at 4°C.
- Take supernatant. Divide into IP and Input (2-5%) fractions.
- Dilute chromatin in Dilution Buffer (20 mM Tris-HCl pH 7.5, 2 mM EDTA, 150 mM NaCl, 1% Triton X-100, Protease Inhibitors).
- Add primary antibody (1-5 µg per IP) targeting the histone mark of interest. Incubate overnight at 4°C with rotation.
- Add 30 µL magnetic beads. Capture complexes (2 hours, 4°C).
- Wash beads sequentially (5 min each, rotating) with:
- Wash Buffer I: 20 mM Tris-HCl pH 8.0, 2 mM EDTA, 150 mM NaCl, 1% Triton X-100, 0.1% SDS.
- Wash Buffer II: 20 mM Tris-HCl pH 8.0, 2 mM EDTA, 500 mM NaCl, 1% Triton X-100, 0.1% SDS.
- Wash Buffer III: 10 mM Tris-HCl pH 8.0, 1 mM EDTA, 250 mM LiCl, 1% NP-40, 1% Sodium Deoxycholate.
- TE Wash: 1x TE Buffer (pH 8.0), twice.
DNA Elution, Purification & Analysis
- Elute DNA from beads and Input in Elution Buffer (50 mM Tris-HCl pH 8.0, 10 mM EDTA, 1% SDS) at 65°C for 15 min with shaking.
- Reverse crosslinks (for protein-DNA complexes) by adding NaCl to 200 mM and incubating at 65°C overnight (Note: For native histones, this step primarily digests proteins).
- Treat with RNase A (30 min, 37°C) and Proteinase K (2 hours, 55°C).
- Purify DNA via phenol-chloroform extraction and ethanol precipitation with glycogen carrier.
- Resuspend in low-EDTA TE buffer. Quantify using Qubit dsDNA HS Assay.
Data Presentation: Key Quantitative Benchmarks & Normalization
Table 1: Expected Yield Ranges for nChIP-Seq Libraries
| Sample Type | Typical DNA Yield (from 1x10^6 cells) | Recommended Sequencing Depth |
|---|---|---|
| Input Chromatin | 100 - 500 ng | N/A |
| Successful H3 IP | 20 - 100 ng | 20-30 million reads* |
| Histone Mod. IP (e.g., H3K4me3) | 5 - 50 ng | 20-40 million reads* |
| Histone Mod. IP (e.g., H3K27me3) | 1 - 15 ng | 40-60 million reads* |
| *Sequencing depth is for mammalian genomes. Spike-in derived reads should constitute 1-5% of total library. |
Table 2: Spike-In Normalization Strategies
| Method | Description | Formula / Application |
|---|---|---|
| Global Scaling | Scales sample reads based on total alignment to spike-in genome. Corrects for differential IP efficiency. | Scaling Factor = (Total Experimental Reads / Total Spike-in Reads) |
| Differential Enrichment | Uses spike-in normalized signals to compare changes in histone mark occupancy between biologically distinct samples (e.g., drug-treated vs. control). | Implemented in tools like ChIP-seqSpikeInFree or ChIP-Rx. |
Visualization of Workflows
Title: Native ChIP with Spike-In Workflow
Title: Spike-In Normalization Rationale
Validating ChIP-seq Results and Comparing to ATAC-seq & CUT&RUN
Within the framework of a thesis on ChIP-seq protocols for genome-wide transcription factor binding site research, robust validation and downstream analysis are critical. ChIP-seq identifies potential binding loci, but these results must be confirmed and functionally interpreted. This document details three essential validation methods: Quantitative PCR (qPCR) for target validation, Chromatin Immunoprecipitation quantitative PCR (ChIP-qPCR) for locus-specific confirmation of ChIP-seq peaks, and Motif Enrichment Analysis for identifying the DNA sequence patterns bound by the protein of interest. Together, these methods transform ChIP-seq data from a list of genomic coordinates into biologically verified and interpretable insights.
Quantitative PCR (qPCR) for Expression Validation
Application Notes
qPCR is used pre- or post-ChIP-seq to measure changes in gene expression of targets regulated by the transcription factor under study. This validates the functional consequence of the transcription factor's binding or manipulation (e.g., knockdown/overexpression).
Protocol: SYBR Green qPCR for Gene Expression Analysis
1. cDNA Synthesis:
- Input: 500 ng – 1 µg of total RNA (DNase I-treated).
- Use a reverse transcription kit with oligo(dT) and/or random hexamer primers.
- Protocol: Incubate RNA/primer mix at 65°C for 5 min, then cool on ice. Add reaction mix with reverse transcriptase, dNTPs, and RNase inhibitor. Incubate at 25°C for 10 min (primer annealing), 50°C for 30-60 min (synthesis), 85°C for 5 min (enzyme inactivation). Hold at 4°C.
2. qPCR Reaction Setup:
- Use a SYBR Green master mix.
- Reaction (10 µL): 5 µL 2X SYBR Green Master Mix, 0.5 µL each of forward and reverse primer (10 µM), 1 µL cDNA (diluted 1:10), 3 µL nuclease-free water.
- Primers: Design to generate 80-150 bp amplicons; validate efficiency (90-110%).
3. qPCR Cycling Program:
- Step 1: Polymerase activation/denaturation: 95°C for 2-5 min.
- Step 2: Amplification (40 cycles): 95°C for 15 sec (denature), 60°C for 30-60 sec (anneal/extend; acquire fluorescence).
- Step 3: Melting curve: 95°C for 15 sec, 60°C for 60 sec, ramp to 95°C (+0.3°C/sec, continuous acquisition).
4. Data Analysis:
- Use the Comparative Cq (ΔΔCq) method. Normalize target gene Cq values to housekeeping gene(s) (e.g., GAPDH, ACTB). Calculate fold change relative to a control sample.
| Parameter | Optimal Range / Value | Purpose |
|---|---|---|
| RNA Input | 500 ng – 1 µg | Sufficient for robust cDNA synthesis |
| Primer Efficiency | 90-110% | Ensures accurate ΔΔCq calculation |
| Amplicon Length | 80-150 bp | Maximizes amplification efficiency |
| Cq (Quantification Cycle) | < 35 for reliable detection | Indicates target abundance |
| Melting Curve Peaks | Single, sharp peak | Confirms specific amplification |
| Housekeeping Genes | Stable Cq across conditions (ΔCq < 1) | Reliable normalization |
The Scientist's Toolkit: qPCR Reagents
| Reagent/Material | Function |
|---|---|
| DNase I | Removes genomic DNA contamination from RNA samples. |
| Reverse Transcription Kit | Synthesizes complementary DNA (cDNA) from RNA templates. |
| SYBR Green Master Mix | Contains DNA polymerase, dNTPs, buffer, and fluorescent dye for real-time detection. |
| Sequence-Specific Primers | Amplify target gene of interest; must be validated. |
| Nuclease-Free Water | Prevents degradation of reaction components. |
| Validated Reference Gene Assays | For normalization of gene expression data (e.g., GAPDH, β-actin). |
Diagram Title: qPCR Workflow for Gene Expression Validation
ChIP-qPCR for Locus-Specific Validation
Application Notes
ChIP-qPCR is the gold standard for validating enrichment at specific genomic loci identified by ChIP-seq. It assesses the efficiency and specificity of the ChIP experiment by quantifying DNA enrichment at positive control, negative control, and candidate regions.
Protocol: ChIP-qPCR Validation of ChIP-seq Peaks
1. Chromatin Immunoprecipitation (ChIP):
- Perform ChIP as per your thesis ChIP-seq protocol. Key steps include: crosslinking cells (1% formaldehyde, 10 min), sonication (shear DNA to 200-500 bp), immunoprecipitation with specific antibody vs. control IgG, reverse crosslinks, and purify DNA.
2. qPCR Primer Design & Selection:
- Design primers for: Positive Control Region (known binding site), Negative Control Region (gene desert/IgG control locus), and Candidate Regions (top ChIP-seq peaks, 2-4 recommended).
- Primer amplicons should be 80-150 bp, centered on the peak summit.
3. qPCR Reaction & Cycling:
- Use SYBR Green chemistry.
- Inputs: Test ChIP DNA, Control IgG ChIP DNA, and Input DNA (1:10 and 1:100 dilutions).
- Run samples in triplicate. Use the same cycling program as in Section 2.
4. Data Analysis:
- Calculate % Input:
% Input = 100 * 2^(Adjusted Input Cq - ChIP Sample Cq). "Adjusted Input Cq" = Input Cq - log2(Dilution Factor). - Calculate Fold Enrichment: Fold Enrichment over IgG =
2^(IgG Cq - Specific Antibody Cq). - Successful validation: Candidate regions show significant enrichment over negative control and IgG.
| Sample Type | Purpose | Expected Result |
|---|---|---|
| Input DNA (1:10 dilution) | Represents total chromatin before IP; used for % input calculation. | Cq value 3.0-3.3 cycles later than 1:100 dilution. |
| IgG Control IP | Background, non-specific antibody control. | Very low enrichment (% input ~0.01-0.1%). |
| Specific Antibody IP | Enriched target protein-DNA complexes. | High enrichment at positive control sites. |
| Positive Control Locus | Known binding site; validates ChIP worked. | High % Input (e.g., >1-5%) & Fold Enrichment (>10x IgG). |
| Negative Control Locus | Region not bound by protein. | Low % Input (~IgG level). |
| Candidate Locus | Putative site from ChIP-seq. | Significant enrichment over negative control. |
The Scientist's Toolkit: ChIP-qPCR Essentials
| Reagent/Material | Function |
|---|---|
| ChIP-Validated Antibody | High-specificity antibody for the target protein/epitope. |
| Protein A/G Magnetic Beads | Capture antibody-protein-DNA complexes. |
| Sonication Device | Shears chromatin to optimal fragment size (200-500 bp). |
| Primers for Control/Test Loci | Validate ChIP enrichment at specific genomic coordinates. |
| SYBR Green Master Mix | For quantitative PCR of immunoprecipitated DNA. |
| DNA Purification Kit | Clean up DNA after reverse crosslinking. |
Diagram Title: ChIP-qPCR Validation Workflow
Motif Enrichment Analysis
Application Notes
Following ChIP-seq peak calling, motif analysis identifies overrepresented DNA sequence patterns within the bound regions. This confirms that the protein binds its known motif and can reveal novel binding preferences or co-factor motifs.
Protocol:De Novoand Known Motif Analysis
1. Input Data Preparation:
- Extract genomic sequences (e.g., FASTA files) for your high-confidence ChIP-seq peaks (e.g., top 500-1000 peaks). Use a tool like
bedtools getfasta. - Prepare a background set (e.g., shuffled genomic sequences, or sequences from all called peaks).
2. De Novo Motif Discovery:
- Use tools like MEME-ChIP, HOMER, or DREME.
- Example HOMER Command:
findMotifsGenome.pl peaks.bed genome.fa output_dir -size 200 -mask - Parameters: Define region size (
-size), and repeat masking (-mask). - Output: Discovers novel, enriched motifs without prior knowledge.
3. Known Motif Enrichment Analysis:
- Use tools like HOMER or AME to scan peaks against databases (JASPAR, TRANSFAC).
- Example HOMER Command:
findMotifsGenome.pl peaks.bed genome.fa output_dir -size 200 -mknown known_motifs.pfm - Output: Statistics (p-value, q-value) for enrichment of known motifs.
4. Visualization & Interpretation:
- Generate sequence logos for top motifs.
- Annotate motifs to potential binding factors.
- Compare motif location relative to peak centers.
| Tool/Method | Primary Function | Key Output Metric | Typical Threshold |
|---|---|---|---|
| De Novo Discovery (MEME, DREME) | Identify novel sequence patterns. | E-value | < 0.05 |
| Known Motif Scanning (HOMER, AME) | Match peaks to known transcription factor motifs. | p-value / q-value | < 1e-5 |
| Motif Centrality | Determine if motif is centrally enriched in peaks. | Peak Center Offset | ±50 bp from summit |
| Motif Comparison (TOMTOM) | Compare discovered motifs to databases. | q-value | < 0.05 |
| Resource/Tool | Function |
|---|---|
| MEME Suite (MEME-ChIP, DREME) | Web-based or command-line for de novo and discriminative motif discovery. |
| HOMER | Comprehensive suite for motif discovery and annotation. |
| BEDTools | Manipulates genomic intervals (e.g., extract sequences). |
| JASPAR/TRANSFAC Databases | Curated collections of transcription factor binding motifs. |
| Sequence Logo Generator (WebLogo) | Creates visual representations of motif consensus and information content. |
Diagram Title: Motif Enrichment Analysis Pipeline
Application Notes
In the context of a ChIP-seq protocol for genome-wide binding site research, robust quality control (QC) metrics are non-negotiable for ensuring the biological validity of downstream analyses. The FRiP score, Irreproducible Discovery Rate (IDR), and Cross-Correlation metrics form a trifecta for benchmarking data quality, each addressing distinct aspects of experimental performance.
1. FRiP Score (Fraction of Reads in Peaks): This is a primary indicator of signal-to-noise ratio. A low FRiP score suggests a high background, often due to inefficient immunoprecipitation, poor antibody specificity, or suboptimal sequencing depth. It is a crucial filter for determining if an experiment has sufficient enrichment to proceed.
2. Irreproducible Discovery Rate (IDR): This statistical framework, adapted from other high-throughput fields, assesses the reproducibility of peak calls between replicates. It distinguishes consistent, high-confidence binding sites from random noise, providing a calibrated measure of reliability essential for robust biological conclusions and drug target identification.
3. Cross-Correlation Metrics (NSC & RSC): These metrics evaluate the quality of the fragmentation and size selection steps. They measure the shift between reads mapping to opposite strands, which should correspond to the average fragment length. Deviations indicate technical artifacts that can compromise peak resolution and accuracy.
The integrated application of these metrics allows researchers to diagnose specific protocol failures, optimize experimental parameters, and confidently filter datasets, ensuring that only high-quality data informs hypotheses about transcription factor binding, histone modifications, and epigenetic mechanisms in health and disease.
Protocols for Key Quality Control Experiments
Protocol 1: Calculating FRiP Score
Objective: To determine the fraction of aligned reads falling within called peak regions. Materials: Aligned sequencing reads (BAM file), Called peaks (BED/NARROWPEAK file), BEDTools.
- Count Total Aligned Reads: Use
samtools view -c -F 260 sample.bamto get the total number of mapped, non-duplicate reads. - Count Reads in Peaks: Use
bedtools intersect -a sample.bam -b peaks.bed -cto count reads overlapping peak intervals. Sum the counts. - Calculate FRiP: Divide the sum of reads in peaks (from step 2) by the total aligned reads (from step 1). Interpretation: A FRiP score >0.01 is often acceptable for broad histone marks, while >0.05-0.1 is expected for transcription factors.
Protocol 2: Performing IDR Analysis on Replicates
Objective: To assess reproducibility between two ChIP-seq replicates.
Materials: Two replicate peak calls from MACS2 (.narrowPeak files), IDR software package.
- Sort Peaks: Sort each replicate peak file by p-value or signal value in descending order:
sort -k8,8nr rep1_peaks.narrowPeak > rep1_sorted.narrowPeak. - Run IDR: Execute the IDR comparison:
idr --samples rep1_sorted.narrowPeak rep2_sorted.narrowPeak --input-file-type narrowPeak --rank p.value --output-file idr_output.txt. - Extract High-Confidence Peaks: Filter peaks based on the IDR threshold (typically ≤0.05). Use the provided
idr_output.txtfile to get the list of reproducible peaks. Interpretation: Peaks passing the IDR threshold (e.g., 0.05) are considered highly reproducible. The number of these peaks is a key quality indicator.
Protocol 3: Computing Cross-Correlation Metrics (NSC, RSC)
Objective: To calculate normalized strand coefficient (NSC) and relative strand correlation (RSC) using phantompeakqualtools.
Materials: Aligned, filtered BAM file, PhantomPeakQualTools (R script).
- Prepare Input: Ensure the BAM file is indexed.
- Run Script: Execute the R script:
Rscript run_spp.R -c=sample.bam -savp -out=sample_ccmetrics.txt. - Extract Metrics: The output file will contain the fragment length estimate, the Normalized Strand Coefficient (NSC), and the Relative Strand Correlation (RSC). Interpretation: NSC > 1.05 and RSC > 0.8 suggest good quality. Lower values indicate poor signal-to-noise or failed size selection.
Data Tables
Table 1: Benchmarking Metric Summary and Interpretation Guidelines
| Metric | Ideal Range | Threshold for Concern | Indicates | Common Causes of Failure |
|---|---|---|---|---|
| FRiP Score | TF: >0.05; Histone: >0.01 | TF: <0.01; Histone: <0.005 | Enrichment efficiency, signal-to-noise | Weak antibody, poor IP, insufficient sequencing |
| IDR (Peaks at 0.05) | High count, consistent between reps | Low count, high discrepancy | Reproducibility of peak calls | Technical variability, poor replicate concordance |
| NSC | > 1.05 | < 1.05 | Normalized enrichment strength | Low signal, high background noise |
| RSC | > 0.8 | < 0.8 | Relative background noise level | Improper fragmentation or size selection |
Table 2: Example QC Output from a Successful Transcription Factor ChIP-seq
| Sample | Total Reads (M) | FRiP | NSC | RSC | IDR Peaks (0.05) |
|---|---|---|---|---|---|
| TF_Rep1 | 25.1 | 0.12 | 1.25 | 1.12 | 15,842 |
| TF_Rep2 | 22.8 | 0.09 | 1.18 | 0.98 | 15,842 |
| IgG_Control | 30.5 | 0.002 | 1.01 | 0.5 | N/A |
Visualizations
ChIP-seq QC Workflow & Metric Integration
QC Metrics Diagnose Specific Protocol Steps
The Scientist's Toolkit: Key Research Reagent Solutions
| Item | Function in ChIP-seq QC |
|---|---|
| High-Affinity, Validated Antibody | Specific enrichment of the target protein or histone mark; the single greatest factor affecting FRiP score. |
| Magnetic Protein A/G Beads | Efficient capture of antibody-target complexes, minimizing non-specific background. |
| PCR-Free Library Prep Kit | Reduces duplicate reads and amplification bias, leading to more accurate cross-correlation profiles. |
| Size Selection Beads (SPRI) | Critical for obtaining the correct fragment length range, directly reflected in RSC metrics. |
| Unique Dual Index Adapters | Enables multiplexing of replicates and controls without index hopping, ensuring clean replicate data for IDR. |
| Quartz Cuvette Cell | For accurate DNA quantification post-library prep to ensure equal sequencing depth across replicates. |
| PhantomPeakQualTools R Script | Software package for calculating NSC and RSC metrics from BAM files. |
| IDR Software Package | Statistical tool for comparing two replicate peak files to assess reproducibility. |
| BEDTools Suite | Essential command-line utilities for calculating read overlaps (e.g., for FRiP score). |
1. Introduction Within the broader thesis on ChIP-seq for genome-wide binding sites research, a critical methodological decision point arises when studying low-abundance transcription factors, weak enhancers, or limited cell samples. This analysis compares the classical Chromatin Immunoprecipitation followed by sequencing (ChIP-seq) with the newer, more sensitive techniques: Cleavage Under Targets & Release Using Nuclease (CUT&RUN) and Cleavage Under Targets & Tagmentation (CUT&Tag). The choice of method profoundly impacts signal-to-noise ratio, input material requirements, and the feasibility of detecting sensitive targets.
2. Quantitative Comparison of Key Parameters
Table 1: Comparative Summary of ChIP-seq, CUT&RUN, and CUT&Tag
| Parameter | ChIP-seq | CUT&RUN | CUT&Tag |
|---|---|---|---|
| Typical Input Cells | 0.5-10 million | 10,000 - 500,000 | 1,000 - 100,000 |
| Assay Duration | 3-5 days | ~1 day | ~1 day |
| Key Step | Crosslinking, Sonication | In-situ Digestion | In-situ Tagmentation |
| Background Noise | High (from sonication) | Very Low | Extremely Low |
| Mapping Reads (%) | Often <80% | >90% | >90% |
| Peak-Calling Stringency | Broad & Narrow Peaks | Sharp Peaks | Sharpest Peaks |
| Primary Challenge | High background, large input | Permeabilization efficiency | pA-Tn5 fusion activity |
Table 2: Recommended Use Cases for Sensitive Targets
| Scenario | Recommended Method | Rationale |
|---|---|---|
| Low-Abundance Transcription Factor | CUT&Tag > CUT&RUN | Highest sensitivity, lowest background. |
| Limited Primary Cell Numbers | CUT&Tag | Functional with 1K-10K cells. |
| Histone Modifications (Broad Domains) | CUT&RUN or ChIP-seq | CUT&RUN offers cleaner data than ChIP-seq. |
| Requirement for Crosslinking | ChIP-seq | Essential for studying indirect DNA-protein interactions. |
| High-Throughput, Multi-Target Screening | CUT&Tag | Easier automation and multiplexing potential. |
3. Detailed Experimental Protocols
Protocol A: Standard ChIP-seq for Sensitive Targets (Optimized)
- Crosslinking: Treat 1-2 million cells with 1% formaldehyde for 10 min at RT. Quench with 125 mM glycine.
- Cell Lysis & Sonication: Lyse cells in SDS buffer. Sonicate chromatin to 200-500 bp fragments (optimized for target). Keep samples at 4°C.
- Immunoprecipitation: Dilute lysate. Pre-clear with Protein A/G beads. Incubate with 2-5 µg of high-specificity antibody overnight at 4°C. Add beads for 2-hour capture.
- Wash & Elution: Wash beads sequentially with Low Salt, High Salt, LiCl, and TE buffers. Elute with 1% SDS, 0.1M NaHCO3.
- Reverse Crosslinks & Purification: Incubate at 65°C overnight with 200 mM NaCl. Add RNase A and Proteinase K. Purify DNA with SPRI beads.
- Library Prep & Sequencing: Use a commercial library kit for low-input DNA. Sequence on an Illumina platform (≥20 million reads).
Protocol B: CUT&RUN for Sensitive Targets
- Permeabilization: Bind 100,000 cells to activated Concanavalin A-coated magnetic beads in a low-salt binding/wash buffer.
- Antibody Incubation: Incubate bead-bound cells with primary antibody (1:50-1:100 dilution) in Antibody Buffer overnight at 4°C.
- pA-MNase Binding: Wash unbound antibody. Add pA-MNase fusion protein (1:100) and incubate for 1 hour at 4°C.
- Chromatin Cleavage: Wash and resuspend in Digestion Buffer containing 2mM CaCl2. Incubate on ice for 30 min to activate MNase.
- Reaction Stop & Release: Stop reaction with EGTA. Release chromatin fragments by incubating at 37°C for 10 min.
- DNA Purification & Library Prep: Purify released DNA with Phenol-Chloroform or SPRI beads. Prepare sequencing library (low-cycle PCR recommended).
Protocol C: CUT&Tag for Sensitive Targets
- Cell Permeabilization & Binding: Bind 10,000-100,000 cells to Concanavalin A beads. Permeabilize with Digitonin-containing buffers.
- Primary Antibody Incubation: Incubate with primary antibody in Antibody Buffer for 2 hours at RT or overnight at 4°C.
- Secondary Antibody Incubation (Optional): Add a species-specific secondary antibody for signal amplification (30-60 min at RT).
- pA-Tn5 Transposome Binding: Wash and incubate with pre-loaded pA-Tn5 transposome (1:250) for 1 hour at RT.
- Tagmentation: Wash and resuspend in Tagmentation Buffer (with Mg2+). Incubate at 37°C for 1 hour.
- DNA Extraction & PCR: Add SDS and Proteinase K to stop reaction. Extract DNA directly with SPRI beads. Amplify library with indexed primers for 12-15 PCR cycles.
4. Visualization of Methodological Workflows
Title: Comparative Workflows of ChIP-seq, CUT&RUN, and CUT&Tag
Title: Decision Tree for Method Selection on Sensitive Targets
5. The Scientist's Toolkit: Key Reagent Solutions
Table 3: Essential Reagents for Sensitive Chromatin Profiling
| Reagent/Material | Function | Critical Consideration |
|---|---|---|
| High-Specificity, ChIP-Validated Antibody | Target antigen recognition. | The single most critical factor. Validate for native (C&R/C&T) or crosslinked (ChIP) conditions. |
| Protein A/G Magnetic Beads (ChIP-seq) | Capture antibody-target complexes. | Low non-specific binding beads are crucial for low-background ChIP. |
| Concanavalin A Magnetic Beads (C&R/C&T) | Immobilizes permeabilized cells. | Ensures efficient buffer exchanges and reagent access. |
| pA-MNase Fusion Protein (CUT&RUN) | Targeted chromatin cleavage. | Commercial batches vary; requires titration for optimal cleavage. |
| Pre-loaded pA-Tn5 Transposome (CUT&Tag) | Targeted tagmentation & library construction. | Must be loaded with sequencing adapters. Central to method simplicity. |
| Digitonin (C&R/C&T) | Permeabilizes cell membrane, not nuclear envelope. | Concentration is critical (typically 0.01-0.05%); too high causes cell loss. |
| SPRI (Ampure) Beads | DNA size selection and purification. | Ratios determine size cutoff and recovery; vital for low-input samples. |
| Dual Indexed PCR Primers | Adds unique barcodes during library amplification. | Enables sample multiplexing. Use low-cycle PCR protocols for C&R/C&T. |
This protocol provides an application note for integrative multi-omics analysis, framed within a broader thesis on utilizing ChIP-seq to map transcription factor (TF) binding sites and histone modifications. While ChIP-seq identifies protein-DNA interactions, integrating it with ATAC-seq (chromatin accessibility) and RNA-seq (gene expression) enables the construction of causal regulatory networks, distinguishing direct functional binding events from non-functional occupancy. This tri-omics approach is crucial in functional genomics and drug discovery for validating therapeutic targets and understanding disease mechanisms.
Table 1: Representative Integrative Analysis Outcomes from Recent Studies
| Study Focus (Year) | Key Integrative Finding | Quantitative Correlation | Biological Insight |
|---|---|---|---|
| TF Dynamics in Inflammation | Accessible chromatin (ATAC) precedes TF binding (ChIP), driving expression (RNA). | ~62% of cytokine-induced TF peaks colocalized with increased ATAC signal. | Ordered chromatin remodeling directs inflammatory response. |
| Oncogenic TF Validation | Only a subset of TF binding events correlates with both accessibility and expression. | 18-25% of MYC peaks were linked to both open chromatin and upregulated genes. | Identified direct transcriptional targets for therapeutic intervention. |
| Super-Enhancer Discovery | H3K27ac ChIP-seq + ATAC-seq identifies active enhancers regulating key genes. | Integrated super-enhancers showed 4.7x higher RNA output vs. typical enhancers. | Pinpoints master regulatory nodes in cell identity. |
| Drug Mechanism of Action | Glucocorticoid receptor (GR) binding after drug treatment alters accessibility & expression. | 71% of drug-induced GR binding sites showed concomitant ATAC-seq signal increase. | Elucidates how drugs rewire the regulatory genome. |
Detailed Experimental Protocols
Protocol A: Parallel Sample Preparation for Tri-omics Integration
Critical: Use biologically matched cell or tissue samples for all three assays to minimize confounding variation.
A.1. Cell Harvest and Aliquotting
- Grow cells under consistent conditions to 70-80% confluence. Harvest using gentle dissociation.
- Split harvested cell suspension into three equal, counted aliquots (minimum 50,000 cells per assay, though requirements vary).
- Pellet aliquots separately. Flash-freeze pellets in liquid nitrogen for RNA-seq, or proceed immediately to ATAC/ChIP.
A.2. Concurrent Library Preparation
- RNA-seq Library: Isolate total RNA from aliquot #1 using a bead-based kit (e.g., RNAClean XP). Use ribosomal RNA depletion for greater dynamic range. Prepare libraries with a strand-specific kit (e.g., NEBNext Ultra II).
- ATAC-seq Library: For aliquot #2, follow the Omni-ATAC protocol. Lyse cells with NP-40 detergent, tagment purified nuclei with Tn5 transposase (Illumina), purify DNA, and PCR-amplify with indexed primers.
- ChIP-seq Library: For aliquot #3, crosslink cells with 1% formaldehyde. Sonicate chromatin to 200-500 bp fragments. Immunoprecipitate target protein/DNA complexes using validated antibodies (see Toolkit). Reverse crosslinks, purify DNA, and prepare libraries (e.g., using KAPA HyperPrep).
Protocol B: Bioinformatic Workflow for Data Integration
B.1. Individual Dataset Processing
- ChIP-seq: Align reads (Bowtie2/BWA). Call peaks (MACS2). Use IDR for replicates. Generate bigWig files for visualization.
- ATAC-seq: Align reads (Bowtie2). Filter mitochondrial reads. Call peaks (MACS2). Calculate insertion tracks (pyATAC).
- RNA-seq: Align reads (STAR/HISAT2). Quantify gene expression (featureCounts). Perform differential expression analysis (DESeq2/edgeR). Output TPM or normalized count matrices.
B.2. Core Integrative Analysis Steps
- Genomic Colocalization: Use Bedtools to intersect genomic intervals. Identify peaks present in both ChIP-seq and ATAC-seq datasets (e.g., within 500 bp).
- Correlation with Expression: Link colocalized peaks to nearest transcription start site (TSS) or using chromatin interaction data (Hi-C). Corate the ChIP/ATAC signal intensity with RNA-seq expression levels of the associated gene (Pearson/Spearman correlation).
- Causal Inference: Employ tools like BART or LIMBR to model the relationship: Accessibility → TF Binding → Gene Expression. This helps prioritize direct regulatory targets.
Visual Workflow and Logical Diagrams
Title: Workflow for Integrating ChIP-seq, ATAC-seq, and RNA-seq Data
Title: Logical Model of Chromatin Accessibility Enabling TF Binding and Expression
The Scientist's Toolkit: Essential Research Reagents & Materials
Table 2: Key Reagent Solutions for Integrative Multi-omics Studies
| Item | Function & Role in Integration | Example Product/Catalog |
|---|---|---|
| UltraPure BSA | Critical for blocking in ChIP; reduces background noise for cleaner, more specific peaks. | Thermo Fisher, AM2616 |
| Validated ChIP-grade Antibody | Specificity is paramount. Defines the target of the ChIP-seq experiment (TF or histone mark). | CST (e.g., #12345 for H3K27ac) |
| Tn5 Transposase (Tagmentase) | Engineered enzyme for simultaneous fragmentation and tagging in ATAC-seq. | Illumina (20034197) |
| Dynabeads Protein A/G | Magnetic beads for efficient immunoprecipitation in ChIP-seq. | Thermo Fisher, 10002D/10004D |
| RNase Inhibitor | Protects RNA during RNA-seq library prep from matched samples. | Takara, 2313A |
| Dual Indexing Kits (Unique) | Enables multiplexing of libraries from the same sample across all three assays, reducing batch effects. | Illumina, IDT for Illumina |
| NEBNext Ultra II FS DNA Lib Kit | High-efficiency library prep for low-input ChIP and ATAC DNA. | NEB, E7805 |
| RiboCop rRNA Depletion Kit | For RNA-seq; better for low-quality samples than poly-A selection. | Lexogen, 108.2 |
| Crosslinking Reversal Buffer | Standardized buffer for post-IP elution, crucial for ChIP DNA yield. | Part of ChIP kits (e.g., Active Motif) |
| AMPure XP Beads | Size selection and clean-up for all library types; ensures optimal fragment distribution. | Beckman Coulter, A63881 |
Application Notes: Integrating ChIP-seq Data into Public Repositories
This protocol is designed for researchers generating ChIP-seq data for genome-wide transcription factor or histone modification mapping, as part of a thesis on ChIP-seq methodology. The focus is on preparing data for submission to public repositories in compliance with ENCODE guidelines and GEO requirements, ensuring reproducibility and utility for the scientific community.
Key Public Data Standards and Quantitative Requirements
Table 1: Core Metadata Requirements for ChIP-seq Submission
| Metadata Category | ENCODE 4 (v1.0) Minimum | GEO (SRA) Minimum | Synopsis for Drug Development Context |
|---|---|---|---|
| Biological Replicate | Minimum n=2 | Minimum n=1 | Essential for statistical rigor in identifying targetable binding sites. |
| Sequencing Depth | 20-50 million reads (TF); 45-60 million (Histones) | As per experiment | Depth correlates with sensitivity for low-occupancy, therapeutically relevant sites. |
| Control Experiment | Required (Input DNA or IgG) | Strongly Recommended | Critical for distinguishing signal from noise in differential binding analysis. |
| Read Length & Type | ≥ 50bp, Paired-end preferred | Single-end accepted | Longer reads improve mapping in repetitive regions relevant to gene regulation. |
| Alignment Metrics | Report % uniquely mapped, PCR duplicate rate | Provide final processed files | High mapping rates ensure confident peak calling for downstream validation. |
Table 2: Recommended File Formats and Content
| Data Type | ENCODE Format | GEO Acceptable Format | Purpose |
|---|---|---|---|
| Raw Data | FASTQ (gzip) | FASTQ, SRA | Archival of primary sequencing reads. |
| Aligned Data | BAM (coordinate-sorted, indexed) | BAM, BED | For visualization and re-analysis. |
| Peak Calls | BED, narrowPeak/broadPeak (for TFs/Histones) | BED, GFF | Identified binding sites/signal regions. |
| Processed Signal | bigWig (coverage tracks) | bigWig, wig | For genome browser visualization and comparison. |
| Metadata | JSON, TSV | SOFT or MINiML formatted spreadsheet | Machine-readable experimental description. |
Detailed Protocol: From Wet-Lab to Repository Submission
Part A: Pre-Sequencing Experimental Protocol & Metadata Recording
Objective: Generate ChIP-seq libraries from cells/tissue with comprehensive metadata capture.
Materials & Reagents:
- Crosslinked Chromatin: Sample prepared with 1% formaldehyde for 10 min, quenched with glycine.
- Antibody: Validated ChIP-grade antibody (note catalog #, lot #, host species).
- Magnetic Beads: Protein A/G beads for immunoprecipitation.
- Library Prep Kit: High-fidelity library preparation kit (e.g., Illumina TruSeq).
- Quality Control Instruments: Bioanalyzer (Agilent) or TapeStation for library fragment size analysis; qPCR for library quantification.
Procedure:
- Chromatin Immunoprecipitation:
- Sonicate crosslinked chromatin to 200-500 bp fragments. Verify size on agarose gel.
- Incubate 1-10 µg chromatin with 1-5 µg antibody overnight at 4°C with rotation.
- Add 50 µL washed Protein A/G magnetic beads, incubate 2 hours.
- Wash beads sequentially with: Low Salt Wash Buffer (1x), High Salt Wash Buffer (1x), LiCl Wash Buffer (1x), and TE Buffer (2x).
- Elute complex with 200 µL Elution Buffer (1% SDS, 0.1M NaHCO3) at 65°C for 15 min with shaking. Reverse crosslinks overnight at 65°C.
- Library Preparation:
- Purify DNA using SPRI beads.
- Perform end-repair, A-tailing, and adapter ligation per kit instructions.
- Size-select adapter-ligated DNA (target ~300-400 bp insert).
- Amplify library with 8-12 cycles of PCR using indexed primers.
- Quantify final library by qPCR and assess size profile using Bioanalyzer.
Part B: Post-Sequencing Data Processing & Curation for Submission
Objective: Process raw sequencing reads to generate submission-ready files.
Protocol:
- Demultiplexing & FASTQ Generation:
- Use
bcl2fastq(Illumina) or vendor software. Record any sample index hopping rate.
- Use
- Quality Control:
- Run
FastQCon raw FASTQs. Note per-base sequence quality, adapter contamination.
- Run
- Alignment:
- Align reads to appropriate reference genome (e.g., GRCh38, mm10) using
Bowtie2orBWA. Command example:bowtie2 -p 8 -x genome_index -U sample.fastq.gz -S sample.sam. - Convert SAM to sorted, indexed BAM:
samtools sort -o sample.bam sample.sam && samtools index sample.bam.
- Align reads to appropriate reference genome (e.g., GRCh38, mm10) using
- Post-Alignment Processing:
- Mark PCR duplicates using
picard MarkDuplicatesorsambamba. - Calculate alignment statistics: % mapped, % duplicates.
- Mark PCR duplicates using
- Peak Calling & Signal Track Generation:
- For Transcription Factors: Use
MACS2for narrow peaks:macs2 callpeak -t treatment.bam -c control.bam -f BAM -g hs -n output --outdir peaks. - For Histone Marks: Use
MACS2in broad peak mode. - Generate normalized genome coverage tracks (bigWig) using
deepTools bamCoverage:bamCoverage -b sample.bam -o sample.bw --normalizeUsing RPKM --binSize 10.
- For Transcription Factors: Use
Part C: Metadata Assembly and Submission to GEO per ENCODE Guidelines
Objective: Package data and metadata for submission to the Gene Expression Omnibus (GEO).
Protocol:
- Organize Submission Directory:
- Create folders:
/FASTQ,/BAM,/Peaks,/Processed_signal. - Place all final files in respective folders.
- Create folders:
- Prepare Metadata Spreadsheet:
- Download GEO template (
GEOmetadb). - Fill mandatory fields:
sample_title,organism,characteristics(cell line, treatment, antibody target),molecule,library_selection,instrument_model,data_processing(pipeline steps and software versions).
- Download GEO template (
- Validate against ENCODE Guidelines:
- Cross-check metadata against current ENCODE
data standardsdocument. - Ensure biological replicate and control information is explicitly defined.
- Cross-check metadata against current ENCODE
- Upload to GEO:
- Compress data files (
tar.gz). - Upload via
FileZillato GEO's secure server (ftp-private.ncbi.nlm.nih.gov). - Email the metadata spreadsheet to GEO (geo@ncbi.nlm.nih.gov) to link to uploaded files.
- Compress data files (
Diagrams
ChIP-seq to GEO Submission Workflow
ENCODE and GEO Standards Relationship
The Scientist's Toolkit: Research Reagent Solutions
Table 3: Essential Materials for Compliant ChIP-seq Studies
| Item | Example Product/Catalog | Function in Protocol & Submission Context |
|---|---|---|
| Validated ChIP Antibody | CST #1234 (Anti-H3K27ac); Abcam ab177178 (Anti-STAT3) | Primary reagent for target enrichment. Must report vendor, lot number, and RRID if available in metadata. |
| Magnetic Beads (Protein A/G) | Dynabeads Protein A (10002D) | Facilitate antibody-antigen complex pulldown. Bead type must be noted. |
| Crosslinking Reagent | Ultrapure Formaldehyde (16% methanol-free) | Fixes protein-DNA interactions. Concentration and incubation time are critical metadata. |
| Library Prep Kit | Illumina TruSeq ChIP Library Prep Kit | Standardizes fragment end-prep and adapter ligation. Kit version must be documented. |
| Size Selection Beads | SPRIselect Beads (Beckman Coulter B23318) | Clean up DNA and select insert size. Affects final library profile. |
| DNA QC Instrument | Agilent 2100 Bioanalyzer with High Sensitivity DNA Kit | Provides electropherogram of library fragment distribution. Upload QC report to GEO. |
| qPCR Quantification Kit | KAPA Library Quantification Kit (KK4824) | Accurately quantifies amplifiable library for pooling. Method used for quantification is metadata. |
| Reference Genome & Annotations | GENCODE v44 (GRCh38.p14) | Standardized reference for alignment and annotation. Version is a mandatory submission field. |
Conclusion
ChIP-seq remains a cornerstone technology for decoding the genomic landscape of protein-DNA interactions, from fundamental biology to drug target discovery. Mastering its workflow—from robust experimental design and optimized wet-lab protocols to rigorous bioinformatic analysis and validation—is critical for generating reliable, publication-quality data. As the field evolves, the integration of ChIP-seq with emerging low-input and single-cell techniques, alongside complementary epigenomic assays like ATAC-seq, will provide unprecedented resolution of regulatory networks. For biomedical and clinical research, this enables the precise mapping of disease-associated regulatory variants, transcription factor dependencies in cancer, and the mechanistic evaluation of epigenetic therapies, paving the way for novel diagnostic and therapeutic strategies.