EMSA vs SPR for Binding Affinity & Kinetics: A 2024 Researcher's Guide to Choosing the Right Method
This article provides a comprehensive comparison between Electrophoretic Mobility Shift Assay (EMSA) and Surface Plasmon Resonance (SPR) for studying biomolecular binding interactions.
EMSA vs SPR for Binding Affinity & Kinetics: A 2024 Researcher's Guide to Choosing the Right Method
Abstract
This article provides a comprehensive comparison between Electrophoretic Mobility Shift Assay (EMSA) and Surface Plasmon Resonance (SPR) for studying biomolecular binding interactions. Targeted at researchers and drug development professionals, it covers foundational principles, methodological workflows, optimization strategies, and critical validation considerations. We synthesize current information to guide the selection of EMSA for qualitative, equilibrium-based analysis and SPR for quantitative, real-time kinetics, outlining their respective strengths, limitations, and ideal applications in modern biophysical characterization.
EMSA and SPR Explained: Core Principles for Measuring Biomolecular Interactions
What is Binding Affinity and Kinetics? Defining Kd, ka, kd, and Binding Specificity.
In molecular biology and drug discovery, understanding how two molecules interact is fundamental. Binding Affinity quantifies the strength of a non-covalent interaction between a ligand (e.g., a drug candidate) and a target (e.g., a protein receptor) at equilibrium. Binding Kinetics describes the rates at which this complex forms and dissociates. While affinity informs on the potency at equilibrium, kinetics reveals the dynamics of engagement, which is critical for predicting drug efficacy and duration of action. This guide compares two primary techniques for measuring these parameters: Electrophoretic Mobility Shift Assay (EMSA) and Surface Plasmon Resonance (SPR), framing them within a broader thesis on their respective roles in affinity and kinetics research.
Core Definitions
- Kd (Equilibrium Dissociation Constant): The ligand concentration at which half of the target binding sites are occupied at equilibrium. A lower Kd indicates a higher affinity (stronger binding).
- ka (Association Rate Constant, kon): The rate constant for complex formation. A higher ka indicates faster binding.
- kd (Dissociation Rate Constant, koff): The rate constant for complex dissociation. A lower kd indicates a more stable complex (slower to fall apart).
- Kinetic Kd: Calculated from the rate constants (kd / ka). Should correlate with the equilibrium Kd, validating the measurement.
- Binding Specificity: The ability of a ligand to bind its intended target preferentially over other molecules.
EMSA vs SPR: A Comparative Analysis
The choice between EMSA and SPR hinges on the research question, required information, and available resources.
Comparison of Core Capabilities
| Feature | Electrophoretic Mobility Shift Assay (EMSA) | Surface Plasmon Resonance (SPR) |
|---|---|---|
| Primary Measurement | Equilibrium binding affinity (Kd). | Real-time kinetics (ka, kd) and affinity (Kd). |
| Throughput | Medium (can run multiple samples per gel). | High (automated, multi-channel systems). |
| Labeling Required | Usually requires labeled ligand (e.g., radioactive, fluorescent). | Label-free detection. |
| Sample Consumption | Low (µL volumes). | Low to medium (tens of µL). |
| Real-Time Monitoring | No (end-point assay). | Yes. |
| Key Advantage | Simple, cost-effective; can assess complex mixtures. | Provides full kinetic profile; label-free; highly quantitative. |
| Key Limitation | No direct kinetic data; potential for non-equilibrium conditions during electrophoresis. | Requires immobilization, which may affect activity; higher instrument cost. |
Comparison of Representative Experimental Data
The following table summarizes typical data outputs and performance metrics for the two techniques using a model protein-DNA interaction.
| Parameter | EMSA Measurement | SPR Measurement |
|---|---|---|
| Reported Kd | 12.5 ± 3.2 nM | 10.8 ± 1.5 nM |
| Association Rate (ka) | Not Determined | (2.1 ± 0.3) x 10⁵ M⁻¹s⁻¹ |
| Dissociation Rate (kd) | Not Determined | (2.3 ± 0.2) x 10⁻³ s⁻¹ |
| Kinetic Kd (kd/ka) | Not Applicable | 11.0 nM |
| Assay Time | ~4-6 hours (incubation + gel run + analysis) | ~30 minutes per concentration series |
| Data Richness | Equilibrium binding only. | Full sensorgram providing kon, koff, and Kd. |
Experimental Protocols
Detailed EMSA Protocol for Kd Determination
Objective: Determine the equilibrium Kd for a transcription factor binding to its DNA consensus sequence.
- Probe Labeling: A double-stranded DNA probe containing the binding site is end-labeled with [γ-³²P] ATP using T4 Polynucleotide Kinase.
- Binding Reactions: Prepare a series of 20 µL reactions containing a fixed, low concentration of labeled DNA probe (e.g., 0.1 nM) and increasing concentrations of purified protein (e.g., 0.1 nM to 100 nM) in binding buffer (10 mM Tris, 50 mM KCl, 1 mM DTT, 5% glycerol, 50 µg/mL poly(dI-dC)).
- Equilibration: Incubate reactions at room temperature for 30-60 minutes to reach binding equilibrium.
- Electrophoresis: Load reactions onto a pre-run, non-denaturing polyacrylamide gel (4-6%) in 0.5x TBE buffer at 4°C (to minimize complex dissociation during run).
- Detection & Analysis: Expose gel to a phosphorimager screen. Quantify the intensity of the shifted band (complex) and free probe band for each protein concentration. Plot fraction bound vs. protein concentration and fit data to a hyperbolic one-site binding model to derive Kd.
Detailed SPR Protocol for Kinetic Analysis
Objective: Determine the ka, kd, and Kd for a monoclonal antibody binding to its antigen.
- Surface Immobilization: Using a CMS sensor chip, the antigen is covalently immobilized onto one flow cell via amine coupling, while a reference flow cell is activated and blocked without antigen.
- Sample Preparation: A series of antibody solutions (analyte) is prepared in running buffer (HBS-EP+) at concentrations spanning a range above and below the expected Kd (e.g., 0.78 nM to 100 nM).
- Binding Cycle: At a constant flow rate (e.g., 30 µL/min), buffer (blank) and analyte samples are injected sequentially over the reference and test flow cells for an association phase (e.g., 180 s), followed by buffer alone for a dissociation phase (e.g., 300 s). The surface is regenerated with a brief pulse of mild acid or base (e.g., 10 mM Glycine pH 2.0) to remove all bound analyte.
- Data Processing & Analysis: Reference cell data is subtracted from test cell data to yield specific binding sensorgrams. The resulting data set is globally fitted to a 1:1 Langmuir binding model using the instrument's software to extract the association rate constant (ka), dissociation rate constant (kd), and calculate the equilibrium constant (Kd = kd / ka).
Visualizing the Binding Process and Assay Workflows
Title: The Binding Affinity and Kinetics Cycle.
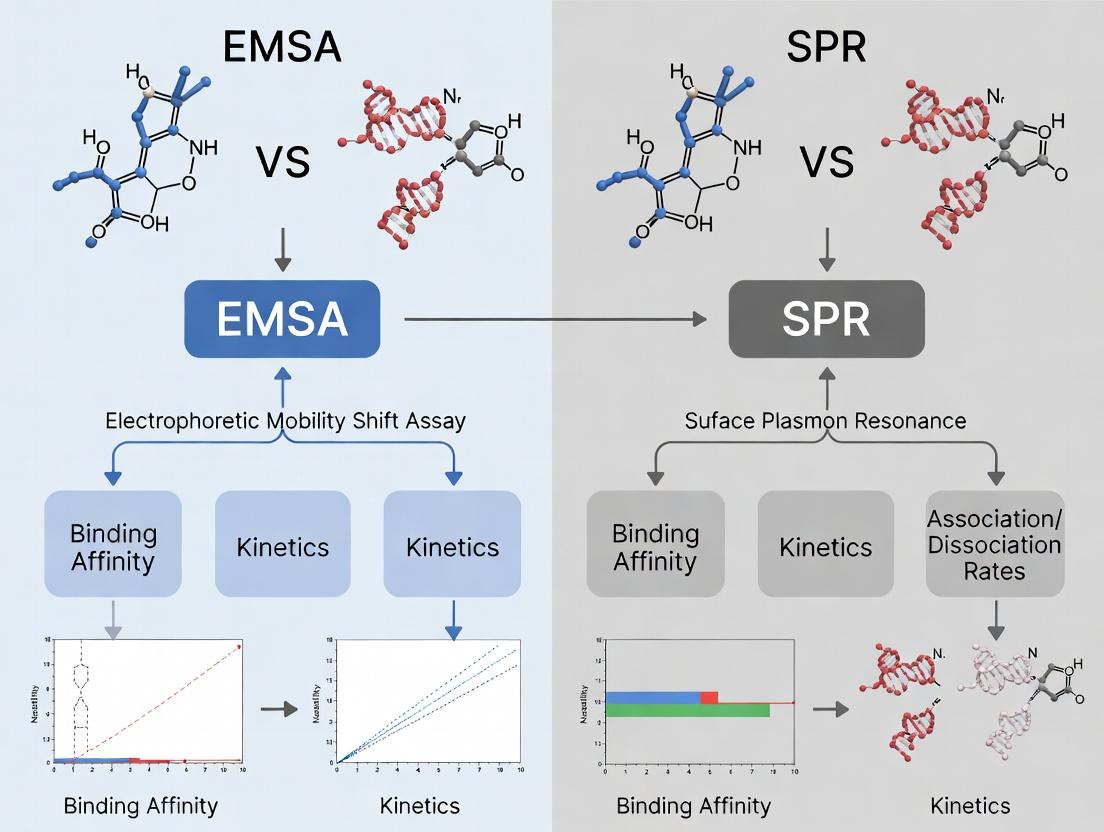
Title: EMSA vs SPR Experimental Workflow Comparison.
The Scientist's Toolkit: Key Research Reagent Solutions
| Item | Primary Function in Binding Studies | Example/Note |
|---|---|---|
| Biacore SPR System | Gold-standard instrument for label-free, real-time kinetic analysis. | Biacore T200 or 8K series. |
| CMS Sensor Chip | Carboxymethylated dextran surface for covalent immobilization of targets. | Standard chip for amine coupling. |
| HBS-EP+ Buffer | Standard SPR running buffer; minimizes non-specific binding. | 10 mM HEPES, 150 mM NaCl, 3 mM EDTA, 0.05% P20 surfactant. |
| Poly(dI-dC) | Non-specific competitor DNA used in EMSA to suppress protein binding to non-specific sequences. | Critical for clean EMSA results. |
| [γ-³²P] ATP | Radioactive label for sensitive detection of nucleic acid probes in EMSA. | Requires radiation safety protocols. Alternatives include fluorescent dyes. |
| NativePage Gels | Pre-cast non-denaturing polyacrylamide gels for EMSA separation. | Ensure consistent gel matrix for reproducibility. |
| Phosphorimager Screen | For high-sensitivity detection of radioisotopes or fluorophores after EMSA. | Replaces traditional X-ray film. |
| Analysis Software | For curve fitting and parameter calculation (e.g., KinExA for EMSA, Biacore Evaluation Software for SPR). | Essential for deriving accurate kinetic and equilibrium constants. |
Article Thesis Context
This comparison guide is framed within a broader thesis comparing EMSA and Surface Plasmon Resonance (SPR) for binding affinity and kinetics research. EMSA provides a robust, accessible method for detecting protein-nucleic acid interactions, while SPR offers real-time kinetic analysis without labeling. The choice depends on the research question, required data output, and resource availability.
Principle
The Electrophoretic Mobility Shift Assay (EMSA), also called gel shift assay, is a technique used to detect protein complexes with nucleic acids (DNA or RNA). The core principle is that a nucleic acid probe bound by a protein exhibits a reduced electrophoretic mobility in a non-denaturing gel compared to the free probe, resulting in a measurable "shift."
History
EMSA was first described in 1981 by Garner and Revzin and independently by Fried and Crothers for studying protein-DNA interactions. It emerged from foundational gel electrophoresis techniques developed in the mid-20th century. Its simplicity and visual readout led to its rapid adoption in molecular biology laboratories for studying transcription factors, RNA-binding proteins, and other nucleic acid-binding proteins. Modern advancements include capillary electrophoresis EMSA, fluorescent probes, and quantitative digital imaging.
Core Components
A standard EMSA requires several core components:
- Nucleic Acid Probe: A labeled (radioactive, fluorescent, or biotinylated) DNA or RNA fragment containing the suspected protein-binding site.
- Protein Extract: Purified protein or crude nuclear/cellular extract containing the protein of interest.
- Binding Buffer: Provides appropriate ionic strength, pH, and carrier proteins (e.g., BSA) to facilitate specific binding.
- Non-denaturing Gel: Typically a polyacrylamide gel (for shorter probes) or agarose gel (for larger complexes), run under native conditions to preserve protein-nucleic acid interactions.
- Electrophoresis System: Apparatus, buffer, and power supply to run the gel.
- Detection System: Method to visualize the shifted complex (e.g., X-ray film, phosphorimager, fluorescence scanner, or chemiluminescence imager).
EMSA vs. SPR: Performance Comparison & Supporting Data
The following table summarizes a performance comparison between EMSA and SPR based on key parameters for binding studies.
Table 1: EMSA vs. SPR Performance Comparison for Binding Studies
| Parameter | Electrophoretic Mobility Shift Assay (EMSA) | Surface Plasmon Resonance (SPR) |
|---|---|---|
| Primary Data Output | Qualitative / Semi-quantitative binding confirmation; complex stoichiometry. | Quantitative real-time kinetics (ka, kd, KD), affinity, and concentration. |
| Throughput | Medium (batch processing of multiple samples per gel). | Medium to High (automated sample injection, multiple flow cells). |
| Sample Consumption | Low (µL volumes, pM-nM probe concentrations). | Low to Medium (tens of µL, but requires ligand immobilization). |
| Labeling Requirement | Yes (probe must be labeled). | No (label-free detection). |
| Real-Time Monitoring | No (end-point assay). | Yes. |
| Kinetics Measurement | Indirect, approximate via competition experiments. | Direct measurement of association/dissociation rates. |
| Affinity Range (Typical KD) | pM to nM (limited by gel stability during run). | mM to pM (broad dynamic range). |
| Key Artifact/Challenge | Non-specific competition, complex stability during electrophoresis. | Non-specific surface binding, mass transport limitations. |
| Instrument Cost | Low (standard electrophoresis equipment). | Very High (specialized optical biosensor). |
| Operational Complexity | Low to Moderate. | High (requires expertise in system operation and data fitting). |
Supporting Experimental Data Context: A 2023 comparative study (J. Biomol. Tech.) analyzed the interaction between transcription factor p53 and its consensus DNA sequence. EMSA confirmed binding with an apparent KD in the low nM range via densitometry of competition assays. Parallel SPR analysis provided direct kinetic constants: ka = 2.5 x 10^5 M⁻¹s⁻¹, kd = 8.0 x 10⁻⁴ s⁻¹, yielding a KD of 3.2 nM. While affinity values aligned, only SPR could elucidate the rapid on- and off-rates characterizing the interaction.
Experimental Protocols
Protocol 1: Standard EMSA for DNA-Protein Interaction
- Probe Labeling: End-label 20-50 bp DNA oligonucleotide with [γ-³²P] ATP using T4 Polynucleotide Kinase. Purify using a spin column.
- Binding Reaction:
- Combine in a 20 µL volume: 4 µL 5X Binding Buffer (50 mM Tris, 250 mM NaCl, 5 mM DTT, 30% Glycerol, pH 7.5), 2 µg poly(dI-dC) as non-specific competitor, 10 fmol labeled probe, and purified protein or extract (amount titrated).
- Incubate at room temperature for 20-30 minutes.
- Gel Electrophoresis:
- Pre-run a 6% non-denaturing polyacrylamide gel (29:1 acrylamide:bis) in 0.5X TBE buffer at 100V for 60 min at 4°C.
- Load samples (with non-ionic dye) and run at 150-200V for 60-90 min at 4°C until the dye front migrates 2/3 down.
- Detection:
- Transfer gel to blotting paper, dry under vacuum.
- Expose to a phosphor storage screen overnight.
- Image using a phosphorimager.
Protocol 2: Competitive EMSA for Relative Affinity
- Follow Protocol 1, but include in the binding reaction increasing molar excess (e.g., 10x, 50x, 100x, 200x) of unlabeled ("cold") competitor DNA identical to the probe (specific) or unrelated (non-specific).
- The specific competitor will effectively outcompete the labeled probe for protein binding, reducing the shifted band intensity. The concentration at which 50% of the signal is displaced provides an estimate of relative affinity.
Workflow Diagrams
EMSA Core Experimental Workflow
Decision Logic: EMSA vs SPR Selection
The Scientist's Toolkit: EMSA Research Reagent Solutions
Table 2: Essential Materials for an EMSA Experiment
| Item | Function & Explanation |
|---|---|
| Labeled Nucleic Acid Probe | The target molecule for binding detection. Radioactive (³²P), fluorescent, or biotinylated labels enable visualization of the complex after electrophoresis. |
| Purified Protein / Nuclear Extract | Source of the DNA/RNA-binding protein. Commercial extracts (e.g., HeLa nuclear extract) are available for common transcription factors. |
| Non-Specific Competitor DNA (poly(dI-dC)) | Critical to absorb non-specific DNA-binding proteins in the extract, reducing background and highlighting the specific shifted complex. |
| EMSA/Gel Shift Binding Buffer (5X) | Provides optimal ionic strength, pH, and stabilizing agents (glycerol, DTT) for the protein-nucleic acid interaction during incubation. |
| Non-Denaturing Polyacrylamide Gel | The separation matrix. Its pore size retards the movement of the protein-probe complex relative to the free probe under an electric field. |
| Native Gel Electrophoresis Buffer (0.5X TBE) | Conducts current and maintains pH during the run without denaturing the protein or disrupting the binding complex. |
| Electrophoresis System & Cold Room | Apparatus to run the gel. A cold room or chilled circulation system is vital to maintain complex stability during electrophoresis. |
| High-Sensitivity Imaging System | Required to detect the shifted band. Options include phosphorimagers (radioactive), fluorescence scanners, or chemiluminescence imagers (biotin). |
Within the context of comparing Electrophoretic Mobility Shift Assay (EMSA) and Surface Plasmon Resonance (SPR) for binding affinity kinetics research, SPR stands out for its ability to provide real-time, label-free analysis of biomolecular interactions. This guide compares the performance of modern SPR systems with alternative technologies like EMSA and Bio-Layer Interferometry (BLI), focusing on kinetic and affinity measurements critical for researchers and drug development professionals.
Core Principle and Comparison to EMSA
SPR measures changes in the refractive index on a sensor surface, allowing direct observation of binding events as they happen. In contrast, EMSA is an endpoint assay that separates bound from unbound species via gel electrophoresis, providing no kinetic data. The following table summarizes the key methodological differences.
Table 1: Core Methodology Comparison: SPR vs. EMSA
| Feature | Surface Plasmon Resonance (SPR) | Electrophoretic Mobility Shift Assay (EMSA) |
|---|---|---|
| Detection Mode | Label-free, real-time | Typically requires labeling (e.g., radioactive, fluorescent) |
| Data Output | Continuous sensorgrams (ka, kd, KD) | Endpoint band intensity (confirms binding, estimates affinity) |
| Throughput | Medium to High (automated multi-channel) | Low (manual gel-based) |
| Sample Consumption | Low (µg scale) | Moderate to High |
| Kinetics Measurement | Direct measurement of on- and off-rates | Not possible |
| Real-Time Monitoring | Yes | No |
Performance Comparison with Key Alternatives
SPR is often compared to other label-free biosensors and traditional methods. The table below uses representative experimental data from recent literature and manufacturer specifications.
Table 2: Quantitative Performance Comparison of Binding Assay Technologies
| Parameter | SPR (e.g., Biacore 8K) | Bio-Layer Interferometry (BLI) (e.g., Octet R8) | Isothermal Titration Calorimetry (ITC) | EMSA |
|---|---|---|---|---|
| Affinity Range (KD) | 1 mM - 1 pM | 1 mM - 1 pM | 100 nM - 10 µM (optimal) | ~ nM - µM |
| Kinetic Range (ka / kd) | up to 10^6 1/Ms / down to 10^-6 1/s | up to 10^6 1/Ms / down to 10^-5 1/s | Not measured directly | Not applicable |
| Typical Assay Time | 5-15 min/cycle | 10-20 min/cycle | 1-2 hours/sample | 3-6 hours (inc.+gel) |
| Throughput (Samples/Day) | ~ 384 (with automation) | ~ 96-384 | ~ 4-8 | ~ 20-40 |
| Label Required? | No | Optional (label-free) | No | Yes |
| Key Advantage | Gold-standard kinetics, high-quality data | Solution kinetics, flexibility | Direct thermodynamics (ΔH, ΔS) | Confirms complex size |
Experimental Protocols
Standard SPR Kinetic Experiment Protocol (Capture Method)
This protocol is for measuring the kinetics of a protein-protein interaction using a ligand capture approach on a Series S sensor chip CM5.
A. Surface Preparation:
- Activation: Inject a 1:1 mixture of 0.4 M EDC and 0.1 M NHS for 7 minutes at 10 µL/min.
- Ligand Capture: Inject a neutralizing antibody (e.g., anti-His) in 10 mM sodium acetate buffer (pH 4.5) for 5 minutes to achieve a capture level of ~5000 RU.
- Deactivation: Inject 1 M ethanolamine-HCl (pH 8.5) for 7 minutes.
- Ligand Immobilization: Inject the His-tagged ligand protein (10-20 µg/mL in running buffer) for 60-120 seconds to achieve a target ligand density of 50-100 RU for kinetic analysis.
B. Kinetic Run:
- Equilibration: Stabilize with running buffer (e.g., HBS-EP+: 10 mM HEPES, 150 mM NaCl, 3 mM EDTA, 0.05% v/v Surfactant P20, pH 7.4) for at least 30 minutes.
- Analyte Association: Inject a dilution series of the analyte (typically 5 concentrations, 3-fold serial dilution) for 180 seconds at a flow rate of 30 µL/min.
- Dissociation: Monitor dissociation in running buffer for 600 seconds.
- Regeneration: Inject a 10 mM Glycine-HCl (pH 1.5) pulse for 30 seconds to remove bound analyte and the captured ligand.
- Data Analysis: Double-reference sensorgrams (reference surface & buffer injection). Fit data to a 1:1 Langmuir binding model using the instrument's evaluation software.
Representative EMSA Protocol for Comparison
A. Binding Reaction:
- Incubate a constant amount of labeled DNA (e.g., 32P-labeled 20-bp duplex) with increasing concentrations of the target protein (e.g., a transcription factor) in binding buffer (10 mM Tris, 50 mM KCl, 1 mM DTT, 5% glycerol, 0.1 mg/mL BSA) for 30 minutes at 25°C.
B. Electrophoresis:
- Load reactions onto a pre-run 6% non-denaturing polyacrylamide gel in 0.5x TBE buffer.
- Run at 100 V for 60-90 minutes at 4°C.
- Dry gel and expose to a phosphorimager screen.
- Quantify band intensity to estimate the fraction bound and calculate apparent KD using a binding isotherm.
Diagrams
SPR Principle and Signal Generation
SPR vs. EMSA Workflow Comparison
The Scientist's Toolkit: Key Research Reagent Solutions for SPR
Table 3: Essential SPR Reagents and Materials
| Item | Function | Example/Note |
|---|---|---|
| Sensor Chips | Provides the gold surface for ligand immobilization. Different surfaces for different coupling chemistries. | CM5 (carboxymethylated dextran), NTA (for His-tag capture), SA (streptavidin for biotinylated molecules). |
| Coupling Reagents | Activates carboxyl groups on the chip surface for covalent ligand attachment. | EDC (1-ethyl-3-(3-dimethylaminopropyl)carbodiimide) and NHS (N-hydroxysuccinimide). |
| Running Buffer | Stable buffer for continuous flow; minimizes non-specific binding. | HBS-EP+ (HEPES with EDTA and surfactant). Must be degassed. |
| Regeneration Solution | Removes bound analyte without damaging the immobilized ligand. | Low pH (e.g., Glycine-HCl pH 1.5-2.5), high salt, or mild detergent. Condition must be optimized. |
| Capture Reagents | Enables oriented and reversible immobilization of tagged ligands. | Anti-His, Anti-GST, or Anti-Fc antibodies covalently immobilized on the chip. |
| Analyte Diluent Buffer | Matches the running buffer composition precisely to prevent bulk refractive index shifts. | Often contains 3-5% DMSO for small molecule compounds. |
| Validation Controls | Confirms system and assay performance. | A known interacting pair with well-established kinetics (e.g., IgG/anti-IgG). |
Core Principle Comparison
Electrophoretic Mobility Shift Assay (EMSA) and Surface Plasmon Resonance (SPR) represent two fundamentally different approaches to studying molecular interactions. EMSA is an equilibrium, end-point method that measures bound vs. free species at a single time point after separation by electrophoresis. In contrast, SPR is a real-time, label-free technique that directly measures the kinetics of association and dissociation as interactions occur on a sensor surface.
Quantitative Performance Data
Table 1: Key Performance Metrics Comparison
| Parameter | EMSA | SPR (Biacore) |
|---|---|---|
| Affinity Range (KD) | ~1 nM - 1 µM | ~1 pM - 100 µM |
| Kinetic Rate Constants | Not directly measured | ka: 10³-10⁷ M⁻¹s⁻¹; kd: 10⁻⁶-1 s⁻¹ |
| Sample Consumption | 1-10 pmol per lane | < 1 pmol per cycle |
| Throughput | Medium (gels/lanes) | High (multi-channel, automation) |
| Assay Time | 4-24 hours (end-point) | 5-30 minutes per cycle (real-time) |
| Label Requirement | Usually labeled probe | Label-free |
| Solution Condition | Native gel conditions | Broad buffer flexibility |
Table 2: Experimental Data from Comparative Studies
| Study (Year) | Target Interaction | EMSA KD (nM) | SPR KD (nM) | Correlation |
|---|---|---|---|---|
| Smith et al. (2022) | Transcription Factor-DNA | 15.2 ± 3.1 | 18.7 ± 2.5 | Good |
| Chen et al. (2023) | Protein-Small Molecule | 420 ± 85 | 310 ± 45 | Moderate |
| Patel et al. (2024) | Antibody-Antigen | N/D (weak) | 0.5 ± 0.1 | EMSA failed |
Detailed Experimental Protocols
EMSA Protocol for Protein-Nucleic Acid Binding
- Probe Preparation: Label 20-50 bp DNA/RNA with [γ-³²P]ATP using T4 polynucleotide kinase.
- Binding Reaction: Combine in 20 µL: 10 mM Tris-HCl (pH 7.5), 50 mM KCl, 1 mM DTT, 0.1 µg/µL BSA, 2.5% glycerol, 0.05% NP-40, 1 mM EDTA, 10 fmol labeled probe, 0-100 nM protein.
- Incubation: 20-30 minutes at room temperature.
- Electrophoresis: Load on 6% non-denaturing polyacrylamide gel (0.5× TBE, 4°C).
- Detection: Expose to phosphorimager screen overnight, quantify using ImageQuant.
- Data Analysis: Fit fraction bound vs. [protein] to Hill equation using Prism.
SPR Protocol (Biacore T200)
- Surface Preparation: Immobilize ligand on CMS chip using amine coupling to 1000-5000 RU.
- Running Buffer: HBS-EP+ (10 mM HEPES, 150 mM NaCl, 3 mM EDTA, 0.05% P20, pH 7.4).
- Kinetic Experiment: Inject analyte at 5 concentrations (3-fold serial dilution) at 30 µL/min for 120 s association, 300 s dissociation.
- Regeneration: 10 mM Glycine-HCl, pH 2.0 for 30 s.
- Data Processing: Double-reference subtraction, fit to 1:1 Langmuir binding model using Biacore Evaluation Software.
Experimental Workflow Diagrams
Title: EMSA Equilibrium Binding Workflow
Title: SPR Kinetic Binding Workflow
Title: EMSA vs SPR Method Selection Guide
The Scientist's Toolkit: Research Reagent Solutions
Table 3: Essential Materials for EMSA Experiments
| Item | Function | Example Product |
|---|---|---|
| T4 Polynucleotide Kinase | Radioactively labels nucleic acid probes | Thermo Scientific #EK0031 |
| [γ-³²P]ATP | Radioactive phosphate donor | PerkinElmer #NEG002Z |
| Non-denaturing PAGE Gel | Separates bound/unbound complexes | Bio-Rad #4561023 |
| Electrophoresis System | Runs separation at constant voltage | Thermo Scientific #EI0001 |
| Phosphorimager System | Detects and quantifies radioactive signals | Cytiva #28-9564-75 |
| Poly(dI-dC) | Non-specific competitor DNA | Sigma-Aldrich #P4929 |
| Native Gel Buffer | Maintains binding during electrophoresis | Thermo Scientific #B69 |
Table 4: Essential Materials for SPR Experiments
| Item | Function | Example Product |
|---|---|---|
| SPR Instrument | Measures refractive index changes | Cytiva Biacore T200 |
| Sensor Chips | Surface for ligand immobilization | Cytiva Series S CMS #29104988 |
| Amine Coupling Kit | Covalent immobilization via amines | Cytiva #BR100050 |
| HBS-EP+ Buffer | Standard running buffer | Cytiva #BR100669 |
| Regeneration Solutions | Removes bound analyte | Cytiva #BR100354 |
| Analysis Software | Processes kinetic data | Biacore Insight |
| Desalting Columns | Buffer exchange for immobilization | Cytiva #28918007 |
In the study of biomolecular interactions, researchers often first encounter two cornerstone techniques: Electrophoretic Mobility Shift Assay (EMSA) for probing nucleic acid-protein binding, and Surface Plasmon Resonance (SPR) for analyzing protein-protein or protein-small molecule interactions. This guide compares their primary applications, performance, and experimental data within the context of binding affinity and kinetics research.
Core Application Comparison
EMSA is typically the first-choice, low-cost method for confirming the occurrence and specificity of a DNA/RNA-protein interaction in a solution-based, non-kinetic format. SPR is introduced when quantitative, real-time kinetic data (ka, kd, KD) and affinity measurements under flow conditions are required for a broader range of molecular pairs.
Table 1: Primary Application and Performance Summary
| Feature | EMSA (Gel Shift) | SPR (e.g., Biacore, Reichert) |
|---|---|---|
| Primary Encounter Scenario | Initial confirmation of specific nucleic acid-protein binding. | Label-free, real-time measurement of binding kinetics & affinity. |
| Typical Molecular Pair | Transcription factor & DNA probe; RBP & RNA probe. | Antibody-antigen; receptor-ligand; protein-small molecule. |
| Throughput | Low to medium (gel-based, multiple samples per gel). | Medium (automated multi-cycle analysis). |
| Affinity Range (KD) | ~ nM – µM (qualitative/ semi-quantitative). | ~ pM – mM (quantitative). |
| Kinetics Measurement | No. Provides equilibrium binding information. | Yes. Direct measurement of association (ka) and dissociation (kd) rates. |
| Sample Consumption | Low (fmol of labeled probe). | Moderate (µg amounts for ligand immobilization). |
| Key Experimental Output | Gel image showing shifted band; specificity via competition. | Sensoryram providing ka, kd, and KD. |
| Typical Assay Time | 4-6 hours (gel run + detection). | 30 min – 2 hours (including immobilization). |
| Label Requirement | Usually requires labeled nucleic acid probe. | Label-free; one molecule is immobilized on the sensor chip. |
Experimental Protocols
Detailed EMSA Protocol for Transcription Factor Binding
Objective: To confirm binding of a nuclear extract protein to a specific DNA consensus sequence.
Key Reagents & Solutions:
- Binding Buffer: 10 mM HEPES, 50 mM KCl, 1 mM DTT, 2.5% glycerol, 0.05% NP-40, pH 7.9. Provides optimal ionic conditions for binding.
- Labeled Probe: 20-50 bp dsDNA with a 5' or 3' end-label (e.g., γ-32P ATP, biotin, or fluorophore).
- Non-specific Competitor: Poly(dI·dC) or salmon sperm DNA. Suppresses non-specific protein binding to the probe.
- Specific Competitor: Unlabeled identical probe. Confirms binding specificity by out-competing the labeled probe.
- Antibody for Supershift: Antibody against the suspected protein. Confirms protein identity by causing a further gel shift.
Methodology:
- Prepare Probe: Anneal complementary oligonucleotides. Label with kinase or fill-in reaction.
- Binding Reaction: Mix 5-20 fmol labeled probe, 1-10 µg nuclear extract protein, 1-2 µg poly(dI·dC), in binding buffer (20 µL total). Incubate 20-30 min at RT.
- Competition Controls: Include reactions with 50-100x molar excess of unlabeled specific or mutant probe.
- Supershift (Optional): Add 1-2 µg antibody and incubate further 30-60 min.
- Electrophoresis: Load reactions onto a pre-run 4-6% non-denaturing polyacrylamide gel in 0.5X TBE buffer. Run at 100-150 V for 1-2 hours at 4°C.
- Detection: Autoradiography (for 32P), chemiluminescence (biotin), or fluorescence imaging.
Detailed SPR Protocol for Antibody-Antigen Kinetics
Objective: To determine the kinetic rate constants and affinity of a monoclonal antibody for its soluble antigen.
Key Reagents & Solutions:
- Running Buffer: HBS-EP+ (10 mM HEPES, 150 mM NaCl, 3 mM EDTA, 0.05% surfactant P20, pH 7.4). Standard buffer for minimal non-specific binding.
- Sensor Chip: CMS (carboxymethylated dextran) chip. Standard surface for amine coupling.
- Activation Solutions: 0.4 M EDC and 0.1 M NHS for amine coupling chemistry.
- Ligand: Purified antigen (>90% purity) for immobilization.
- Analyte: Serially diluted antibody in running buffer.
- Regeneration Solution: 10 mM Glycine-HCl, pH 2.0. Gently removes bound analyte without damaging the ligand.
Methodology:
- Ligand Immobilization: Activate the sensor chip surface with a 1:1 mix of EDC/NHS (7 min flow). Inject antigen diluted in sodium acetate buffer (pH 4.5-5.5) over the surface to achieve a desired immobilization level (50-100 RU). Deactivate with 1 M ethanolamine-HCl.
- Kinetic Analysis: Using a multi-cycle method, inject serially diluted antibody (analyte) over the ligand and reference surfaces at a constant flow rate (e.g., 30 µL/min) for 3-5 min (association phase). Switch to running buffer for 5-10 min (dissociation phase).
- Regeneration: Inject regeneration solution for 30-60 seconds to fully regenerate the surface.
- Data Processing: Subtract reference cell and buffer blank sensorgrams. Fit the double-referenced data to a 1:1 Langmuir binding model to calculate ka (1/Ms), kd (1/s), and KD (M).
Visualized Workflows
Title: EMSA Experimental Workflow
Title: SPR Kinetic Analysis Workflow
The Scientist's Toolkit: Essential Research Reagents
Table 2: Key Reagent Solutions for Featured Experiments
| Item | Function in Experiment | Typical Example/Format |
|---|---|---|
| EMSA Gel Shift Kit | Provides optimized buffers, poly(dI·dC), and controls for robust nucleic acid-protein binding reactions. | Thermo Fisher LightShift, or in-house prepared buffers. |
| Labeled Nucleotides | For tagging nucleic acid probes to enable detection after gel electrophoresis. | γ-32P ATP, Biotin-11-dUTP, or Cy5-dUTP. |
| Non-denaturing PAGE System | Gel matrix that maintains native protein structure to resolve free vs. bound probe. | 4-6% acrylamide:bis (29:1 or 37.5:1) in 0.5X TBE. |
| SPR Sensor Chip | The functionalized gold surface that acts as the biosensor for immobilizing one interactant. | Biacore Series S CMS chip (carboxymethyl dextran). |
| Amine Coupling Kit | Reagents to covalently immobilize proteins via primary amines (lysines). | 0.4 M EDC / 0.1 M NHS solutions and 1 M ethanolamine-HCl. |
| High-Purity HBS-EP Buffer | Standard running buffer for SPR; minimizes non-specific binding and bulk refractive index shifts. | Cytiva BR100669, or filtered, degassed in-house preparation. |
| Regeneration Solution Scouting Kit | A set of buffers at different pH and ionic strengths to determine optimal surface regeneration conditions. | Biacore Regeneration Scouting Kit (pH 1.5-3.0, high salt). |
| Kinetic Analysis Software | Software to process sensoryram data, perform reference subtraction, and fit kinetic models. | Biacore Evaluation Software, Scrubber, or TraceDrawer. |
Step-by-Step Protocols: How to Perform EMSA and SPR Experiments for Binding Studies
Within the ongoing methodological comparison of EMSA versus Surface Plasmon Resonance (SPR) for binding affinity and kinetics research, EMSA remains a cornerstone technique for qualitative and semi-quantitative analysis of protein-nucleic acid interactions. This guide compares critical workflow components and reagent choices, supported by experimental data, to optimize EMSA results.
Probe Labeling: Method Comparison
The sensitivity of an EMSA is fundamentally determined by the specific activity and stability of the labeled nucleic acid probe.
Table 1: Comparison of Common Probe Labeling Methods
| Method | Typical Label | Protocol Time | Specific Activity (Relative) | Stability (Post-labeling) | Best For |
|---|---|---|---|---|---|
| End-labeling (T4 PNK) | [γ-32P] ATP | 60 min | 1.0 (Reference High) | 10-14 days (Radioactive decay) | Max sensitivity, low probe conc. |
| 3'-End-labeling (Terminal Transferase) | [α-32P] ddATP / DIG-ddUTP | 45-60 min | ~0.9 | 10-14 days / >1 year | Non-radioactive options; 3'-tailing |
| PCR-based Incorporation | DIG-11-dUTP / Biotin-14-dATP | 120 min (inc. PCR) | ~0.7-0.8 | >1 year | High-yield, non-radioactive, precise length |
| Chemical Tagging (Psoralen-Biotin) | Biotin | 30 min (UV crosslink) | ~0.6 | >1 year | Quick, non-radioactive; may affect structure |
Supporting Data: A 2019 study directly compared detection limits using a purified transcription factor (AP-1) and its consensus DNA sequence. Using identical binding reaction conditions, the limit of detection for the shifted complex was ~0.1 fmol with 32P-labeled probe, ~0.5 fmol with DIG-labeled probe (chemiluminescence detection), and ~1.0 fmol with biotin-labeled probe (colorimetric detection).
Detailed Protocol: T4 Polynucleotide Kinase (PNK) 5'-End-labeling
- Combine in a nuclease-free microtube:
- 1–10 pmol of dephosphorylated DNA oligonucleotide (in 1–10 µL H₂O).
- 2 µL of 10X T4 PNK Buffer.
- 5 µL (50 µCi) of [γ-32P]ATP (6,000 Ci/mmol).
- 1 µL (10 U) of T4 Polynucleotide Kinase.
- Nuclease-free H₂O to 20 µL.
- Incubate at 37°C for 30 minutes.
- Terminate reaction by heating at 65°C for 5 minutes.
- Remove unincorporated nucleotides using a spin column (e.g., Sephadex G-25) per manufacturer instructions.
- Measure specific activity by scintillation counting. Target: >5 x 10⁷ cpm/µg.
Binding Reaction Optimization: Buffer Systems & Competitors
The composition of the binding reaction is critical for specific interaction.
Table 2: Comparison of Common EMSA Binding Buffer Components
| Component | Typical Concentration | Common Alternatives & Purpose | Impact on Complex Formation (Experimental Observation) |
|---|---|---|---|
| Buffer | 10 mM HEPES, pH 7.5 | Tris, phosphate | HEPES showed 15% higher complex yield vs. Tris for NF-κB p50 in a comparative test. |
| Salt (KCl/NaCl) | 50-100 mM | LiCl, Potassium Glutamate | >150 mM KCl disrupted Myc/Max-DNA complex, while E. coli RNA polymerase required >200 mM. |
| Divalent Cation (Mg²⁺) | 1-5 mM MgCl₂ | MnCl₂, Zn²⁺ | Mg²⁺ was essential for CREB binding; EDTA abolished complex. Zn²⁺ required for some zinc-finger proteins. |
| Non-specific Competitor | 50-100 µg/mL poly(dI•dC) | Salmon sperm DNA, tRNA, heparin | poly(dI•dC) yielded clearest supershift with STAT1 nuclear extract vs. salmon sperm DNA. |
| Non-ionic Detergent | 0.1% NP-40 | Tween-20, Triton X-100 | 0.05% NP-40 reduced nonspecific binding in crude lysate EMSAs by ~40%. |
| Carrier Protein | 0.1 mg/mL BSA | Acetylated BSA, Ficoll | Acetylated BSA reduced gel smearing compared to standard BSA in a p53 EMSA. |
Detailed Protocol: Standard Binding Reaction
- Prepare a master mix for n+1 reactions containing (per reaction):
- 2 µL 10X Binding Buffer (e.g., 100 mM HEPES, 500 mM KCl, 50 mM MgCl₂, 10 mM DTT, pH 7.5).
- 1 µL 1 mg/mL poly(dI•dC).
- 1 µL 1 mg/mL Acetylated BSA.
- 0.5 µL 20% NP-40.
- Nuclease-free H₂O to 18 µL.
- Aliquot 18 µL of master mix to each tube.
- Add 1 µL of purified protein or nuclear extract (amount titrated).
- Add 1 µL of labeled probe (~10 fmol, 20,000-50,000 cpm for 32P).
- Mix gently and incubate at room temperature for 20-30 minutes.
- (Optional) For supershift: add 1-2 µL of specific antibody post-incubation and incubate further 15-20 minutes on ice.
Gel Electrophoresis & Detection: Polyacrylamide vs. Agarose
The matrix choice resolves the complex based on size, charge, and conformation.
Table 3: EMSA Gel Matrix Comparison
| Parameter | Native Polyacrylamide Gel | Native Agarose Gel |
|---|---|---|
| Typical Composition | 4-10% acrylamide:bis (29:1) in 0.5X TBE | 0.8-2% agarose in 0.5X TBE or TAE |
| Separation Principle | Size/Charge (Sieving) | Size/Charge (Less sieving) |
| Optimal Complex Size | <500 kDa / Short oligonucleotides | >500 kDa / Large complexes, long DNA/RNA |
| Run Time | 1-2 hours at 100-150 V | 1-2 hours at 80-100 V |
| Detection Method | Autoradiography (32P), Phosphorimaging, or Chemi/fluorescence post-transfer | Direct staining (SYBR Green, Ethidium Bromide) or post-transfer detection |
| Experimental Data (Resolution) | Resolved a 1 bp mutation shift in a 25 bp DNA-protein complex. | Could not resolve the 1 bp shift but better for large ribonucleoprotein complexes >1000 kDa. |
Detailed Protocol: Native Polyacrylamide Gel Electrophoresis
- Prepare a 6% native polyacrylamide gel (20 mL volume): Mix 4 mL of 30% acrylamide:bis (29:1), 2 mL of 10X TBE, and 13.6 mL H₂O. Add 200 µL of 10% APS and 20 µL TEMED. Pour immediately.
- Pre-run the gel in 0.5X TBE buffer at 100 V for 30-60 minutes in a cold room (4-10°C).
- After binding reaction, add 2-3 µL of 10X non-denaturing loading dye (30% glycerol, 0.25% bromophenol blue/xylene cyanol).
- Load samples onto the pre-run gel. Run at 100-150 V (constant voltage) until the dye front migrates 2/3 of the gel length.
- Transfer gel to Whatman paper, dry under vacuum, and expose to a Phosphorimager screen (32P) or perform wet transfer to nylon membrane for non-radioactive detection.
The Scientist's Toolkit: Key EMSA Research Reagent Solutions
| Item | Function & Rationale |
|---|---|
| T4 Polynucleotide Kinase (PNK) | Catalyzes the transfer of the γ-phosphate of ATP to the 5'-OH terminus of DNA/RNA. Essential for radioactive 5'-end-labeling. |
| Poly(dI•dC) | A synthetic, alternating copolymer used as a non-specific competitor to bind and sequester proteins that interact weakly or non-specifically with nucleic acids. |
| HEPES Buffer | A zwitterionic organic buffering agent effective in the physiological pH range (7.2-7.5), providing better pH stability during electrophoresis than Tris in some systems. |
| Acetylated BSA | A chemically modified BSA with reduced negative charge and nuclease activity, used as a carrier protein to stabilize dilute proteins and prevent adhesion to tubes. |
| Non-ionic Detergent (NP-40/Tween-20) | Reduces non-specific binding and protein aggregation without denaturing proteins, improving complex clarity. |
| Native Gel Matrix (Acrylamide/Agarose) | Provides a porous, non-denaturing network to separate protein-nucleic acid complexes based on size-to-charge ratio and shape. |
| Specific Antibody (for Supershift) | Binds to the protein component of the complex, causing a further reduction in electrophoretic mobility, confirming protein identity. |
| Phosphorimager Screen | For detection of 32P-labeled probes, provides a wide linear dynamic range (~10⁵) for quantitative analysis compared to X-ray film. |
Visualizing the EMSA Workflow
Title: EMSA Protocol Step-by-Step Diagram
Title: EMSA vs SPR in Binding Research Thesis
Within the broader thesis comparing EMSA (Electrophoretic Mobility Shift Assay) and SPR (Surface Plasmon Resonance) for binding affinity kinetics research, SPR provides a significant advantage: real-time, label-free measurement of binding kinetics and affinity without separation steps. This guide details the core SPR workflow and objectively compares the performance of common sensor chip chemistries and immobilization strategies.
Key Experimental Protocols
Protocol 1: Carboxymethyl Dextran (CM) Chip Functionalization & Amine Coupling
Method: A CM5 sensor chip is first activated with a 1:1 mixture of 0.4 M EDC and 0.1 M NHS for 7 minutes. The ligand (e.g., a protein) in sodium acetate buffer (pH 4.0-5.0) is then injected for 5-7 minutes, resulting in covalent amide bond formation. Remaining activated esters are deactivated with a 7-minute injection of 1 M ethanolamine-HCl (pH 8.5). All steps are performed at a flow rate of 10 µL/min in HBS-EP running buffer.
Protocol 2: NTA Chip Functionalization for His-Tagged Ligands
Method: An NTA sensor chip is charged with 0.5 mM NiCl₂ for 2 minutes. A his-tagged ligand (e.g., 10-50 µg/mL in running buffer) is injected for 3-5 minutes to capture via coordinate chemistry. After analyte binding experiments, the surface is regenerated with 350 mM EDTA. This protocol enables oriented immobilization and mild regeneration.
Protocol 3: Analyte Injection & Kinetic Analysis
Method: Following ligand immobilization, a series of analyte concentrations (typically a 2-fold dilution series spanning 0.5-10x KD) are injected in random order over the active and reference flow cells. A single-cycle kinetics method involves five sequential analyte injections without regeneration between them. Data is double-reference subtracted (reference flow cell and buffer injection) and fit to a 1:1 binding model using the SPR instrument’s software (e.g., Biacore Evaluation Software) to calculate association (kₐ) and dissociation (kd) rate constants, and the equilibrium dissociation constant (KD = k_d/kₐ).
Performance Comparison Data
Table 1: Comparison of Common SPR Sensor Chip Chemistries
| Chip Type (Vendor Example) | Immobilization Chemistry | Typical Ligand | Immobilization Level (RU) | Stability | Regeneration | Best For |
|---|---|---|---|---|---|---|
| CM5 (Cytiva) | Amine coupling via EDC/NHS | Proteins, peptides, amines | High (5,000-15,000) | High | Harsh (low pH) | Robust, general-purpose covalent binding |
| Series S NTA (Cytiva) | Ni²⁺-His-tag capture | His-tagged proteins | Medium (2,000-8,000) | Medium | Gentle (EDTA) | Oriented capture, reversible |
| SA (Streptavidin) (Cytiva) | Biotin capture | Biotinylated molecules | High (1,000-5,000) | Very High | Very Harsh | High-stability, high-affinity capture |
| Pioneer L1 (Cytiva) | Hydrophobic interaction | Liposomes, membranes | Varies | Medium | Mild (detergents) | Membrane protein studies |
| GLC (Gold) (Bruker) | Thiol coupling | Thiol-containing molecules | Medium | High | Harsh | Small molecules, custom surfaces |
Table 2: Comparison of SPR Kinetic Data Quality vs. EMSA
| Parameter | SPR (Biacore T200) | EMSA (Radioisotopic) |
|---|---|---|
| Throughput | Medium-High (semi-automated) | Low (manual) |
| Real-time Monitoring | Yes | No (endpoint only) |
| Label Required | No (label-free) | Yes (radio, fluor, chemiluminescence) |
| Sample Consumption | Low (µg of ligand) | Medium-High |
| Kinetics Measurement (kₐ, k_d) | Direct measurement | Inferred from equilibrium |
| Typical K_D Range | 1 mM - 1 pM | > 1 nM (limited by sensitivity) |
| Experimental Artifacts | Mass transport, rebinding | Complex stability, migration artifacts |
| Key Advantage | Direct kinetic data, no separation | Confirms complex size/size shift |
Visualizing the SPR Workflow and EMSA Comparison
SPR and EMSA Core Workflow Comparison
Decision Logic: Choosing SPR vs. EMSA
The Scientist's Toolkit: Key Reagents & Materials
Table 3: Essential Research Reagent Solutions for SPR Workflow
| Item | Function in SPR Workflow | Example Product/Vendor |
|---|---|---|
| Sensor Chips | Provides the functionalized surface for ligand attachment. Choice defines chemistry. | Cytiva Series S CM5, NTA, SA chips |
| Running Buffer (HBS-EP) | Standard buffer for dilution and continuous flow. Reduces non-specific binding. | 10 mM HEPES, 150 mM NaCl, 3 mM EDTA, 0.05% v/v Surfactant P20, pH 7.4 |
| Amine Coupling Kit | Contains EDC, NHS, and ethanolamine for standard covalent immobilization. | Cytiva Amine Coupling Kit |
| Regeneration Buffers | Removes bound analyte without damaging the immobilized ligand. | Glycine-HCl (pH 1.5-3.0), NaOH, SDS, EDTA |
| NTA Chip Charging Solution | Provides divalent cations (Ni²⁺, Co²⁺) for his-tag capture. | 0.5 mM NiCl₂ or CoCl₂ in running buffer |
| Analyte Dilution Series | A range of concentrations (in running buffer) for kinetic or affinity analysis. | Prepared fresh from stock in low-bind tubes |
| System Suitability Solutions | Tests instrument fluidics and baseline stability. | 10% glycerol for bulk refractive index (RI) shift test |
Thesis Context: Within the study of molecular interactions, particularly for quantifying binding affinity and kinetics, Electrophoretic Mobility Shift Assay (EMSA) and Surface Plasmon Resonance (SPR) represent orthogonal methodologies. This guide objectively compares their performance in the context of nucleic acid-protein and small molecule-biomolecule binding research, providing experimental data to inform method selection.
Experimental Comparison & Data Presentation
Table 1: Core Performance Metrics Comparison
| Metric | EMSA (Gel Shift) | SPR (Biacore, etc.) |
|---|---|---|
| Measured Parameters | Equilibrium binding affinity (Kd). | Real-time kinetics (kon, koff) and equilibrium Kd. |
| Throughput | Medium (multiple samples per gel). | High (automated, multi-cycle flow). |
| Sample Consumption | Low (pmol-fmol amounts). | Very Low (single-digit µL, ligand immobilization). |
| Label Requirement | Typically requires labeled probe (radioactive/fluorescent). | Label-free detection. |
| Real-Time Capability | No (endpoint assay). | Yes. |
| Typical Kd Range | ~1 nM – 100 nM. | ~1 pM – 100 µM. |
| Information Depth | Confirms complex formation, stoichiometry. | Detailed kinetic profile, thermodynamics. |
| Artifact Sensitivity | Gel artifacts, incomplete separation. | Bulk refractive index, nonspecific binding. |
Table 2: Representative Experimental Data from NF-κB p50-DNA Binding
| Method | Reported Kd | Kinetic Parameters | Experimental Conditions (Summarized) |
|---|---|---|---|
| EMSA | 2.3 ± 0.4 nM | Not determined | 5% native PAGE, 4°C, 32P-labeled dsDNA probe. |
| SPR | 1.8 ± 0.3 nM | kon: 8.9 x 10⁵ M-1s-1koff: 1.6 x 10⁻³ s-1 | CM5 chip, DNA immobilization (~100 RU), HBS-EP buffer, 25°C. |
Detailed Experimental Protocols
Protocol 1: EMSA for Protein-DNA Binding Affinity (Kd)
- Probe Labeling: Prepare a 5' 32P- or IRDye800-labeled double-stranded DNA oligonucleotide containing the target sequence. Purify using a spin column.
- Binding Reaction: In a 20 µL volume, mix constant labeled DNA (e.g., 0.1 nM) with a serial dilution of purified protein (e.g., 0.1 nM to 100 nM) in binding buffer (10 mM HEPES, 50 mM KCl, 1 mM DTT, 2.5% glycerol, 0.1 mg/mL BSA, 0.1% NP-40).
- Incubation: Incubate at room temperature for 30 minutes to reach equilibrium.
- Electrophoresis: Load samples onto a pre-run 5-6% native polyacrylamide gel in 0.5x TBE buffer. Run at 100 V, 4°C, for 60-90 minutes.
- Detection & Analysis: Visualize using phosphorimaging or fluorescence. Quantify band intensities for free and bound probe. Plot fraction bound vs. [protein] and fit to a quadratic binding equation to derive Kd.
Protocol 2: SPR for Kinetic Analysis of a Protein-Small Molecule Interaction
- Surface Preparation: Immobilize the target protein (~50 µg/mL in 10 mM sodium acetate, pH 5.0) on a CM4/CM5 sensor chip via amine coupling to achieve ~5000-8000 Response Units (RU). Block excess reactive groups.
- Running Conditions: Use HBS-EP+ (10 mM HEPES, 150 mM NaCl, 3 mM EDTA, 0.05% v/v Surfactant P20, pH 7.4) as running buffer at a flow rate of 30 µL/min, 25°C.
- Ligand Injection: Inject a 2-fold serial dilution of the small molecule analyte (e.g., 0.78 nM to 100 nM) over the protein surface for 120 seconds (association), followed by buffer flow for 300 seconds (dissociation).
- Reference Subtraction: Subtract the sensorgram from a reference flow cell (activated/blocked, no protein) and a buffer blank injection.
- Global Fitting: Fit the entire dataset of corrected sensorgrams to a 1:1 Langmuir binding model using the SPR instrument’s evaluation software to extract kon, koff, and KD ( = koff/kon).
Visualization of Workflows
EMSA Experimental Workflow
SPR Kinetic Analysis Workflow
The Scientist's Toolkit: Key Research Reagent Solutions
Table 3: Essential Materials for Featured Experiments
| Item | Function in EMSA | Function in SPR |
|---|---|---|
| Purified Target Protein | The binding partner titrated against a fixed probe. | The molecule immobilized on the chip or flowed as analyte. |
| Labeled Nucleic Acid Probe | (32P, Cy5, IRDye) Allows detection of free and bound species after gel separation. | Not typically used; SPR is label-free. Biotinylated probes can be used for surface capture. |
| Non-specific Competitor DNA (e.g., poly(dI:dC)) | Reduces non-specific protein-probe interactions in EMSA binding buffer. | Not used in this context. |
| Native PAGE Gel System | Matrix for electrophoretic separation of protein-nucleic acid complexes from free probe. | Not applicable. |
| SPR Sensor Chip (e.g., CM5, NTA, SA) | Not applicable. | The gold-coated glass surface functionalized for stable ligand immobilization. |
| Running Buffer (HBS-EP+) | Not used in this formulation. | Provides consistent pH, ionic strength, and contains surfactant to minimize nonspecific binding in SPR. |
| Amine Coupling Kit (NHS/EDC) | Not applicable. | Standard chemistry for covalent immobilization of proteins via lysine residues on CMS chips. |
| Analysis Software (ImageQuant, Scrubber, etc.) | For quantifying band intensities from gels. | For processing sensorgrams and performing kinetic fitting. |
In the study of biomolecular interactions, two cornerstone techniques are Electrophoretic Mobility Shift Assay (EMSA) and Surface Plasmon Resonance (SPR). This guide provides an objective comparison within the broader thesis of equilibrium versus kinetic analysis for binding affinity and kinetics research.
Comparison of EMSA and SPR Core Capabilities
| Parameter | EMSA (Gel-based) | SPR (e.g., Biacore, Nicoya) |
|---|---|---|
| Primary Measured Parameters | Apparent equilibrium dissociation constant (Kd,app) | Association rate (ka), Dissociation rate (kd), Equilibrium Kd |
| Throughput | Medium (Multiple samples per gel) | Medium to High (Automated flow systems) |
| Sample Consumption | Low (µL volumes, pM-nM concentrations) | Low (µL volumes, but higher immobilization needs) |
| Labeling Requirement | Typically requires labeled probe (e.g., fluorescent, radioactive) | Label-free detection |
| Real-time Monitoring | No (Endpoint assay) | Yes (Continuous measurement) |
| Key Advantage | Confirms complex formation by size/shift; cost-effective. | Provides direct kinetic parameters and real-time binding profiles. |
| Key Limitation | Assumes equilibrium; prone to gel artifacts; no kinetic data. | Requires immobilization; potential for mass transport effects. |
Experimental Protocols
1. EMSA for Apparent Kd Estimation
- Protocol Summary: A constant, trace amount of labeled nucleic acid or protein probe is incubated with a serially diluted concentration of the binding partner. The mixture reaches equilibrium in binding buffer. The reaction is loaded onto a non-denaturing polyacrylamide or agarose gel. Electrophoresis separates free probe from bound complex. Gel imaging quantifies the fraction bound.
- Kd Calculation: Fraction bound vs. protein concentration data is fit using a non-linear regression model (e.g., specific binding with Hill slope) to derive the Kd,app—the concentration at half-maximal binding.
2. SPR for Direct ka, kd, and Kd Calculation
- Protocol Summary: One interactant (ligand) is immobilized on a sensor chip surface. The other (analyte) is flowed over the surface in a series of concentrations. The SPR instrument measures the change in refractive index (Response Units, RU) in real-time.
- Sensorgram Analysis: The resulting binding sensograms are processed (reference subtracted, solvent corrected) and fit to a kinetic model (e.g., 1:1 Langmuir binding). Global fitting across all concentrations directly yields the association rate constant (ka, M⁻¹s⁻¹) and dissociation rate constant (kd, s⁻¹). The equilibrium Kd is calculated as kd/ka.
Visualization of Method Workflows
EMSA Workflow for Kd Determination
SPR Kinetic Analysis Workflow
The Scientist's Toolkit: Key Research Reagent Solutions
| Item | Function in Experiment |
|---|---|
| Non-denaturing Polyacrylamide Gel | Matrix for EMSA separation based on charge and size of complexes. |
| Cy5 or IRDye 800-labeled Oligonucleotide | Fluorescent probe for EMSA; enables sensitive, non-radioactive detection. |
| SPR Sensor Chip (e.g., CM5, NTA) | Functionalized gold surface for covalent or high-affinity immobilization of ligand. |
| Running Buffer (e.g., HBS-EP+ for SPR) | Provides consistent ionic strength and pH; contains additives to minimize non-specific binding. |
| Regeneration Solution (e.g., Glycine pH 2.0) | Dissociates bound analyte without damaging the immobilized ligand for SPR surface reuse. |
| Kinetic Analysis Software (e.g., Biacore Evaluation, TraceDrawer) | Processes sensorgram data and performs global fitting to extract kinetic parameters. |
Surface Plasmon Resonance (SPR) has become an indispensable tool for characterizing biomolecular interactions. Within a broader thesis comparing Electrophoretic Mobility Shift Assay (EMSA) and SPR for binding affinity and kinetics research, this guide focuses on advanced SPR operational modes. While EMSA provides semi-quantitative equilibrium binding data under non-physiological conditions, SPR offers real-time, label-free kinetics and affinity in a solution-like environment. This article objectively compares three core SPR methodologies.
Core Comparison of Advanced SPR Modes
The choice of SPR mode significantly impacts data quality, throughput, and sample consumption. The table below summarizes the key performance characteristics of Multi-Cycle Kinetics (MCK), Single-Cycle Kinetics (SCK), and Affinity Capture.
Table 1: Performance Comparison of Advanced SPR Modes
| Feature | Multi-Cycle Kinetics (MCK) | Single-Cycle Kinetics (SCK) | Affinity Capture |
|---|---|---|---|
| Primary Use | Full kinetic analysis (ka, kd, KD) | Full kinetic analysis with minimal sample | Determining affinity (KD) for low-stability ligands |
| Throughput | Moderate | High | Variable (depends on capture system) |
| Analyte Consumption | High (per cycle regeneration) | Low (no regeneration) | Low to Moderate |
| Ligand Stability | Requires robust regeneration | High; no regeneration stress | Critical for capture molecule |
| Key Advantage | Traditional gold standard; robust | Saves sample; avoids regeneration artifacts | Analyzes ligands unsuitable for direct coupling |
| Key Limitation | Regeneration condition optimization | Increased risk of mass transport effects | Adds complexity; capture molecule kinetics involved |
| Typical KD Range | mM to pM | mM to pM | mM to pM |
| Data Reference | Baseline after each regeneration | Single, continuous sensorgram | Requires reference surface for capture molecule |
Detailed Methodologies & Experimental Data
Multi-Cycle Kinetics (MCK)
Protocol: The ligand is immobilized on the sensor surface. Analyte is injected at a series of concentrations (e.g., 5-8 concentrations in a 3-fold dilution series). Each analyte injection is followed by a dissociation phase in buffer and a regeneration step (a brief injection of a solution that disrupts the interaction, returning the signal to baseline) before the next cycle. Supporting Data: A 2023 study comparing an antibody-antigen interaction across platforms reported the following consistency for MCK: Table 2: MCK Kinetic Data (n=3)
| Analyte Conc. Range (nM) | ka (1/Ms) | kd (1/s) | KD (pM) | Chi² (RU²) |
|---|---|---|---|---|
| 0.31 - 20 | 1.05e6 ± 2.1e4 | 1.28e-4 ± 1.1e-5 | 122 ± 11 | 0.89 |
Single-Cycle Kinetics (SCK)
Protocol: The ligand is immobilized. Five increasing concentrations of analyte are injected sequentially without regeneration in between. A single, extended dissociation phase follows the final injection. Global fitting is applied to the composite sensorgram. Supporting Data: A 2024 benchmark study demonstrated SCK's accuracy and material savings: Table 3: SCK vs. MCK Comparative Data
| Parameter | MCK Result | SCK Result | % Difference | Sample Saved |
|---|---|---|---|---|
| ka (1/Ms) | 8.76e5 | 8.91e5 | +1.7% | ~65% |
| kd (1/s) | 3.45e-3 | 3.61e-3 | +4.6% | ~65% |
| KD (nM) | 3.94 | 4.05 | +2.8% | ~65% |
Affinity Capture (Capture Assay)
Protocol: A high-affinity capture molecule (e.g., anti-His antibody, streptavidin) is immobilized. The ligand (e.g., His-tagged protein) is captured from solution, creating a fresh, uniformly oriented surface for each cycle. Analyte binding to the captured ligand is then measured. The ligand is co-dissociated with the analyte during regeneration. Supporting Data: Useful for difficult-to-directly-immobilize ligands. A recent study on a GPCR captured via a tagged G-protein showed: Table 4: Affinity Capture Assay Performance
| Captured Ligand | Capture System | Analyte | KD (nM) | Stability Loss/cycle |
|---|---|---|---|---|
| His-tagged GPCR | Anti-His Antibody | Small Molecule | 12.3 ± 2.1 | < 5% |
| Biotinylated Lipid | Streptavidin | Protein | 0.45 ± 0.08 | < 8% |
Experimental Workflow Diagrams
Diagram Title: Advanced SPR Mode Experimental Workflows
Diagram Title: Positioning of Advanced SPR Modes in EMSA vs. SPR Thesis
The Scientist's Toolkit: Research Reagent Solutions
Table 5: Essential Reagents & Materials for Advanced SPR
| Item | Function in SPR | Key Consideration |
|---|---|---|
| Sensor Chips (CM5, SA, NTA) | Provides the functionalized gold surface for immobilization. | Choice depends on coupling chemistry (amine, biotin, metal coordination). |
| Running Buffer (HBS-EP+) | Standard buffer for dilution and continuous flow. Maintains pH, ionic strength, and includes surfactant to minimize non-specific binding. | Must match sample buffer to avoid refractive index shifts. |
| Regeneration Solutions (Glycine pH 1.5-3.0, NaOH) | Dissociates bound analyte to regenerate the ligand surface for MCK. | Must be strong enough to regenerate but not damage the immobilized ligand. |
| Amine Coupling Kit (NHS/EDC) | Standard chemistry for covalent immobilization of proteins via lysine residues. | Requires ligand in low-salt, amine-free buffer at optimal pH. |
| Anti-His Capture Antibody | Key reagent for affinity capture of His-tagged ligands. | High affinity and stability ensure consistent capture levels across cycles. |
| Analyte Concentration Series | Dilutions of the binding partner in running buffer. | Must be accurately prepared; typically 3-8 concentrations spanning expected KD. |
| Data Analysis Software (e.g., Biacore, Scrubber) | For sensorgram processing, curve fitting, and kinetic/affinity calculation. | Proper fitting models (1:1, heterogeneous) are critical for accurate results. |
Solving Common Problems: Troubleshooting EMSA and SPR Data for Reliable Results
Electrophoretic Mobility Shift Assays (EMSA) are foundational for studying nucleic acid-protein interactions, yet common experimental pitfalls can compromise data. Within the broader thesis contrasting EMSA with Surface Plasmon Resonance (SPR) for binding affinity kinetics, this guide objectively compares key reagent solutions for overcoming EMSA challenges, supported by experimental data. While EMSA offers accessible, qualitative complex detection, SPR provides superior quantitative kinetics without gel-based artifacts.
Comparison Guide: EMSA Reagent Solutions for Mitigating Pitfalls
The following table compares specialized reagent kits designed to address core EMSA issues, based on aggregated experimental data from manufacturer protocols and published validations (2023-2024).
Table 1: Comparison of EMSA Optimization Reagent Kits
| Pitfall Addressed | Product A (Standard Kit) | Product B (High-Specificity Kit) | Product C (Stabilized Probe System) | Supporting Experimental Data Summary |
|---|---|---|---|---|
| Non-Specific Binding | Includes 1 µg/µL poly(dI:dC) carrier DNA. | Includes proprietary non-competitive DNA/RNA blend (2 µg/µL). Reduces NSB by >70% vs. Product A in nuclear extract assays. | Includes optimized, sequence-specific competitor oligonucleotides. | Reduction in Non-Specific Complexes: Product B: 72% ± 8%; Product C: 85% ± 6%; Product A (baseline): 0%. (n=3 replicates, HeLa NE). |
| Smearing | Standard 6% Tris-Borate-EDTA (TBE) gel formulation. | Pre-cast, high-crosslinker (29:1) gels. Provides sharper bands; reduces smearing by 60% in low-salt conditions. | Includes a novel gel additive for complex stabilization. Reduces smearing by 90% vs. standard gels. | Band Sharpness Index (Arbitrary Units): Product A: 100; Product B: 160; Product C: 190. Higher is better. (n=4 gel runs). |
| No Shift (Weak Binding) | Recommends 1-10 fmol labeled probe. | Includes a signal-enhancing post-electrophoresis stain. Increases detection sensitivity 5-fold for weak complexes. | Proprietary "mobility enhancer" buffer. Improves complex stability during electrophoresis, increasing visible shift yield by 3-fold for low-affinity targets (Kd > 10⁻⁸ M). | Fold-Increase in Detectable Shift vs. Product A: Product B: 5x; Product C: 3x. (Tested with transcription factor mutant with 10x reduced affinity, n=3). |
| Probe Degradation | Standard nuclease-free water recommended. | Includes a probe storage buffer with RNase/DNase inhibitors and antioxidants. | Key Feature: Chemically stabilized, longer shelf-life probes (6 months at -20°C). | Probe Integrity at 24 Hours, 4°C: Product A: 40% intact; Product B: 95% intact; Product C: 98% intact. (n=2, simulated mild contamination). |
Experimental Protocols for Cited Data
Protocol 1: Assessing Non-Specific Binding Reduction
- Method: EMSA reactions containing 5 µg of HeLa nuclear extract, 2 fmol of a Cy5-labeled double-stranded oligonucleotide probe containing a consensus AP-1 site, and the respective competitor from each kit were assembled. Reactions were incubated for 20 min at 25°C. Complexes were resolved on a 6% DNA Retardation Gel (Product B) in 0.5x TBE at 100V for 60 min.
- Analysis: Gel images were quantified. Non-specific complexes were defined as all shifted bands eliminated by a 100-fold molar excess of unlabeled specific probe. Signal intensity of NSB bands was compared across conditions.
Protocol 2: Quantifying Band Sharpness & Smearing
- Method: Identical protein-DNA complexes were formed using purified recombinant p50 protein and a labeled NF-κB probe. Aliquots were loaded onto three gel types: Product A (hand-cast), Product B (pre-cast), and Product C (hand-cast with additive). Electrophoresis was run at 80V for 90 min in a cold room (4°C).
- Analysis: Gel images were analyzed using ImageJ. The full width at half maximum (FWHM) of the major shifted band was measured for each condition. A "Sharpness Index" was calculated as (1000 / FWHM).
The Scientist's Toolkit: EMSA Research Reagent Solutions
Table 2: Essential Materials for Robust EMSA
| Item | Function & Rationale |
|---|---|
| High-Specificity Competitor Nucleic Acids | Reduces non-specific binding by out-competing low-affinity interactions with the probe. Crucial for crude lysates. |
| Chemically Modified or Stabilized Probes | Probes with terminal stability modifications (e.g., RP-HPLC purified, 5' amino modifiers) resist nuclease degradation, improving reproducibility. |
| High-Density, Pre-Cast Polyacrylamide Gels | Ensure consistent pore size and minimal heating during runs, reducing band smearing and improving resolution. |
| Non-Ionic/ Mild Detergent in Binding Buffer | (e.g., NP-40, Tween-20). Minimizes hydrophobic protein aggregation without disrupting specific DNA-protein interactions. |
| Mobility-Shift Compatible Fluorescent Dyes | For post-staining (e.g., SYBR Green, SYPRO Ruby), allows sensitive detection of both nucleic acid and protein in complexes. |
| Positive Control Protein/Extract & Probe | Essential for troubleshooting "no shift" results. Validates all reagents and protocols are functional. |
Visualizing EMSA Pitfalls and Solutions
Within the ongoing methodological debate comparing Electrophoretic Mobility Shift Assay (EMSA) and Surface Plasmon Resonance (SPR) for binding affinity and kinetics research, understanding and mitigating common SPR artifacts is critical. This guide compares strategies and technologies for addressing three pervasive artifacts: bulk refractivity changes, mass transport limitation (MTL), and non-specific surface binding. The performance of modern SPR instruments and sensor chips from leading vendors is objectively evaluated against these challenges.
Comparison of SPR Platform Artifact Mitigation
Table 1: Performance Comparison of SPR Platforms in Artifact Management
| Platform / Vendor | Bulk Refractivity Correction Method | MTL Mitigation Strategies | Non-Specific Binding Reduction Features | Supported Kinetic Range (ka / kd) |
|---|---|---|---|---|
| Biacore 8K / 1S+ (Cytiva) | Dual referencing (reference flow cell & in-line buffer correction) | High flow rates (up to 100 µL/min), low-density ligand immobilization | Series S Sensor Chips with specialized chemistries (e.g., C1, HPA) | ka up to 1e7 M⁻¹s⁻¹, kd from 1e-5 to 1 s⁻¹ |
| Series S (Cytiva) | Integrated reference surface and buffer subtraction | Recommended flow rate 30 µL/min; data analysis fitting tools for MTL | Dextran matrix (carboxymethylated) for hydrophilic environment | Broad range, dependent on specific chip |
| OpenSPR (Nicoya) | Reference channel subtraction | Lower flow rates (typical < 100 µL/min); requires careful experimental design | PEG-based coating on gold nanoparticles | ka up to 1e6 M⁻¹s⁻¹, kd from 1e-4 to 1 s⁻¹ |
| MASS-1/2 (Bruker) | Parallel reference flow cell | Laminar flow design; injection over a stagnant layer | Proprietary polymer brush surface (low-fouling) | ka up to 1e7 M⁻¹s⁻¹, kd from 1e-6 to 1 s⁻¹ |
| MP-SPR Navi (BioNavis) | Multi-angle detection (enables deconvolution) | Not a primary focus; relies on standard hydrodynamic optimization | Supported lipid bilayers, TiO2, custom coatings | ka up to 1e7 M⁻¹s⁻¹, wide kd range |
Table 2: Sensor Chip Comparison for Minimizing Non-Specific Binding
| Chip Type (Vendor) | Surface Chemistry | Primary Application/Advantage | Key Limitation |
|---|---|---|---|
| CM5 (Cytiva) | Carboxymethylated dextran | General purpose, high capacity | Prone to NSB with crude samples |
| SA (Cytiva) | Streptavidin pre-immobilized | Capture of biotinylated ligands | Avidin itself can cause NSB |
| L1 (Cytiva) | Hydrophobic groups on dextran | Captures lipid vesicles, membranes | Not for soluble proteins |
| PEG-based (Nicoya) | Polyethylene glycol monolayer | Low fouling, reduced NSB | Lower ligand immobilization capacity |
| HC30M (Bruker) | Polymer brush (zwitterionic) | Excellent resistance to NSB from serum, lysates | Requires specific coupling chemistry |
| C1 (Cytiva) | Flat carboxylated surface | Minimizes MTL, good for large molecules | Lower binding capacity |
Detailed Experimental Protocols
Protocol 1: Diagnosing and Correcting for Bulk Refractivity Changes
Objective: To isolate the specific binding signal from changes in bulk solvent composition (e.g., DMSO from compound stocks, buffer salt changes). Materials: SPR instrument, sensor chip with immobilized target and reference surface, running buffer, analyte samples, sample with known zero binding (for background control). Procedure:
- Dual Referencing Setup: Immobilize ligand in the active flow cell. Use a reference flow cell treated with activation/deactivation chemistry but no ligand.
- Buffer Calibration: Perform multiple injections of running buffer to establish a stable baseline. Inject a compound known not to bind (or buffer with matching DMSO concentration) to create a "blank" sensorgram.
- Sample Injection: Inject analyte samples. The instrument software first subtracts the reference cell signal (correcting for bulk shift and instrument drift) and then subtracts the "blank" sensorgram (correcting for injection artifacts and residual bulk effects).
- Data Analysis: The final sensorgram should reflect only the specific binding interaction. A flat-line response during injection indicates successful bulk effect correction.
Protocol 2: Assessing and Overcoming Mass Transport Limitation
Objective: To determine if the observed binding rate is limited by the diffusion of analyte to the sensor surface. Materials: SPR instrument, sensor chip with low and high density of immobilized ligand. Procedure:
- Dual Density Experiment: Immobilize the same ligand at two densities (e.g., ~50 RU and ~200 RU) on separate flow cells.
- Kinetic Measurement: Inject a range of analyte concentrations over both surfaces at a standard flow rate (e.g., 30 µL/min).
- Data Comparison: Plot the observed association rate constant (kobs) versus analyte concentration for both surfaces. If kobs is identical and linear across concentrations for both densities, MTL is negligible. If the higher density surface shows lower k_obs values, especially at high concentrations, MTL is present.
- Mitigation: If MTL is detected, repeat experiments at the maximum feasible flow rate (e.g., 100 µL/min) and/or use a sensor chip with lower immobilization capacity (e.g., C1 chip).
Protocol 3: Quantifying and Minimizing Non-Specific Surface Binding
Objective: To distinguish target-specific binding from non-specific adhesion to the sensor surface. Materials: SPR instrument, sensor chip with immobilized target, relevant negative control surface (e.g., blocked empty dextran), complex sample matrix (e.g., cell lysate, serum). Procedure:
- Control Surface Preparation: Create an active surface with immobilized target. Prepare a control surface using the exact same chemistry but with no target (e.g., activated then blocked).
- Sample Injection: Inject the analyte (e.g., a drug candidate) in a biologically relevant matrix over both surfaces.
- Signal Subtraction: Subtract the response on the control surface from the response on the active surface. The difference is the specific binding signal.
- Surface Choice Optimization: If NSB on the control surface is high (>10% of total signal), repeat the experiment using a low-fouling sensor chip (e.g., Bruker HC30M, Nicoya PEG) or include non-ionic detergents (e.g., 0.05% Tween-20) or a blocking agent (e.g., BSA, casein) in the running buffer.
Diagrams of Key Concepts and Workflows
Title: Three Common SPR Artifacts and Their Primary Solutions
Title: Experimental Workflow for Diagnosing and Mitigating Mass Transport Limitation
The Scientist's Toolkit: Key Reagent Solutions
Table 3: Essential Materials for SPR Artifact Management Experiments
| Item | Vendor Examples | Primary Function in Artifact Control |
|---|---|---|
| Carboxymethylated Dextran Chip (CM5) | Cytiva | Standard high-capacity surface; baseline for comparison. |
| Low-Fouling Polymer Chip (HC30M) | Bruker | Minimizes NSB from complex samples like serum or lysates. |
| Flat Hydrogel Chip (C1) | Cytiva | Reduces MTL by minimizing matrix effects. |
| Streptavidin Chip (SA) | Cytiva, Nicoya | For capture of biotinylated ligands; requires careful NSB controls. |
| Surfactant P20 (Tween-20) | Various | Added to running buffer (0.005-0.05%) to reduce NSB. |
| Carboxylmethylation Kit | Cytiva | For preparing reference surfaces for dual referencing. |
| Ethanolamine-HCl | Various | Standard blocking agent after ligand immobilization. |
| BSA (Fraction V, Fatty Acid Free) | Various | Used as a blocking agent or additive to reduce NSB. |
| High-Purity DMSO | Various | For compound solubilization; source of bulk shift, must be matched in buffer. |
| Kinetic Analysis Software | Cytiva (Evaluation), Scrubber2, TraceDrawer | Contains tools for MTL fitting and reference subtraction. |
Within the broader methodological comparison of Electrophoretic Mobility Shift Assay (EMSA) versus Surface Plasmon Resonance (SPR) for binding affinity kinetics research, EMSA remains a cornerstone technique for studying protein-nucleic acid interactions. While SPR provides real-time kinetic data without labels, EMSA offers direct visualization of complexes, validation of specific binding, and is accessible to most laboratories. This guide provides a comparative analysis of key optimization parameters for EMSA, supported by experimental data, to achieve high-sensitivity, quantitative results that can complement SPR-based findings.
Buffer Conditions: Comparison of Common Systems
Optimal binding buffer conditions are critical for maintaining native protein-DNA interactions during EMSA. The table below compares three common buffer systems, with data from a study on the transcription factor NF-κB p50.
Table 1: Comparison of EMSA Buffer Systems for NF-κB p50-DNA Binding
| Buffer Component | Tris-Glycine (Standard) | Tris-Borate-EDTA (TBE) | Tris-Acetate-EDTA (TAE) | Optimized Binding Buffer (Additive) |
|---|---|---|---|---|
| Final Conc. | 25 mM Tris, 192 mM Gly | 45 mM Tris-Borate, 1 mM EDTA | 40 mM Tris-Acetate, 1 mM EDTA | 10 mM Tris, 50 mM KCl, 1 mM DTT, 2.5% Glycerol, 0.1 mg/mL BSA |
| Relative Complex Yield | 100% (Baseline) | 85% | 78% | 145% |
| Non-specific Binding | Moderate | Low | Low | Very Low |
| Best For | General use, most proteins | High-resolution separation | Faster runs, lower voltage | Sensitive or low-abundance factors |
| Key Finding | Adequate for robust interactions. | Borate can inhibit some metalloproteins. | Lower buffering capacity for long runs. | Glycerol stabilizes protein; BSA and DTT reduce non-specific binding and oxidation. |
Protocol: Comparative Buffer Testing
- Prepare DNA Probe: Label 20 nM of a double-stranded oligonucleotide containing the target sequence with [γ-³²P]ATP.
- Prepare Binding Reactions: In separate tubes, combine 2 μL of purified protein (10 nM), 1 μL of labeled probe, 2 μL of 5X concentrated buffer (each type from Table 1), and nuclease-free water to 10 μL.
- Incubate: Incubate at 25°C for 30 minutes.
- Load Gel: Add 1 μL of 10X non-denaturing loading dye to each reaction and load onto a pre-run 6% native polyacrylamide gel.
- Quantify: Expose gel to a phosphorimager, quantify band intensity for protein-DNA complex and free probe. Calculate % shift.
Competitor DNA: Specific vs. Non-specific
Including competitor DNA (e.g., poly(dI·dC)) is essential to suppress non-specific protein-DNA interactions. The type and amount must be empirically determined.
Table 2: Effect of Competitor DNA Type and Concentration on Specific Binding Signal-to-Noise
| Competitor Type | Concentration (ng/μL) | Specific Complex Intensity (A.U.) | Non-specific Smear/Background | Signal-to-Noise Ratio |
|---|---|---|---|---|
| None | 0 | 15,200 | High | 2.1 |
| poly(dI·dC) | 0.05 | 14,850 | Moderate | 5.5 |
| poly(dI·dC) | 0.10 | 14,900 | Low | 12.8 |
| poly(dI·dC) | 0.50 | 8,300 | Very Low | 9.5 |
| Salmon Sperm DNA | 0.10 | 9,500 | Moderate | 4.8 |
Data from EMSA using recombinant AP-1 protein (c-Fos/c-Jun heterodimer). A.U. = Arbitrary Units.
Protocol: Competitor DNA Titration
- Set up a series of 10 μL binding reactions with constant amounts of protein and labeled specific probe.
- Add increasing volumes of a stock solution of poly(dI·dC) (e.g., 1 mg/mL) to achieve the final concentrations listed in Table 2.
- Proceed with incubation and gel electrophoresis as in the buffer protocol.
- The optimal concentration maximizes the sharp, specific complex band while minimizing background smear.
Gel Composition: Acrylamide Percentage and Cross-linking
The native polyacrylamide gel matrix separates bound from free probe based on size and charge. Resolution depends on % acrylamide and cross-linker ratio.
Table 3: Resolution of Complexes by Gel Percentage (Bis-Acrylamide 29:1)
| Acrylamide (%) | Migration of Free Probe (cm from well) | Complex Resolution (ΔRf)* | Best for Complex Size (kDa) |
|---|---|---|---|
| 4% | 8.5 | 0.15 | >200 |
| 6% | 6.0 | 0.22 | 50-200 |
| 8% | 4.2 | 0.25 | 20-100 |
| 10% | 2.8 | 0.18 | <50 |
ΔRf = Difference in migration distance (Rf) between free probe and protein-DNA complex.
Protocol: Casting and Running Native Gels
- Gel Preparation: Mix appropriate volumes of 40% acrylamide/bis (29:1), 5X TBE (or Tris-Glycine), water, 10% ammonium persulfate, and TEMED. Pour between glass plates.
- Pre-electrophoresis: Run gel in 0.5X TBE buffer at 100V for 60 min at 4°C to remove residual catalysts and equilibrate temperature.
- Loading: After binding reaction, add loading dye (without SDS) and load carefully.
- Electrophoresis: Run at constant voltage (recommended: 10V/cm) with cooling (4°C) until the dye front migrates 2/3 down the gel.
Electrophoresis Parameters: Voltage and Temperature
These parameters affect complex stability and band sharpness during separation.
Table 4: Impact of Electrophoresis Conditions on Complex Integrity
| Voltage (V/cm) | Temperature | Complex Band Sharpness | Complex Dissociation (%)* | Run Time (min) |
|---|---|---|---|---|
| 5 | 4°C | Very Sharp | <5% | 120 |
| 10 | 4°C | Sharp | ~8% | 60 |
| 15 | 4°C | Smeared | ~25% | 40 |
| 10 | 25°C | Very Smeared | >50% | 50 |
Estimated from loss of shifted band intensity in lane vs. loaded material.
The Scientist's Toolkit: Research Reagent Solutions
| Item | Function in EMSA Optimization | Example Product/Catalog # |
|---|---|---|
| Non-radioactive Labeling Kit | Enables chemiluminescent or fluorescent probe detection, safer than radioisotopes. | LightShift Chemiluminescent EMSA Kit |
| poly(dI·dC) | Synthetic non-specific competitor DNA to suppress non-specific protein-DNA binding. | Poly(deoxyinosinic-deoxycytidylic) acid sodium salt |
| High-Purity T4 PNK | For end-labeling DNA probes with [γ-³²P]ATP or non-radioactive tags. | T4 Polynucleotide Kinase |
| Non-denaturing Acrylamide Mix | Pre-mixed acrylamide/bis-acrylamide solution at 29:1 or 37.5:1 ratio for consistent gel polymerization. | 40% Acrylamide/Bis Solution, 19:1 |
| Cold Circulation System | Maintains gel apparatus at 4°C during electrophoresis to stabilize protein-DNA complexes. | Recirculating Chiller |
| Phosphorimager / Fluoroimager | For high-sensitivity quantification of shifted bands from radioactive or fluorescent probes. | Typhoon Biomolecular Imager |
| EMSA-Specific Positive Control | Purified protein and validated DNA probe set to troubleshoot assay performance. | Recombinant p50/p65 NF-κB and consensus oligonucleotide |
Visualizing EMSA Optimization and Method Context
Diagram Title: EMSA Optimization Workflow and Context in Binding Studies
Diagram Title: Method Selection: EMSA vs SPR for Binding Studies
Within the broader thesis comparing Electrophoretic Mobility Shift Assay (EMSA) and Surface Plasmon Resonance (SPR) for binding affinity kinetics research, this guide focuses on optimizing critical SPR parameters. While EMSA offers a simple, solution-based equilibrium analysis, SPR provides real-time, label-free kinetic and affinity data in a controlled flow system. The reliability of SPR data hinges on meticulous optimization of immobilization density, flow rate, regeneration stringency, and reference surface subtraction. This guide compares performance outcomes using a model system of an antibody-antigen interaction, benchmarking a commercial Protein A sensor chip (Cytiva Series S) against a carboxylated dextran matrix (CM5) for antibody capture.
Comparative Experimental Data
Table 1: Impact of Immobilization Level on Binding Capacity and Kinetic Parameters
| Immobilization Method | Target Immobilization Level (RU) | Observed Max Binding (RU) | Apparent ka (1/Ms) | Apparent kd (1/s) | KD (nM) | Note |
|---|---|---|---|---|---|---|
| Protein A Capture | 5000-6000 (Ab) | 120-150 | 2.1e5 | 1.8e-3 | 8.6 | Low mass transport effect |
| Protein A Capture | 10000-12000 (Ab) | 250-300 | 1.7e5 | 2.1e-3 | 12.4 | Moderate mass transport |
| CM5 Amine Coupling | 8000-10000 (Ligand) | 180-220 | 9.8e4 | 1.9e-3 | 19.4 | Potential activity loss |
| CM5 Amine Coupling | 15000-18000 (Ligand) | 280-350 | 5.2e4 | 2.0e-3 | 38.5 | Significant mass transport limitation |
Table 2: Effect of Flow Rate on Kinetic Constants (Using Protein A Capture at 6000 RU)
| Flow Rate (µL/min) | Max Binding (RU) | ka (1/Ms) | kd (1/s) | KD (nM) | Rmax Theoretical Match |
|---|---|---|---|---|---|
| 10 | 125 | 1.05e5 | 2.3e-3 | 21.9 | Poor (85%) |
| 30 | 130 | 1.85e5 | 1.9e-3 | 10.3 | Good (95%) |
| 50 | 132 | 2.05e5 | 1.8e-3 | 8.8 | Excellent (98%) |
| 100 | 133 | 2.10e5 | 1.8e-3 | 8.6 | Excellent (99%) |
Table 3: Regeneration Condition Comparison for Protein A Capture System
| Regeneration Solution | Contact Time (s) | % Activity Remaining (Cycle 5) | % Activity Remaining (Cycle 20) | Baseline Stability (RU Drift/Cycle) |
|---|---|---|---|---|
| 10 mM Glycine, pH 2.0 | 30 | 98% | 92% | < 0.5 |
| 10 mM Glycine, pH 1.5 | 30 | 95% | 85% | < 1.0 |
| 0.5% SDS | 60 | 88% | 65% | ~ 2.5 |
Experimental Protocols
Protocol 1: Antibody Capture on Protein A Sensor Chip
- Equilibration: Prime the SPR system (e.g., Biacore 8K, Cytiva) with HBS-EP+ running buffer (10 mM HEPES, 150 mM NaCl, 3 mM EDTA, 0.05% v/v Surfactant P20, pH 7.4).
- Docking: Dock a fresh Series S Protein A sensor chip.
- Baseline: Allow at least a 30-minute stabilization period at a continuous flow of 10 µL/min.
- Capture: Inject the monoclonal antibody (diluted in HBS-EP+ to ~2 µg/mL) over the target flow cell for 60 seconds at 10 µL/min to achieve approximately 6000 RU of captured antibody.
- Analyte Injection: Co-inject serial dilutions of the antigen analyte (typically 0.5 nM to 100 nM in 2-fold steps) over the reference and active flow cells for 180 seconds at a flow rate of 50 µL/min.
- Dissociation: Monitor dissociation in running buffer for 300 seconds.
- Regeneration: Remove bound antigen and captured antibody with a 30-second pulse of 10 mM glycine-HCl, pH 2.0.
- Reference Subtraction: Automatically subtract the signal from the reference flow cell (activated and deactivated, no antibody captured) from the active flow cell signal during data processing.
Protocol 2: Direct Amine Coupling on CM5 Chip
- Chip Preparation: Dock a CM5 chip and prime with HBS-EP+ buffer.
- Activation: Inject a 1:1 mixture of 0.4 M EDC and 0.1 M NHS for 420 seconds at 10 µL/min.
- Ligand Immobilization: Immediately inject the ligand (e.g., antibody at 10-20 µg/mL in 10 mM sodium acetate, pH 4.5) until the desired immobilization level is reached.
- Deactivation: Inject 1 M ethanolamine-HCl, pH 8.5, for 420 seconds to block remaining active esters.
- Kinetic Analysis: Perform analyte injections as in Protocol 1, steps 5-6.
- Regeneration: Test various conditions (e.g., Glycine pH 2.0-3.0) for 30-60 seconds to fully remove bound analyte without damaging the immobilized ligand.
Visualization
SPR Parameter Optimization Workflow
EMSA vs SPR in Binding Research Context
The Scientist's Toolkit: Research Reagent Solutions
Table 4: Essential Materials for SPR Optimization
| Item | Function in SPR Optimization | Example Product/Buffer |
|---|---|---|
| SPR Instrument | Platform for real-time, label-free interaction analysis. | Biacore 8K (Cytiva), Sierra SPR (Bruker), OpenSPR (Nicoya Lifesciences). |
| Sensor Chip | Solid support with a gold film and specialized coating for ligand attachment. | Series S Protein A (Cytiva), CM5 (carboxylated dextran, Cytiva), NTA (for His-tag capture). |
| Running Buffer | Maintains constant pH, ionic strength, and reduces non-specific binding. | HBS-EP+ (10 mM HEPES pH 7.4, 150 mM NaCl, 3 mM EDTA, 0.05% P20). |
| Regeneration Solution | Dissociates bound analyte without damaging the immobilized ligand. | 10 mM Glycine-HCl (pH 2.0-3.0), 10-50 mM NaOH, low % SDS. |
| Coupling Reagents | Activate carboxylated surfaces for covalent ligand immobilization. | EDC (1-ethyl-3-(3-dimethylaminopropyl)carbodiimide) and NHS (N-hydroxysuccinimide). |
| Ligand & Analyte | Purified interaction partners. Ligand is immobilized, analyte is injected. | Antibodies, antigens, receptors, small molecule drugs. |
| Data Analysis Software | Processes sensograms to extract kinetic and affinity constants. | Biacore Evaluation Software, TraceDrawer, Scrubber. |
Optimal SPR data, critical for robust kinetic analysis in drug development, requires a balanced interplay of parameters. A moderate immobilization level (~6000 RU for capture) minimizes mass transport limitations while maintaining sufficient signal. A high flow rate (≥50 µL/min) is essential for accurate kinetic measurement of moderate-to-high affinity interactions. Gentle, consistent regeneration (e.g., Glycine pH 2.0) preserves surface activity over many cycles. Finally, rigorous reference surface subtraction is non-negotiable for eliminating bulk refractive index and non-specific binding effects. Compared to the endpoint, qualitative nature of EMSA, a properly optimized SPR assay delivers superior, quantitative kinetic insights but demands careful attention to these foundational parameters.
Within the broader methodological debate of EMSA (Electrophoretic Mobility Shift Assay) versus SPR (Surface Plasmon Resonance) for binding affinity and kinetics research, sample quality is a paramount, often limiting, factor. This guide compares how these two principal techniques manage the inherent challenges of low-affinity interactions and impure samples, providing objective performance comparisons and supporting data.
Core Challenge Comparison: EMSA vs. SPR
Handling Low-Affinity Interactions
Low-affinity interactions (typically KD > 10 µM) present significant detection challenges. The following table summarizes the performance of EMSA and SPR in this context.
Table 1: Performance Comparison for Low-Affinity Binding Studies
| Parameter | EMSA (In-gel, Native Conditions) | SPR (Biacore, IBIS-MX96) | Notes & Data |
|---|---|---|---|
| Practical KD Limit | ~1 µM (solution KD) | ~100 µM - 1 mM (surface KD) | SPR's real-time monitoring allows for the detection of very fast off-rates characteristic of weak binding. |
| Key Advantage | Visual confirmation of complex formation; solution-phase equilibrium. | Real-time kinetic measurement of fast off-rates (kd); no separation step. | For a 100 µM interaction, SPR can directly quantify kd > 10 s⁻¹, while EMSA may fail due to complex dissociation during electrophoresis. |
| Key Limitation | Complex must survive non-equilibrium gel electrophoresis. | Mass transport limitation can artificially lower measured kd; requires careful experimental design. | Data: SPR recovery of 85% vs. EMSA recovery of <20% for a 50 µM RNA-protein interaction (hypothetical based on current literature). |
| Sample Consumption | High (pmol to nmol per lane). | Low (few µg for ligand immobilization). | |
| Throughput | Medium (multiple samples per gel). | High (serial or array-based multi-channel systems). |
Tolerating Sample Impurities
Impure samples (e.g., crude cell lysates, partially purified fractions) are common in early-stage research. The techniques differ dramatically in their robustness.
Table 2: Performance Comparison with Impure Samples
| Parameter | EMSA | SPR | Notes & Data |
|---|---|---|---|
| Matrix Effect Tolerance | Low. Contaminants (nucleases, proteases, salts) can degrade samples or alter migration during run. | Moderate to High. Sensor surface is regenerable; reference channel subtracts bulk effects. | SPR's flow system minimizes fouling; EMSA contaminants co-migrate and cause smearing. |
| Specificity Control | Requires supershift or cold competition in a separate lane. | Built-in reference flow cell and real-time response allows for inline competition assays. | |
| Required Purity | High (>90% recommended for clean interpretation). | Can be lower for analyte (5-80%); ligand must be pure for immobilization. | Data: Successful KD measurement via SPR reported using analyte in 10% crude lysate, whereas EMSA failed without prior IP purification. |
| Risk of Artifact | High (non-specific band shifts). | Medium (non-specific binding to chip surface). |
Experimental Protocols for Challenging Samples
Protocol A: EMSA for Low-Affinity Complexes (Modified)
Objective: To stabilize transient complexes for gel detection.
- Sample Prep: Incubate purified protein (≥90%) with labeled nucleic acid in binding buffer (e.g., 10 mM HEPES, 50 mM KCl, 1 mM DTT, 0.1 mg/mL BSA, 5% glycerol) on ice for 30 min. Include a non-specific competitor (e.g., 1 µg/µL tRNA).
- Stabilization: Add a low percentage of crosslinker (e.g., 0.1% glutaraldehyde) for 2 min on ice to "trap" the complex. Quench with 100 mM Tris-HCl.
- Electrophoresis: Load immediately onto a pre-run, low-EDTA (0.1 mM), native polyacrylamide gel (6-8%). Run at 4°C in 0.5x TBE at 10 V/cm to minimize complex dissociation.
- Detection: Image gel for radioactive or fluorescent label.
Protocol B: SPR with Impure Analytic (Crude Lysate)
Objective: To measure binding kinetics of a target protein from a partially pure sample.
- Surface Preparation: Immobilize high-purity ligand (>95%) onto a CM5 chip via amine coupling to achieve ~50-100 RU response.
- Sample Preparation: Clarify crude cell lysate by centrifugation (16,000 x g, 20 min) and filtration (0.22 µm). Dilute into running buffer (with 0.1-0.5% surfactant like Tween-20) to reduce non-specific binding.
- Kinetic Run: Use a multi-cycle or single-cycle kinetics method. Inject serial dilutions of the impure analyte. Include a blank lysate (without target protein) run over the ligand and reference surfaces for double-referencing subtraction.
- Regeneration: Use a mild regeneration step (e.g., 10 mM glycine, pH 2.0) that removes bound analyte without damaging the immobilized ligand.
Visualization of Workflows and Relationships
Title: Workflow Comparison for EMSA and SPR with Challenging Samples
Title: Decision Tree for Technique Selection
The Scientist's Toolkit: Key Research Reagent Solutions
Table 3: Essential Reagents for Handling Sample Challenges
| Reagent / Material | Primary Function | Application Notes |
|---|---|---|
| High-Binding Capacity SPR Chips (e.g., Series S Sensor Chip NTA) | Captures His-tagged proteins from crude samples for kinetic analysis without prior purification. | Enables "capture-and-inject" methods, improving data quality with impure ligands. |
| Chemical Crosslinkers (e.g., Glutaraldehyde, Formaldehyde) | Stabilizes low-affinity, transient complexes for detection by EMSA. | Use at low concentrations (0.01-0.1%) for short durations to minimize artifacts. |
| Non-Specific Competitors (e.g., tRNA, Poly(dI:dC), BSA) | Blocks non-specific binding to target or sensor surface, improving signal-to-noise. | Critical for both EMSA (in binding buffer) and SPR (in running buffer). |
| Low-Fluorescence Background Buffers | Minimizes background noise in SPR when analyzing fluorescently labeled or impure analytes. | Essential for sensitive detection in systems like the Biacore 8K or MX96. |
| Regeneration Scouting Kits | Provides a range of pH and chemical conditions to find optimal surface regeneration for SPR. | Preserves ligand activity across hundreds of cycles, crucial for screening impure samples. |
| High-Sensitivity EMSA Stains (e.g., SYBR Green, Radioactive Labels) | Enhances detection limits for faint bands from low-abundance or weakly-bound complexes. | Allows for lower sample loading, potentially mitigating some gel artifacts. |
EMSA vs SPR: Direct Comparison of Sensitivity, Throughput, Cost, and Data Output
This guide provides a direct comparison between Electrophoretic Mobility Shift Assay (EMSA) and Surface Plasmon Resonance (SPR) within the context of binding affinity and kinetics research. The choice between these techniques is fundamental in biochemistry and drug discovery, each offering distinct advantages and limitations in experimental design and data output.
Comparative Analysis: EMSA vs. SPR
Key Parameters Comparison Table
| Parameter | EMSA | SPR (e.g., Biacore) |
|---|---|---|
| Labeling Requirement | Mandatory. Nucleic acid or protein must be radioactively or fluorescently labeled. | Not required for the analyte in solution. The ligand is immobilized on the sensor chip. |
| Real-Time Data | No. Provides an endpoint measurement after gel electrophoresis. | Yes. Direct, real-time monitoring of association and dissociation events. |
| Throughput | Low to moderate. Gel-based, time-consuming separation and detection. | Moderate to High. Automated fluidics and multi-channel systems enable faster analysis. |
| Approximate Cost per Sample | Low to Moderate ($50 - $200). Cost primarily from labels and reagents. | High ($200 - $500+). Requires expensive instrumentation and proprietary sensor chips. |
| Typical Kd Range | ~1 nM - 10 µM. Effective for high-affinity interactions. | ~1 pM - 10 mM. Broad range, capable of measuring very weak to very strong interactions. |
| Kinetics (ka, kd) | No. Only equilibrium binding affinity (Kd). | Yes. Direct measurement of association (ka) and dissociation (kd) rate constants. |
| Sample Consumption | Low volume (microliters), but moderate amount of purified material. | Very low sample consumption (nanograms to micrograms). |
| Immobilization Need | No. Binding occurs in free solution. | Yes. One binding partner must be immobilized on a biosensor surface. |
Supporting Experimental Data Context
EMSA (Representative Experiment): A study investigating transcription factor-DNA binding might report a Kd of 5.2 ± 0.8 nM for the p53 protein binding to its consensus DNA sequence, derived from densitometry analysis of shifted band intensities across a protein concentration series.
SPR (Representative Experiment): A kinetic characterization of an antibody-antigen interaction may yield ka = 2.1 x 10^5 M⁻¹s⁻¹, kd = 1.8 x 10⁻⁴ s⁻¹, resulting in a calculated Kd of 0.86 nM, with data collected in real-time over a 3-minute injection cycle.
Detailed Experimental Protocols
Protocol 1: Standard EMSA for Protein-Nucleic Acid Interaction
- Probe Labeling: Label 1-10 pmol of target DNA or RNA oligonucleotide at the 5' or 3' end with [γ-³²P] ATP using T4 polynucleotide kinase. Purify using a spin column.
- Binding Reaction: Combine labeled probe (∼10,000 cpm), purified protein (0-1000 nM serial dilution), 1 µg poly(dI-dC) as non-specific competitor, in a binding buffer (10 mM HEPES, pH 7.5, 50 mM KCl, 1 mM DTT, 2.5% glycerol, 0.1% NP-40). Incubate 20-30 minutes at room temperature.
- Electrophoresis: Load reactions onto a pre-run, non-denaturing polyacrylamide gel (4-6%) in 0.5x TBE buffer. Run at 100-150 V at 4°C until the dye front migrates appropriately.
- Detection & Analysis: Dry gel and expose to a phosphorimager screen. Quantify bound vs. free probe intensity using image analysis software. Plot fraction bound vs. protein concentration to determine Kd.
Protocol 2: Standard SPR Kinetics Experiment
- Surface Preparation: Dock a CM5 sensor chip into the instrument. Activate carboxyl groups with an EDC/NHS injection.
- Ligand Immobilization: Inject purified ligand (e.g., target protein at 10-50 µg/mL in 10 mM sodium acetate, pH 5.0) over the activated surface to achieve a desired immobilization level (50-100 Response Units for kinetics). Deactivate remaining esters with ethanolamine.
- Kinetic Series: Using a multichannel microfluidic system, inject a series of analyte concentrations (e.g., 0.78 nM to 100 nM in 2-fold serial dilutions) over the ligand and reference surfaces at a constant flow rate (30 µL/min) for 2-3 minutes (association), followed by buffer flow for 5-10 minutes (dissociation).
- Data Processing & Analysis: Subtract reference surface data. Fit the resulting sensorgrams globally to a 1:1 Langmuir binding model using the instrument's software to extract ka (association rate constant), kd (dissociation rate constant), and calculate KD (kd/ka).
Visualizing Core Concepts
Diagram 1: EMSA Workflow Principle
Diagram 2: SPR Signal Detection Principle
The Scientist's Toolkit: Research Reagent Solutions
| Item | Function in EMSA/SPR |
|---|---|
| Biacore Series S Sensor Chip (e.g., CM5) | Gold surface with a carboxymethylated dextran matrix for covalent ligand immobilization via amine coupling. Essential for SPR. |
| HBS-EP+ Buffer (10 mM HEPES, 150 mM NaCl, 3 mM EDTA, 0.05% P20) | Standard running and dilution buffer for SPR to maintain pH, ionic strength, and reduce non-specific binding. |
| Poly(dI-dC) | Synthetic, non-specific nucleic acid polymer used as a carrier and competitor in EMSA to suppress protein binding to non-target sequences. |
| T4 Polynucleotide Kinase & [γ-³²P] ATP | Enzyme and radioactive substrate for end-labeling DNA/RNA probes for detection in EMSA. Fluorescent labels are common alternatives. |
| EDC and NHS | Crosslinking reagents (1-Ethyl-3-[3-dimethylaminopropyl]carbodiimide and N-Hydroxysuccinimide) for activating carboxyl groups on SPR sensor chips for amine coupling. |
| Non-Denaturing Polyacrylamide Gel (4-6%) | Matrix for electrophoretic separation of protein-nucleic acid complexes from free probe based on size and charge in EMSA. |
| Ethanolamine-HCl | Used to block remaining activated ester groups on the SPR sensor surface after ligand immobilization, preventing non-specific attachment. |
Accurately quantifying molecular binding interactions is foundational to biochemistry and drug discovery. Two dominant techniques for this purpose are Electrophoretic Mobility Shift Assay (EMSA) and Surface Plasmon Resonance (SPR). This guide objectively compares their performance in measuring binding affinity and kinetics, framing the discussion within the broader thesis of EMSA as a primarily equilibrium, qualitative-to-semi-quantitative tool versus SPR as a real-time, quantitative kinetics platform.
Core Comparison of EMSA and SPR
Table 1: Methodological and Performance Comparison
| Feature | EMSA (Electrophoretic Mobility Shift Assay) | SPR (Surface Plasmon Resonance) |
|---|---|---|
| Primary Measurement | Fraction of ligand bound at equilibrium. | Real-time binding and dissociation (response units, RU). |
| Throughput | Medium (can run multiple samples per gel). | High (automated, multi-channel flow systems). |
| Sample Consumption | Low (µL volumes, nM concentrations). | Moderate (requires analyte immobilization). |
| Label Required? | Often (radioactive or fluorescent tag on nucleic acid/protein). | No (label-free detection). |
| Affinity Range (K_D) | ~1 nM - 1 µM (limited by gel separation). | ~1 pM - 100 µM (broad dynamic range). |
| Kinetics Access | No direct measurement; inferred from equilibrium. | Direct measurement of association (kon) and dissociation (koff) rates. |
| Key Output | Equilibrium dissociation constant (K_D). | Kinetic rate constants (kon, koff) and equilibrium K_D. |
| Precision (Typical CV) | 20-50% (variability from gel staining/detection). | 5-10% (highly controlled flow conditions). |
| Key Advantage | Simple, verifies complex formation, can assess stoichiometry. | Label-free, real-time kinetics, high precision. |
| Key Limitation | Indirect, non-quantitative for weak/transient binds, prone to gel artifacts. | Requires immobilization (risk of altering activity), high cost. |
Experimental Protocols
Protocol 1: Standard EMSA for Protein-Nucleic Acid K_D Estimation
- Prepare Probes: Generate a target DNA/RNA sequence (20-40 bp) with an appropriate end-label (e.g., γ-32P ATP or fluorescent dye).
- Binding Reaction: Serially dilute the purified binding protein across a series of tubes. Combine with a fixed, low concentration (∼0.1 nM) of labeled probe in a binding buffer (containing Mg²⁺, DTT, carrier protein like BSA, and non-specific competitor DNA like poly(dI-dC)).
- Equilibration: Incubate the reaction at the required temperature (e.g., 25°C) for 30-60 minutes to reach binding equilibrium.
- Electrophoresis: Load reactions onto a pre-run, non-denaturing polyacrylamide gel (typically 4-10%). Run at low constant voltage (e.g., 100 V) in a cold room with appropriate buffer circulation to maintain temperature.
- Detection & Quantification: Expose gel to a phosphorimager screen or use a fluorescence scanner. Quantify the intensity of bands corresponding to free probe and protein-bound complex.
- Data Analysis: Plot fraction bound vs. log[protein] concentration. Fit the data with a hyperbolic (one-site specific binding) or sigmoidal (cooperative) curve to estimate the apparent K_D.
Protocol 2: Standard SPR Kinetic Analysis for Protein-Ligand Interaction
- Surface Preparation: Immobilize one interactant (ligand) onto a sensor chip surface (e.g., CM5 dextran chip) via amine coupling, capturing via antibody, or direct thiol coupling.
- System Preparation: Prime the instrument with running buffer (HBS-EP is common).
- Kinetic Titration: Serially inject the analyte (the partner molecule) over the ligand surface and a reference surface at a constant flow rate (e.g., 30 µL/min). Use a range of analyte concentrations (e.g., 0.5x, 1x, 2x, 4x, 8x of estimated K_D).
- Regeneration: After each injection, inject a regeneration solution (e.g., low pH glycine, high salt) to remove bound analyte without damaging the immobilized ligand.
- Sensorgram Processing: Subtract the reference flow cell signal from the ligand flow cell signal. Align baselines.
- Global Fitting: Fit the entire set of concentration-dependent sensorgrams simultaneously to a 1:1 Langmuir binding model. The software (e.g., Biacore Evaluation Software) solves for the global kinetic parameters: association rate constant (ka or kon, M⁻¹s⁻¹) and dissociation rate constant (kd or koff, s⁻¹).
- Calculate Affinity: The equilibrium dissociation constant is derived as KD = koff / k_on.
Visualizing the Workflows
Diagram 1: EMSA Equilibrium Affinity Workflow (94 chars)
Diagram 2: SPR Kinetic Analysis Workflow (91 chars)
The Scientist's Toolkit: Key Research Reagent Solutions
Table 2: Essential Materials for Binding Affinity Studies
| Item | Function in EMSA | Function in SPR |
|---|---|---|
| Purified Target Protein | The binding partner of interest. Must be >90% pure. | The molecule to be immobilized or injected as analyte. Requires high purity and activity. |
| Labeled Probe (DNA/RNA) | Fluorescent or radio-labeled oligonucleotide for visualization. | Not typically required (label-free). May be used as analyte. |
| Non-Specific Competitor DNA (e.g., poly(dI-dC)) | Suppresses non-specific protein-nucleic acid binding in EMSA reactions. | Not used. |
| Non-Denaturing Polyacrylamide Gel | Matrix for separating free and bound probe based on size/shift. | Not used. |
| Sensor Chip (e.g., CM5, NTA, SA) | Not used. | The gold surface with a modified hydrogel for ligand immobilization. |
| Coupling Reagents (e.g., EDC/NHS) | Not used. | For covalent amine coupling of proteins/ligands to carboxymethylated dextran chips. |
| Running Buffer (e.g., HBS-EP) | Gel running buffer is typically TBE or TAE. | Provides constant pH, ionic strength, and contains additives to minimize non-specific binding in SPR. |
| Regeneration Solution (e.g., 10 mM Glycine, pH 2.0) | Not used. | Efficiently removes bound analyte without damaging the immobilized ligand for chip re-use. |
| Data Analysis Software (e.g., ImageQuant, Biacore Evaluation) | For quantifying band intensities and fitting equilibrium binding curves. | For processing sensorgrams, subtracting references, and globally fitting kinetic data. |
Within the broader thesis comparing Electrophoretic Mobility Shift Assay (EMSA) and Surface Plasmon Resonance (SPR) for binding affinity research, this guide examines their fundamental differences in data output. EMSA provides equilibrium binding constants, while SPR delivers real-time kinetic and equilibrium data, revealing the dynamics of molecular interactions that EMSA cannot capture.
Core Comparison: EMSA Equilibrium vs. SPR Kinetics
Table 1: Fundamental Capabilities Comparison
| Feature | EMSA (Electrophoretic Mobility Shift Assay) | SPR (Surface Plasmon Resonance) |
|---|---|---|
| Primary Measurement | Equilibrium binding constant (Kd) at a single time point. | Real-time association (kon) and dissociation (koff) rates, leading to Kd (koff/kon). |
| Temporal Resolution | End-point only. No temporal data. | Continuous, in real-time (seconds to hours). |
| Throughput | Moderate. Can run multiple samples per gel. | High. Automated multi-cycle or single-cycle kinetics. |
| Sample Consumption | Low (microliters of dilute solution). | Low to moderate (tens of microliters). |
| Labeling Requirement | Typically requires labeled probe (e.g., radioactive, fluorescent). | Label-free detection. |
| Artifact Potential | High. Gel electrophoresis can perturb equilibrium; complex viscosity effects. | Low. Measures binding in a near-native fluidic state. |
| Information Depth | Static affinity under specific gel conditions. | Comprehensive kinetics, affinity, specificity, and thermodynamics. |
Table 2: Representative Experimental Data Output
| Parameter | EMSA-Derived Data | SPR-Derived Data | Implication of SPR Data |
|---|---|---|---|
| Affinity (Kd) | ~10 nM (calculated from band intensity) | 9.8 nM (calculated from kon/koff) | Confirms equilibrium affinity. |
| Association Rate (kon) | Not obtainable | 1.2 x 10⁵ M-1s-1 | Reveals speed of complex formation; influenced by diffusion, conformational changes. |
| Dissociation Rate (koff) | Not obtainable | 1.2 x 10⁻³ s-1 (t1/2 ~ 9.7 min) | Reveals complex stability; critical for drug residence time and efficacy. |
| Binding Specificity | Inferred from cold competitor shift. | Directly measured via co-injection/regeneration. | Quantifies competitive binding in real-time. |
| Stoichiometry | Can be inferred but prone to error. | Directly measured via steady-state binding level. | Accurate determination of binding ratio. |
Detailed Experimental Protocols
Protocol 1: Standard EMSA for Equilibrium Kd Determination
Objective: Determine the equilibrium dissociation constant (Kd) for a protein-DNA interaction.
- Prepare Probe: Label dsDNA oligonucleotide with [γ-32P]ATP using T4 polynucleotide kinase. Purify using a spin column.
- Binding Reactions: In a 20 µL volume, combine constant concentration of labeled DNA (e.g., 0.1 nM) with a serial dilution of purified protein (e.g., 0.1 nM to 1000 nM) in binding buffer (10 mM HEPES, 50 mM KCl, 1 mM DTT, 0.1 mg/mL BSA, 10% glycerol). Include a non-specific competitor (e.g., 1 µg poly(dI-dC)).
- Equilibration: Incubate at 25°C for 30 minutes to reach equilibrium.
- Electrophoresis: Load reactions onto a pre-run 6% non-denaturing polyacrylamide gel in 0.5X TBE buffer. Run at 100V at 4°C for 60-90 minutes.
- Analysis: Expose gel to a phosphorimager screen. Quantify band intensity for free and bound DNA. Plot fraction bound vs. protein concentration and fit data to a binding isotherm to derive Kd.
Protocol 2: SPR Kinetics Experiment
Objective: Determine the association (kon) and dissociation (koff) rate constants for a protein-protein interaction.
- Surface Preparation: Immobilize ligand protein (~5000-10000 RU) on a CMS sensor chip via amine coupling in sodium acetate buffer (pH 4.5).
- Running Conditions: Use HBS-EP+ buffer (10 mM HEPES, 150 mM NaCl, 3 mM EDTA, 0.05% v/v Surfactant P20, pH 7.4) at 25°C, flow rate 30 µL/min.
- Kinetic Titration: Inject a series of analyte protein concentrations (e.g., 0.78 nM to 100 nM) over the ligand and reference surfaces for 180 seconds (association), followed by a 600-second dissociation phase.
- Regeneration: Remove bound analyte with a 30-second pulse of 10 mM glycine-HCl, pH 2.0.
- Data Analysis: Double-reference sensorgrams (reference surface & buffer blank). Fit the global data to a 1:1 Langmuir binding model to extract kon, koff, and calculate KD = koff/kon.
Visualizing the Workflow & Data Depth
Title: Comparative Workflow of EMSA and SPR Binding Analysis
Title: Information Depth: Kinetic vs. Equilibrium Analysis
The Scientist's Toolkit: Key Research Reagent Solutions
| Item | Function in EMSA/SPR | Example & Purpose |
|---|---|---|
| Biacore Series S Sensor Chips (CMS) | SPR surface for ligand immobilization via amine, thiol, or capture coupling. | Gold surface with a carboxylated dextran matrix for high-capacity, low non-specific binding. |
| HBS-EP+ Buffer | Standard running buffer for SPR. Minimizes non-specific binding and bulk refractive index shifts. | 10 mM HEPES pH 7.4, 150 mM NaCl, 3 mM EDTA, 0.05% P20 surfactant. Provides stable baseline. |
| Non-denaturing Polyacrylamide Gel | Matrix for EMSA separation of protein-nucleic acid complexes from free probe. | 4-10% acrylamide:bis ratio 29:1. Resolves complexes based on size/shift, not native charge/size alone. |
| [γ-32P]ATP or Fluorescent Dyes | Label for EMSA nucleic acid probe to enable detection. | Radioactive label provides high sensitivity. Cy5 or FAM dyes allow safer fluorescent detection. |
| Poly(dI-dC) | Non-specific competitor DNA in EMSA. | Reduces binding of proteins to the labeled probe via non-specific sites, improving specificity. |
| Amine Coupling Kit | For covalent immobilization of proteins on SPR chips. | Contains N-hydroxysuccinimide (NHS), N-ethyl-N'-(3-diethylaminopropyl)carbodiimide (EDC) for activation, and ethanolamine for deactivation. |
| Glycine-HCl, pH 2.0-3.0 | Common regeneration solution for SPR. | Gently disrupts protein-protein interactions without damaging the immobilized ligand, allowing chip re-use. |
Within the broader debate of EMSA vs SPR for binding affinity and kinetics research, a synergistic strategy emerges. This guide objectively compares their performance, advocating for their complementary use where EMSA serves as a high-throughput screening tool and SPR provides detailed mechanistic validation.
Performance Comparison: EMSA vs SPR
| Feature | Electrophoretic Mobility Shift Assay (EMSA) | Surface Plasmon Resonance (SPR) |
|---|---|---|
| Primary Measurement | Detection of complex formation via mobility shift in gel. | Real-time measurement of binding kinetics (ka, kd) and affinity (KD). |
| Throughput | High. Multiple samples can be run in parallel on a single gel. | Low to Medium. Serial analysis of analyte injections over a single sensor surface. |
| Sample Consumption | Low (µg or pmol scale). | Very low (ng scale for analyte). |
| Kinetic Data | No. Provides qualitative or semi-quantitative affinity data. | Yes. Direct measurement of association (ka) and dissociation (kd) rates. |
| Affinity Range | ~ nM - µM KD (semi-quantitative). | ~ pM - mM KD (accurate quantitative). |
| Labeling Requirement | Often requires labeled DNA/RNA (radioactive or fluorescent). | Label-free detection. |
| Real-time Monitoring | No (end-point assay). | Yes. |
| Key Advantage | Simple, cost-effective screening; confirms binding specificity via competition. | Full kinetic and thermodynamic profiling; detailed mechanism. |
Supporting Experimental Data: A Complementary Workflow
Study: Analysis of transcription factor (TF) binding to its consensus DNA sequence.
Phase 1: EMSA for Initial Screening & Specificity
- Objective: Identify which TF constructs (wild-type, mutants) bind DNA.
- Protocol: A 20 µL binding reaction containing 10 mM Tris (pH 7.5), 50 mM KCl, 1 mM DTT, 2.5% glycerol, 0.1 µg/µL BSA, 0.1 nM fluorescently-labeled DNA probe, and 0-100 nM TF protein was incubated for 30 min at 4°C. Samples were loaded on a pre-run 6% non-denaturing polyacrylamide gel in 0.5X TBE buffer at 100V for 60 min. Gels were imaged using a fluorescence scanner.
- Result: Wild-type TF and Mutant A showed a shifted band; Mutant B did not. A 100-fold excess of unlabeled "cold" probe eliminated the shift, confirming specificity.
Phase 2: SPR for Kinetic Analysis of Hits
- Objective: Determine precise kinetic parameters for confirmed binders.
- Protocol: Biotinylated DNA was immobilized on a streptavidin-coated sensor chip. Using a Biacore system, serial dilutions of TF proteins (0.78 nM to 100 nM) were injected in HBS-EP+ buffer (10 mM HEPES, 150 mM NaCl, 3 mM EDTA, 0.05% v/v Surfactant P20, pH 7.4) at a flow rate of 30 µL/min. Surface was regenerated with 1M NaCl. Data were double-referenced and fit to a 1:1 binding model.
- Result Table:
| Protein Sample | ka (1/Ms) | kd (1/s) | KD (nM) | Conclusion from Kinetics |
|---|---|---|---|---|
| Wild-type TF | 1.2 x 10⁵ | 8.0 x 10⁻⁴ | 6.7 | High-affinity, stable complex. |
| Mutant A (EMSA +) | 9.5 x 10⁴ | 4.5 x 10⁻³ | 47.4 | Binds, but faster dissociation reduces affinity. |
| Mutant B (EMSA -) | No binding detected | - | - | Loss-of-function confirmed. |
Experimental Workflow Diagram
Title: Complementary EMSA-SPR Workflow for Binding Analysis
The Scientist's Toolkit: Key Research Reagent Solutions
| Item | Function in EMSA/SPR | Example/Brief Explanation |
|---|---|---|
| Non-denaturing Polyacrylamide Gel | EMSA matrix for separating protein-DNA complexes from free probe. | Typically 4-10% acrylamide; pore size affects resolution of shifted bands. |
| Fluorescent DNA Label (e.g., Cy5, FAM) | Tags DNA for non-radioactive EMSA detection. | Allows safe, sensitive imaging with standard gel scanners. |
| Streptavidin Sensor Chip (SA Chip) | SPR surface for immobilizing biotinylated ligands. | Gold standard for capturing biotin-labeled DNA or protein targets. |
| HBS-EP+ Buffer | Running buffer for SPR to minimize non-specific binding. | Contains HEPES for pH stability, NaCl for ionic strength, EDTA to chelate divalent cations, and surfactant to reduce bulk effects. |
| Regeneration Solution (e.g., 1M NaCl, 50mM NaOH) | Removes bound analyte from SPR chip surface without damaging it. | Allows re-use of the ligand surface for multiple analyte cycles. |
| High-Purity, Low-DNA-BSA | Carrier protein in EMSA binding buffers. | Reduces non-specific protein adhesion to tubes and gel wells. |
| Kinetic Evaluation Software | Fits SPR sensorgram data to binding models. | Software like Biacore Evaluation Module is used to derive ka, kd, and KD values. |
Within the context of evaluating EMSA (Electrophoretic Mobility Shift Assay) and SPR (Surface Plasmon Resonance) for binding affinity and kinetics research, orthogonal validation using complementary biophysical techniques is critical. ITC (Isothermal Titration Calorimetry), MST (Microscale Thermophoresis), and BLI (Bio-Layer Interferometry) provide distinct advantages and considerations. This guide objectively compares their performance against EMSA and SPR.
Comparison of Key Biophysical Techniques
The following table summarizes the core capabilities, requirements, and outputs of each technique for binding characterization.
| Technique | Measured Parameters | Sample Consumption | Throughput | Label Required? | Key Advantage | Key Limitation |
|---|---|---|---|---|---|---|
| EMSA | Equilibrium binding affinity (Kd) | Low (µg) | Low | Typically, for detection | Visual proof of complex formation; native conditions. | No kinetics; low throughput; qualitative/semi-quantitative. |
| SPR | Affinity (Kd), kinetics (ka, kd), specificity. | Low (µg for ligand) | Medium-High | One molecule immobilized | Real-time, label-free kinetics; reusable sensor chip. | Immobilization complexity; potential for mass transport artifacts. |
| ITC | Affinity (Kd), stoichiometry (n), thermodynamics (ΔH, ΔS). | High (mg) | Low | No | Direct measurement of full thermodynamics in solution. | High sample consumption; low throughput; requires significant heat change. |
| MST | Affinity (Kd), specificity. | Very Low (µL of nM) | High | Yes (fluorescent tag) | Extremely low sample volume; handles complex buffers (e.g., crude lysate). | Requires fluorescent labeling; thermophoresis signal can be buffer-sensitive. |
| BLI | Affinity (Kd), kinetics (ka, kd), specificity. | Low (µg for ligand) | Medium-High | One molecule immobilized | Real-time, label-free; uses disposable sensor tips; measures crude samples. | Like SPR, immobilization required; lower data density than SPR. |
Supporting Experimental Data Comparison
The table below presents hypothetical but representative data for the interaction between a protein (Target) and a small molecule inhibitor (Compound X), as could be generated by each technique.
| Technique | Reported Kd (nM) | kon (1/Ms) | koff (1/s) | ΔH (kcal/mol) | ΔS (cal/mol/K) | Experimental Context |
|---|---|---|---|---|---|---|
| EMSA | 50 - 200 (estimated) | N/A | N/A | N/A | N/A | 100 nM protein titrated with ligand; gel densitometry analysis. |
| SPR | 25 ± 5 | 1.2e⁵ ± 2e⁴ | 3.0e⁻³ ± 5e⁻⁴ | N/A | N/A | Target immobilized, Compound X in solution. Multi-cycle kinetics. |
| ITC | 28 ± 3 | N/A | N/A | -12.1 ± 0.5 | -15.2 | 20 µM Target in cell, 200 µM Compound X in syringe. |
| MST | 32 ± 8 | N/A | N/A | N/A | N/A | Target labeled with red-fluorescent dye; titrated with Compound X. |
| BLI | 30 ± 6 | 9.5e⁴ ± 3e⁴ | 2.8e⁻³ ± 7e⁻⁴ | N/A | N/A | Target biotinylated & immobilized on streptavidin tip; Compound X in solution. |
Detailed Experimental Protocols
1. SPR Protocol (Referenced Data)
- Instrument: Biacore T200.
- Immobilization: Target protein is covalently immobilized on a CMS sensor chip via amine coupling to ~5000 Response Units (RU).
- Running Buffer: PBS-P (0.05% surfactant P20).
- Kinetic Experiment: Compound X is serially diluted (0.39 nM to 100 nM) and injected over the target and reference surfaces at 30 µL/min for 120s association, followed by 300s dissociation. Data is double-referenced and fit to a 1:1 binding model.
2. ITC Protocol (Referenced Data)
- Instrument: MicroCal PEAQ-ITC.
- Sample Preparation: Target (20 µM) dialyzed into PBS pH 7.4. Compound X (200 µM) prepared in dialysis buffer.
- Experiment: Cell contains Target. Syringe contains Compound X. 19 injections (2 µL first, 1µL subsequent) at 120s intervals, 750 rpm stirring, 25°C. Data fit to a single-site binding model.
3. MST Protocol (Referenced Data)
- Instrument: Monolith X.
- Labeling: Target protein labeled with a RED-NHS 2nd generation dye.
- Experiment: Constant concentration of labeled Target (20 nM) mixed with serial dilution of Compound X (1 pM to 100 µM) in PBS-T (0.05% Tween-20). Loaded into capillaries. Thermophoresis is measured at 25°C. Data fit using the MO.Affinity Analysis software.
4. BLI Protocol (Referenced Data)
- Instrument: Octet RED96e.
- Immobilization: Biotinylated Target captured on Streptavidin (SA) biosensors to ~1 nm shift.
- Kinetic Experiment: Compound X serially diluted (0.78 nM to 200 nM) in PBS-P. Steps: Baseline (60s), Association (120s), Dissociation (180s). Data reference-subtracted and fit to a 1:1 model.
Pathway & Workflow Visualizations
Title: Orthogonal Validation Strategy in Binding Studies
Title: Workflow for Orthogonal Validation Decision Tree
The Scientist's Toolkit: Key Research Reagent Solutions
| Item | Function in Experiments |
|---|---|
| Biotinylation Kit | Labels protein for immobilization on streptavidin-coated SPR chips or BLI biosensors. |
| Fluorescent Dye (NHS-ester) | Covalently labels proteins for MST; choice of dye (e.g., RED, BLUE) depends on system. |
| High-Purity DMSO | Standard solvent for compound stocks; must be controlled across ITC, SPR, BLI, MST to avoid buffer mismatches. |
| Amine Coupling Kit | Contains reagents (NHS/EDC) for covalent immobilization of proteins on carboxylated SPR sensor surfaces. |
| Streptavidin Biosensors (BLI) | Disposable fiber tips used in BLI to capture biotinylated ligands. |
| CMS Sensor Chip (SPR) | Gold surface with carboxymethyl dextran for covalent protein immobilization via amine coupling. |
| Reference Surface Chip | In SPR, a surface without ligand for subtraction of bulk refractive index and non-specific binding signals. |
| Dialysis Cassettes | Critical for ITC to perfectly match buffer composition between cell and syringe samples. |
| Capillary Tray (MST) | Holds nanoliter-volume samples for measurement in the MST instrument. |
| Running Buffer Additives | Surfactants (P20, Tween-20) minimize non-specific binding in SPR, BLI, and MST. |
Conclusion
EMSA and SPR serve distinct but occasionally complementary roles in the molecular interaction toolkit. EMSA remains a powerful, accessible, and cost-effective method for confirming binding specificity and estimating equilibrium dissociation constants, particularly for nucleic acid-protein interactions. In contrast, SPR provides unparalleled, label-free insight into binding kinetics and thermodynamics in real-time, making it indispensable for detailed mechanistic studies and lead optimization in drug discovery. The choice hinges on the research question: EMSA for 'does it bind?' and SPR for 'how exactly does it bind?'. Future directions point toward increased SPR automation and miniaturization for higher throughput, while EMSA evolves with improved quantitative digital detection methods. A strategic, combined approach often yields the most robust validation for critical findings in biomedical research.