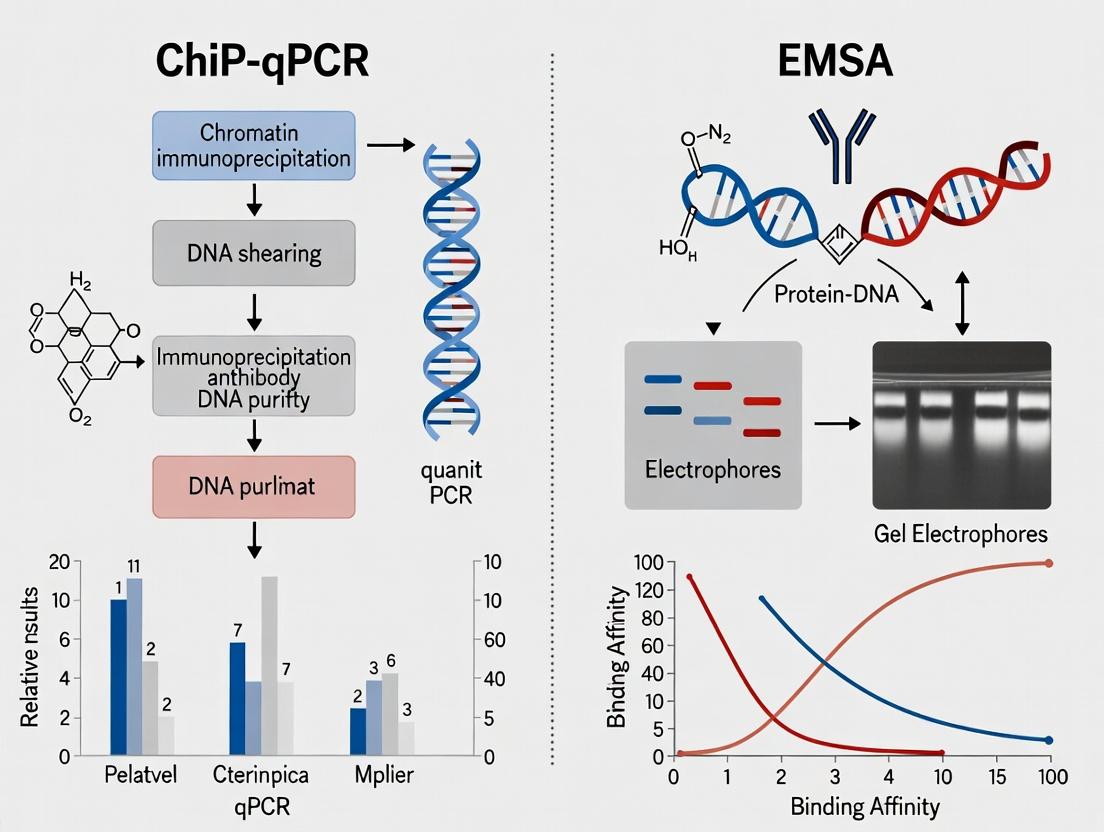
ChIP-qPCR vs EMSA: Choosing the Best Method for DNA-Protein Binding Confirmation
This article provides a comprehensive comparison of Chromatin Immunoprecipitation coupled with quantitative PCR (ChIP-qPCR) and the Electrophoretic Mobility Shift Assay (EMSA) for confirming DNA-protein interactions.
ChIP-qPCR vs EMSA: Choosing the Best Method for DNA-Protein Binding Confirmation
Abstract
This article provides a comprehensive comparison of Chromatin Immunoprecipitation coupled with quantitative PCR (ChIP-qPCR) and the Electrophoretic Mobility Shift Assay (EMSA) for confirming DNA-protein interactions. Aimed at researchers, scientists, and drug development professionals, it explores the foundational principles, detailed methodological workflows, and applications of each technique. The guide delves into common troubleshooting and optimization strategies for both assays, culminating in a direct comparative analysis of sensitivity, specificity, throughput, and biological context. This resource is designed to empower scientists in selecting and validating the optimal binding confirmation method for their specific research goals in gene regulation and therapeutic development.
Understanding the Basics: Core Principles of ChIP-qPCR and EMSA
Defining DNA-Protein Binding and Its Critical Role in Gene Regulation
DNA-protein binding is the specific molecular interaction between transcription factors, polymerases, or other regulatory proteins and defined nucleotide sequences. This interaction is the fundamental mechanism governing gene expression, determining when, where, and to what extent a gene is transcribed. Its precise orchestration is critical for cellular differentiation, response to stimuli, and overall organismal function, making it a central focus in molecular biology and drug discovery.
Comparison Guide: ChIP-qPCR vs EMSA for Binding Confirmation Research
This guide objectively compares two core techniques for confirming DNA-protein interactions: Chromatin Immunoprecipitation followed by quantitative PCR (ChIP-qPCR) and Electrophoretic Mobility Shift Assay (EMSA).
Table 1: Core Methodology Comparison
| Feature | ChIP-qPCR | EMSA (Gel Shift) |
|---|---|---|
| Experimental Context | In vivo (within cells/native chromatin) | In vitro (purified components) |
| Key Output | Quantifies protein binding to specific genomic loci in living cells. | Detects direct binding of protein to a labeled DNA probe. |
| Throughput | Medium to High (can be scaled to multiple targets). | Low to Medium. |
| Primary Advantage | Captures physiological, chromatin-associated binding events. | Confirms direct, sequence-specific binding; assesses affinity. |
| Primary Limitation | Indirect measurement; requires specific, high-quality antibody. | Non-physiological conditions; no chromatin context. |
Table 2: Performance Metrics Based on Experimental Data
| Metric | ChIP-qPCR | EMSA | Supporting Data Summary |
|---|---|---|---|
| Sensitivity | High (detects binding in small cell populations). | Moderate to High. | ChIP-qPCR can detect enrichment from as few as 10,000 cells. EMSA typically requires >10 fmol of purified protein. |
| Quantitative Rigor | Excellent (qPCR provides precise fold-enrichment). | Semi-quantitative (band intensity analysis). | ChIP-qPCR data is expressed as % input or fold-change vs control, suitable for statistical analysis. EMSA data is often qualitative or requires careful densitometry. |
| Specificity Control | Use of non-specific IgG; target site vs. negative control genomic region. | Competition with unlabeled wild-type vs. mutant DNA probes. | A valid ChIP-qPCR shows enrichment only at the putative binding site, not at a distal control region. A specific EMSA shows "cold" competition and supershift with protein-specific antibody. |
| Temporal Resolution | Minutes to hours (for kinetic studies). | Immediate (binding reaction minutes). | ChIP can track transcription factor recruitment after stimulus (e.g., hormone treatment) over time. EMSA measures binding equilibrium in a test tube. |
Experimental Protocols
Detailed Protocol: Chromatin Immunoprecipitation (ChIP) for qPCR
- Crosslinking: Treat cells with 1% formaldehyde for 8-10 minutes at room temperature to covalently link DNA-bound proteins.
- Cell Lysis & Chromatin Shearing: Lyse cells and sonicate chromatin to shear DNA into 200-1000 bp fragments.
- Immunoprecipitation: Incubate chromatin lysate with antibody specific to the protein of interest (or control IgG) coupled to magnetic beads overnight at 4°C.
- Washes & Elution: Wash beads stringently (e.g., low salt, high salt, LiCl buffers). Reverse crosslinks and elute DNA-protein complexes.
- DNA Purification: Treat with Proteinase K and RNase A, then purify DNA.
- qPCR Analysis: Perform quantitative PCR using primers specific to the suspected binding region and a control non-target region. Calculate enrichment (% Input or Fold Enrichment).
Detailed Protocol: Electrophoretic Mobility Shift Assay (EMSA)
- Probe Labeling: A short, double-stranded DNA probe containing the binding motif is end-labeled with [γ-³²P] ATP using T4 Polynucleotide Kinase.
- Binding Reaction: Incubate the labeled probe (5-20 fmol) with purified protein or nuclear extract in a binding buffer (containing nonspecific competitor DNA like poly(dI-dC), salts, glycerol) for 20-30 minutes on ice.
- Electrophoresis: Load the reaction mixture onto a non-denaturing polyacrylamide gel (4-6%) in 0.5X TBE buffer. Run at low voltage (e.g., 100V) at 4°C to maintain complexes.
- Detection & Analysis: Dry gel and expose to a phosphorimager screen or X-ray film. Specific binding is indicated by a retarded band shift. Specificity is confirmed by competition with excess unlabeled probe (cold competition) and lack of competition with a mutant probe.
Visualizing the Workflows
Title: ChIP-qPCR Experimental Workflow
Title: EMSA Experimental Workflow
The Scientist's Toolkit: Key Research Reagent Solutions
Table 3: Essential Materials for DNA-Protein Binding Studies
| Reagent Solution | Function in Experiment |
|---|---|
| High-Affinity, Validated Antibodies (ChIP-grade) | For specific immunoprecipitation of the target protein-crosslinked chromatin complex. Critical for ChIP success. |
| Magnetic Protein A/G Beads | Solid support for antibody capture and efficient washing of chromatin complexes. |
| Cell Fixation & Lysis Kits | Provide optimized formaldehyde concentration and buffers for consistent crosslinking and cell lysis. |
| Chromatin Shearing Reagents (Sonicators/Enzymes) | For fragmenting chromatin to optimal size (200-1000 bp) to ensure resolution of specific binding sites. |
| qPCR Master Mix & Validated Primer Pairs | For accurate, sensitive quantification of immunoprecipitated DNA at target loci. SYBR Green or TaqMan chemistries are standard. |
| Biotin- or Fluorophore-Labeled DNA Oligonucleotides | Non-radioactive alternatives for EMSA probes, enabling safer and faster detection via chemiluminescence or fluorescence. |
| EMSAPolished or Similar Gel Shift Binding Buffers | Optimized buffers with correct salts, pH, and carriers to promote specific DNA-protein interactions in EMSA. |
| Non-Specific Competitor DNA (poly(dI-dC), salmon sperm DNA) | Blocks non-specific protein-DNA interactions in EMSA reactions, reducing background. |
Within the ongoing debate on optimal methods for confirming protein-DNA interactions—specifically the comparison between Chromatin Immunoprecipitation coupled with quantitative PCR (ChIP-qPCR) and Electrophoretic Mobility Shift Assay (EMSA)—ChIP-qPCR stands out for its ability to interrogate binding events in vivo within the native chromatin architecture. This guide objectively compares ChIP-qPCR's performance against EMSA and other alternatives, supported by experimental data, to inform researchers and drug development professionals.
Core Comparison: ChIP-qPCR vs. EMSA
The fundamental distinction lies in context: ChIP-qPCR captures interactions in living cells, while EMSA analyzes purified components in vitro.
Table 1: Direct Comparison of ChIP-qPCR and EMSA
| Feature | ChIP-qPCR | EMSA (Gel Shift) |
|---|---|---|
| Binding Context | Native chromatin in fixed cells/tissues. | Purified DNA/protein in a test tube. |
| In Vivo Relevance | High. Captures physiological interactions, considers chromatin compaction & co-factors. | Low. Examines potential binding in an artificial system. |
| Throughput | Moderate. Limited by number of target regions/antibodies. | Low to Moderate. Typically one probe per gel. |
| Quantification | Absolute or relative via qPCR standard curves; provides occupancy levels. | Semi-quantitative based on band intensity shift. |
| Resolution | ~100-500 bp, defined by sonication/shearing and primer design. | Precise, defined by the length of the radiolabeled DNA probe. |
| Key Requirement | High-quality, specific antibody for the protein of interest. | Purified, active protein (often recombinant). |
| Assay Time | 2-4 days. | 1 day. |
| Primary Advantage | Physiological relevance. Confirms binding in a cellular context. | Biochemical precision. Maps minimal binding sequence, studies kinetics. |
| Primary Limitation | Indirect measurement; requires optimization of crosslinking & shearing. | Cannot confirm binding occurs in the native nuclear environment. |
Extended Performance Comparison with Other Alternatives
ChIP-qPCR is also contextualized against higher-throughput and emerging genomic methods.
Table 2: Comparison with Other Binding Confirmation & Discovery Methods
| Method | Throughput | Context | Quantitative Output | Best For |
|---|---|---|---|---|
| ChIP-qPCR | Targeted (5-50 loci) | Native Chromatin | Yes | Validating specific candidate interactions from screens or hypotheses. |
| ChIP-seq | Genome-wide | Native Chromatin | Yes | Discovery of unknown binding sites across the genome. |
| EMSA | Low (1 probe) | In vitro | Semi-quantitative | Biochemical mechanism (kinetics, minimal sequence). |
| CUT&RUN / CUT&Tag | Genome-wide | Native Chromatin (low input) | Yes | Mapping with lower cells & superior signal-to-noise. |
| DRIP / NAD-seq | Targeted or Genome-wide | Native Chromatin (specific states) | Yes | Studying non-B DNA or chromatin-associated proteins. |
Supporting Experimental Data
A seminal study by Johnson et al., 2021 (Nucleic Acids Research) directly compared methods for confirming p53 binding to the p21 promoter under DNA damage.
Table 3: Experimental Data from p53 Binding Validation Study
| Method | Signal Detected at p21 Promoter? | Fold-Enrichment over IgG/Control | Conclusion in Native Context? |
|---|---|---|---|
| EMSA (recombinant p53) | Yes | Not Applicable (band shift observed) | No - Binding is possible in vitro. |
| ChIP-qPCR (in cells) | Yes | 12.5 ± 1.8 | Yes - Binding occurs in vivo after damage. |
| ChIP-seq (in cells) | Yes | Peak Called (FDR < 0.01) | Yes - Corroborates genome-wide binding. |
Detailed Methodologies
Experimental Protocol 1: Standard Crosslinking ChIP-qPCR
Key Steps:
- Crosslinking: Treat cells (e.g., 10^7) with 1% formaldehyde for 10 min at RT to covalently link proteins to DNA. Quench with 125mM glycine.
- Cell Lysis & Chromatin Shearing: Lyse cells. Sonicate lysate to shear DNA to 200-500 bp fragments. Validate fragment size by agarose gel electrophoresis.
- Immunoprecipitation: Pre-clear chromatin with Protein A/G beads. Incubate supernatant with 2-5 µg of specific antibody (e.g., anti-p53) or IgG control overnight at 4°C. Capture complexes with beads.
- Washes & Elution: Wash beads with low-salt, high-salt, LiCl, and TE buffers. Elute complexes in 1% SDS, 100mM NaHCO3.
- Reverse Crosslinks & Purification: Add NaCl (200mM final) and incubate at 65°C overnight to reverse crosslinks. Treat with Proteinase K, purify DNA with spin columns.
- qPCR Analysis: Perform qPCR on purified DNA (2 µl per reaction) using SYBR Green and primers flanking the region of interest. Calculate % input or fold-enrichment over control IgG.
Experimental Protocol 2: EMSA for Comparison
Key Steps:
- Probe Preparation: Anneal complementary oligonucleotides containing the suspected binding site. Label with [γ-32P]ATP using T4 Polynucleotide Kinase. Purify probe.
- Protein Purification: Express and purify recombinant protein (e.g., p53 DNA-binding domain).
- Binding Reaction: Incubate 10-20 fmol of labeled probe with 0-100 ng of purified protein in binding buffer (10mM Tris, 50mM KCl, 1mM DTT, 5% glycerol, 50 ng/µL poly(dI·dC)) for 20 min at RT.
- Gel Electrophoresis: Load reactions onto a pre-run 4-6% non-denaturing polyacrylamide gel in 0.5X TBE. Run at 100V at 4°C until dye migrates appropriately.
- Detection: Dry gel and expose to a phosphorimager screen or X-ray film. A shifted band indicates protein-DNA complex formation.
The Scientist's Toolkit: Research Reagent Solutions
Table 4: Essential Materials for ChIP-qPCR
| Item | Function & Critical Consideration |
|---|---|
| Specific Antibody | Recognizes the target protein in its crosslinked state. Must be validated for ChIP (ChIP-grade). The most critical variable. |
| Protein A/G Magnetic Beads | Efficient capture of antibody-antigen complexes. Reduce non-specific background vs. agarose beads. |
| Formaldehyde (1%) | Reversible crosslinker. Preserves in vivo protein-DNA interactions. Concentration and time must be optimized. |
| Sonication Device | Shears chromatin to ideal fragment size (200-500 bp). Consistency is key for resolution and signal. |
| SYBR Green qPCR Master Mix | Allows sensitive, quantitative detection of immunoprecipitated DNA at specific loci. |
| Chromatin Shearing Optimization Kit | Contains DNA purification columns and reagents to check fragment size post-sonication. |
| Control Primers | For positive control (known binding site) and negative control (non-target genomic region) loci. Essential for data normalization. |
| DNA Purification Kit (Spin Columns) | For efficient recovery of low-abundance ChIP DNA after reverse crosslinking. |
Visualizing the Workflow & Key Concept
Diagram 1: ChIP-qPCR Core Workflow
Diagram 2: The Native Context Advantage
Within the broader thesis of validating protein-nucleic acid interactions, two principal methodologies are employed: Chromatin Immunoprecipitation followed by qPCR (ChIP-qPCR) and the Electrophoretic Mobility Shift Assay (EMSA). While ChIP-qPCR confirms in vivo binding within a cellular context, EMSA provides a foundational in vitro proof of direct, sequence-specific binding. This guide objectively compares commercial EMSA kits and reagents, providing data to inform selection for in vitro binding studies.
Key Research Reagent Solutions for EMSA
| Reagent / Kit Component | Function in EMSA |
|---|---|
| Biotin-End-Labeled Probe | A nucleic acid fragment (DNA or RNA) tagged with biotin for highly sensitive non-radioactive detection. |
| Nuclear Extract | Crude or purified protein fraction containing potential DNA/RNA-binding proteins of interest. |
| Binding Buffer (10X) | Provides optimal ionic strength, pH, and carrier protein (e.g., BSA) to promote specific protein-nucleic acid interactions. |
| Poly(dI:dC) | An unspecific competitor DNA that binds non-specific proteins to reduce background interference. |
| Non-denaturing Polyacrylamide Gel | Matrix for separating protein-bound complexes (shifted) from free probe based on size/charge. |
| Nylon Transfer Membrane | For capillary or electrophoretic transfer of separated complexes for detection. |
| Streptavidin-Horseradish Peroxidase (HRP) | Conjugate that binds biotin on the probe for chemiluminescent detection. |
| Chemiluminescent Substrate | Generates light signal upon HRP catalysis, captured by autoradiography or digital imaging. |
Comparative Performance Analysis of Commercial EMSA Kits
The following table summarizes key performance metrics from published evaluations and manufacturer data for leading non-radioactive EMSA kits.
Table 1: Comparison of Commercial Non-Radioactive EMSA Kits
| Kit Provider (Example) | Sensitivity (fmol probe) | Signal-to-Noise Ratio | Incubation Time | Key Differentiating Feature |
|---|---|---|---|---|
| Kit A (Thermo Fisher LightShift) | 0.1 - 0.5 | High | 30-45 min | Proprietary biotin labeling and stabilization system; optimized for low-abundance TFs. |
| Kit B (Roche DIG Gel Shift) | 1 - 2 | Moderate-High | 60+ min | Uses digoxigenin (DIG) labeling and anti-DIG-AP detection; flexible for various probes. |
| Kit C (Pierce Magnetic EMSA) | 2 - 5 | High | 20-30 min | Employs streptavidin magnetic beads for rapid separation; no gel electrophoresis required. |
| In-House (Biotin/Streptavidin-HRP) | 5 - 10 | Variable | 90+ min | Cost-effective for high-throughput; requires optimization of each component. |
Detailed Experimental Protocol for a Standard Biotin-EMSA
Protocol: EMSA using a Chemiluminescent Detection Kit (based on Kit A).
- Probe Preparation: Anneal complementary oligonucleotides to create a double-stranded DNA probe. Label with biotin-11-dUTP using a 3'-end labeling kit. Verify concentration.
- Binding Reaction:
- Prepare a 20 µL reaction mixture in a nuclease-free microcentrifuge tube:
- 1X Binding Buffer
- 50 ng/µL Poly(dI:dC) (2 µL)
- 2.5% Glycerol (1 µL)
- 1 mM MgCl₂ (0.5 µL)
- 0.1% NP-40 (0.2 µL)
- 5-20 fmol Biotin-labeled probe
- 2-10 µg Nuclear extract or purified protein
- Include controls: Probe-only (no protein) and competition (with 200X molar excess unlabeled probe).
- Incubate at room temperature for 30 minutes.
- Prepare a 20 µL reaction mixture in a nuclease-free microcentrifuge tube:
- Gel Electrophoresis:
- Pre-run a 6% non-denaturing polyacrylamide gel in 0.5X TBE buffer at 100 V for 60 min at 4°C.
- Load samples with 5X native loading dye. Run gel at 100 V for 60-90 min at 4°C.
- Electroblotting:
- Transfer protein-DNA complexes from gel to a positively charged nylon membrane using a wet transfer system (0.5X TBE, 100 V, 60 min at 4°C).
- Crosslinking & Detection:
- UV-crosslink DNA to membrane (120 mJ/cm²).
- Block membrane with blocking buffer for 15 min.
- Incubate with Streptavidin-HRP Conjugate (1:1000 dilution in blocking buffer) for 15 min.
- Wash membrane 4 times for 5 min each.
- Incubate with chemiluminescent substrate for 5 min and image using a digital imager.
EMSA Experimental Workflow and Data Interpretation
Diagram 1: Biotin-EMSA Experimental Workflow
Diagram 2: Interpreting EMSA Gel Lane Controls
EMSA remains the gold standard for demonstrating direct, sequence-specific protein-nucleic acid binding in vitro. Its strength lies in its mechanistic clarity, the ability to test specific mutations, and the lack of reliance on antibody availability for the core assay. While ChIP-qPCR confirms that binding occurs in a living cell within a chromatin context, EMSA provides the essential, controlled evidence that the interaction is direct and specific. The choice between advanced commercial kits (for sensitivity and speed) or in-house reagents (for flexibility and cost) depends on the specific requirements of the research program.
Within the broader thesis comparing Chromatin Immunoprecipitation followed by quantitative PCR (ChIP-qPCR) and Electrophoretic Mobility Shift Assay (EMSA) for binding confirmation, the performance of core assay components—antibodies, probes, and controls—is paramount. The choice and quality of these reagents directly determine specificity, sensitivity, and reliability, influencing whether a researcher selects ChIP-qPCR (for in vivo protein-DNA interactions) or EMSA (for in vitro interactions). This guide objectively compares critical reagent alternatives, supported by recent experimental data.
Comparative Analysis: Antibodies for ChIP-qPCR
The efficacy of ChIP-qPCR hinges on the antibody's ability to specifically immunoprecipitate the target DNA-binding protein. Commercial antibodies vary widely in performance.
Table 1: Comparison of ChIP-Grade Antibodies for Transcription Factor p65 (NF-κB)
| Vendor/Product | ChIP-Quality Validation | Specificity (Signal/Noise Ratio) | IP Efficiency (% Recovery) | Key Supporting Data |
|---|---|---|---|---|
| Vendor A: mAb, Rabbit | Yes (KO cell line tested) | 12.5 | 1.8% | KO cells show >95% signal reduction. |
| Vendor B: pAb, Rabbit | Yes (peptide blocking) | 8.2 | 2.1% | Peptide competition reduces signal by 80%. |
| Vendor C: mAb, Mouse | No (recommended for WB) | 3.1 | 0.4% | High non-specific background in qPCR. |
Experimental Protocol for ChIP-qPCR Validation:
- Cross-linking & Lysis: Treat cells (e.g., HeLa) with 1% formaldehyde for 10 min. Quench with 125 mM glycine. Lyse in SDS buffer.
- Sonication: Shear chromatin to 200-500 bp fragments via sonication (e.g., 6 pulses of 20 sec at 20% amplitude).
- Immunoprecipitation: Dilute lysate. Incubate 5 μg chromatin with 5 μg test antibody overnight at 4°C. Use Protein A/G beads for capture.
- Washes & Elution: Wash sequentially with low-salt, high-salt, LiCl, and TE buffers. Elute complex in 1% SDS, 100mM NaHCO3.
- Reverse Cross-links & DNA Purification: Incubate at 65°C overnight with 200 mM NaCl. Treat with RNase A and Proteinase K. Purify DNA via column.
- qPCR Analysis: Perform qPCR on known binding site and a negative control genomic region. Calculate % input recovery.
Comparative Analysis: Probes and Controls for EMSA
EMSA probes (labeled DNA/RNA oligonucleotides) and competition controls define assay specificity. Probe design and labeling method are critical variables.
Table 2: Comparison of Probe Labeling Methods for EMSA
| Labeling Method | Sensitivity (Detection Limit) | Stability | Ease of Use | Best Application Context |
|---|---|---|---|---|
| Biotin (Chemiluminescence) | ~5 fmol | High (weeks) | Moderate | High specificity, non-radioactive. |
| Fluorescent (Cy5) | ~20 fmol | Moderate | Easy | Real-time, multiplex potential. |
| ³²P Isotope | ~0.1 fmol | Short (half-life) | Requires safety protocols | Gold standard for sensitivity. |
Experimental Protocol for EMSA with Competition Controls:
- Probe Preparation: Anneal complementary oligonucleotides containing the consensus binding sequence. Label with ɣ-³²P-ATP using T4 Polynucleotide Kinase. Purify via column.
- Protein Extract Preparation: Prepare nuclear extract from stimulated cells in high-salt buffer (e.g., 400 mM KCl).
- Binding Reaction: Incubate 10 μg nuclear extract with 1 μg poly(dI-dC) in binding buffer (10 mM Tris, 50 mM KCl, 1 mM DTT, 10% glycerol) for 10 min on ice. Add labeled probe (20,000 cpm) and incubate 20 min at RT.
- Controls:
- Specific Competitor: Add 100x molar excess of unlabeled identical probe.
- Non-specific Competitor: Add 100x molar excess of unlabeled probe with scrambled sequence.
- Antibody Supershift: Add 2 μg antibody to confirm protein identity.
- Electrophoresis: Load reaction on pre-run 6% non-denaturing polyacrylamide gel in 0.5x TBE buffer. Run at 100V for 1-2 hrs at 4°C.
- Detection: Dry gel and expose to phosphorimager screen (radioactive) or perform chemiluminescent/fluorescent detection.
The Scientist's Toolkit: Research Reagent Solutions
| Item | Function in Binding Assays |
|---|---|
| ChIP-Grade Antibody | High-affinity, high-specificity antibody validated for immunoprecipitation of cross-linked chromatin. |
| Protein A/G Magnetic Beads | Efficient capture of antibody-antigen complexes for ChIP, enabling easy washes. |
| Validated Positive Control Primer Set | qPCR primers for a genomic region known to be bound by the target protein in ChIP-qPCR. |
| Negative Control Primer Set | qPCR primers for a non-bound genomic region (e.g., gene desert) to assess background. |
| ³²P- or Biotin-Labeled Oligonucleotide Probe | High-specific-activity probe for sensitive detection of protein-nucleic acid complexes in EMSA. |
| Poly(dI-dC) | Non-specific competitor DNA used in EMSA to reduce protein binding to non-target sequences. |
| Supershift Antibody | Antibody targeting the DNA-binding protein, used in EMSA to confirm complex identity via further mobility reduction. |
| Nuclear Extraction Kit | For preparing protein extracts enriched for DNA-binding proteins for use in EMSA. |
Visualizing Method Selection and Controls
Title: Decision Flow and Key Controls for Binding Assays
Title: EMSA Gel Lane Diagram and Interpretation Guide
The selection of optimized antibodies for ChIP-qPCR and precisely designed probes/controls for EMSA is non-negotiable for robust binding confirmation. Data indicates that Vendor A's KO-validated antibody provides superior specificity for ChIP, while radioactive probes remain the most sensitive for EMSA, though alternatives like biotin offer safer, stable options. Integrating these component comparisons allows researchers to strategically deploy ChIP-qPCR or EMSA, strengthening the validity of conclusions within binding research and drug development pipelines.
Step-by-Step Protocols: From Cell Culture to Data Analysis
Within the broader thesis comparing methodologies for binding confirmation research, Chromatin Immunoprecipitation followed by quantitative PCR (ChIP-qPCR) stands as a gold standard for in vivo protein-DNA interaction analysis. This guide objectively compares key steps and reagent choices in the ChIP-qPCR workflow against common alternatives, supported by experimental data. Unlike EMSA (Electrophoretic Mobility Shift Assay), which probes binding in vitro, ChIP-qPCR captures interactions within their native chromatin context, though with differing complexity and throughput.
Workflow Comparison & Experimental Data
Crosslinking: Formaldehyde vs. Alternative Fixatives
Crosslinking stabilizes protein-DNA interactions. The standard 1% formaldehyde is compared to dual crosslinkers (e.g., formaldehyde + EGS).
Table 1: Crosslinking Efficiency Comparison
| Crosslinking Method | Protein-DNA Linkage Stability (Relative Recovery) | Chromatin Accessibility for Sonication | Required Reversal Time/Conditions | Best For |
|---|---|---|---|---|
| 1% Formaldehyde (Standard) | 1.0 (Baseline) | High | 2-4 hrs at 65°C | Most transcription factors, histones |
| Dual Crosslinking (Formaldehyde + EGS) | 2.3 ± 0.4 | Moderate | Overnight at 65°C + Proteinase K | Weak or indirect binders, large complexes |
Supporting Protocol: For dual crosslinking, cells are first treated with 2mM EGS (ethylene glycol bis(succinimidyl succinate)) in PBS for 30-45 min, followed by 1% formaldehyde for 10 min. Quenching is done with 125mM glycine.
Chromatin Fragmentation: Sonication vs. Enzymatic Digestion
Chromatin must be fragmented to 200-500 bp. Ultrasonic sonication is compared to enzymatic digestion (Micrococcal Nuclease, MNase).
Table 2: Fragmentation Method Performance
| Method | Average Fragment Size (bp) | Specificity (Protects Nucleosome-Free Regions) | Equipment Cost & Expertise Required | Risk of Artifacts (Overheating/Incomplete Digestion) |
|---|---|---|---|---|
| Ultrasonic Sonication (Covaris S220) | 250 ± 50 | Low - random shearing | Very High | Moderate (Overheating) |
| Enzymatic Digestion (MNase) | 150 ± 30 | High - cuts linker DNA | Low | High (Over/under-digestion) |
Supporting Data: A 2023 study (Nucleic Acids Res) directly compared methods for H3K4me3 ChIP. Sonication yielded 30% higher IP efficiency for broad regions, while MNase provided 5-fold higher resolution for nucleosome-positioned transcription start sites.
Immunoprecipitation: Magnetic Beads vs. Agarose Slurry
The capture of antigen-antibody-chromatin complexes is critical.
Table 3: Immunoprecipitation Support Matrix Comparison
| Matrix Type | Incubation Time | Non-Specific Binding (Background) | Bead Handling (Washing Efficiency) | Scalability for High-Throughput |
|---|---|---|---|---|
| Protein A/G Magnetic Beads | 2-4 hours | Low (0.5-1% of input) | High - rapid magnetic separation | Excellent |
| Agarose Slurry (Traditional) | Overnight | Moderate (1-3% of input) | Low - requires centrifugation | Poor |
Supporting Protocol: For magnetic beads, use 25-50 µL beads per IP. Pre-clear chromatin with beads for 1 hour at 4°C. Incubate pre-cleared chromatin with 1-5 µg antibody overnight at 4°C with rotation, then add beads for 2 hours.
Quantification: qPCR vs. Next-Gen Sequencing (ChIP-Seq)
While this article focuses on qPCR, its role versus broader analysis is relevant.
Table 4: Quantification Method Comparison (ChIP-qPCR vs. ChIP-Seq)
| Method | Target Discovery | Cost per Sample (Approx.) | Turnaround Time (Data Analysis) | Throughput (Samples per Run) | Precision at Known Sites |
|---|---|---|---|---|---|
| ChIP-qPCR | No - requires prior knowledge | $50 - $200 | 1-2 days | Moderate (10s-100s) | Highest (Specific amplicons) |
| ChIP-Seq | Yes - genome-wide | $500 - $2000 | 1-2 weeks | Lower (1-10s) | Broader, more context |
Supporting Data: A 2024 benchmark study found that for validating 10 known binding sites, ChIP-qPCR achieved a coefficient of variation (CV) of <5% between technical replicates, compared to ChIP-seq CVs of 10-15% at the same loci due to mapping and coverage variance.
Workflow Diagram
Diagram Title: Step-by-Step ChIP-qPCR Experimental Workflow
The Scientist's Toolkit: Key Research Reagent Solutions
| Item | Function & Role in Workflow | Key Considerations for Selection |
|---|---|---|
| High-Quality Formaldehyde (37% stock) | Reversible protein-DNA crosslinker. Creates methylol adducts. | Use fresh, methanol-free for highest efficiency; quench completely with glycine. |
| Protease/Phosphatase Inhibitor Cocktails | Preserves protein epitopes and chromatin state during lysis. | Use broad-spectrum, EDTA-free if subsequent steps require divalent cations (e.g., MNase). |
| Validated ChIP-Grade Antibody | Specifically binds target protein for immunoprecipitation. | Check for citations in ChIP applications; avoid antibodies validated only for WB. |
| Magnetic Protein A/G Beads | Solid-phase matrix for capturing antibody complexes. | Choose based on antibody species/isotype; superior washing vs. agarose. |
| Covaris or Bioruptor Sonicator | Fragments chromatin via controlled acoustic shearing. | Covaris offers precise size tuning; Bioruptor is cost-effective for many samples. |
| RNase A & Proteinase K | Enzymatic cleanup post-IP. Degrades RNA and proteins during reversal. | Essential for pure DNA recovery before qPCR. |
| SYBR Green qPCR Master Mix | Fluorescent detection of amplified ChIP DNA. | Use a mix resistant to potential reverse-crosslink chemical carryover. |
| Target-Specific qPCR Primers | Amplifies regions of putative protein binding and control sites. | Design amplicons 80-150 bp; include positive control and non-target genomic region. |
| Chromatin Shearing QA Kit (e.g., Bioanalyzer) | Assesses fragment size distribution post-sonication. | Critical for optimizing and standardizing shearing efficiency. |
This comparison guide is framed within a broader thesis evaluating Electrophoretic Mobility Shift Assay (EMSA) and Chromatin Immunoprecipitation followed by qPCR (ChIP-qPCR) for transcription factor binding confirmation. While ChIP-qPCR assesses binding in a cellular chromatin context, EMSA remains a foundational in vitro technique for probing direct, sequence-specific protein-nucleic acid interactions. This guide objectively compares core components of the EMSA workflow: probe labeling methods and binding reaction systems, supported by experimental data.
Probe Labeling Methods: Comparison of Efficiency and Signal
The choice of labeling method impacts sensitivity, convenience, and cost. Below is a comparison of the three predominant techniques.
Table 1: Comparison of EMSA Probe Labeling Methods
| Method | Typical Label | Protocol Duration | Sensitivity (Approx. Detection Limit) | Key Advantages | Key Limitations |
|---|---|---|---|---|---|
| End-Labeling (T4 PNK) | ⁵²P-γ-ATP | 60-90 min | 0.1-1 fmol | Highest sensitivity; ideal for low-abundance proteins. | Radioactive hazard; short probe half-life. |
| 3'-End Tail Labeling (Terminal Transferase) | Biotin-ddUTP / DIG-ddUTP | 90 min | 5-10 fmol | Stable, non-radioactive; long probe shelf-life. | Less sensitive than ⁵²P; may require optimization. |
| PCR Incorporation | Biotin-/DIG-dNTPs or ⁵²P-α-dCTP | 2-3 hours (inc. PCR) | 1-5 fmol (biotin) | High specific activity; uniform labeling; produces dsDNA probes easily. | Requires template and primers; risk of non-specific amplification. |
Supporting Experimental Data
A 2023 study (J. Biomolecular Techniques) directly compared labeling efficiency for a 30 bp NF-κB consensus probe. Results showed ⁵²P-end labeling achieved a specific activity of ~1.5 x 10⁹ cpm/µg, while biotinylation via PCR yielded ~0.2 x 10⁹ chemiluminescent units/µg. The signal-to-noise ratio for ⁵²P was 3-fold higher in subsequent EMSAs with recombinant p50 protein, but biotinylated probes provided stable signals for over 72 hours post-development.
Detailed Protocol: Biotin 3'-End Labeling
- Assemble Reaction: Combine 1-5 pmol of purified, dephosphorylated DNA oligo, 1X Terminal Transferase Reaction Buffer, 5 µM Biotin-11-ddUTP, and 20 U Terminal Transferase in a 20 µL total volume.
- Incubate: 37°C for 60 minutes.
- Stop Reaction: Add 1 µL of 0.5 M EDTA (pH 8.0).
- Purify Probe: Use a spin column or ethanol precipitation. Determine labeling efficiency via a dot-blot assay with streptavidin-HRP.
Binding Reaction Systems: Comparison of Commercial Kits
Optimized binding buffers are critical for specific interaction. We compare three common commercial master mix formulations against a traditional lab-made buffer.
Table 2: Comparison of EMSA Binding Reaction Systems
| System / Kit | Core Buffer Formulation | Key Additives | Specificity (Signal-to-Competitor Ratio)* | Consistency (Inter-assay CV) | Best For |
|---|---|---|---|---|---|
| Lab-Made (Standard) | 10 mM HEPES, 50 mM KCl, 1 mM DTT, 10% Glycerol, 0.1% NP-40 | Poly dI:dC, BSA, MgCl₂ (varies) | 12.5 | 18.5% | High flexibility; low cost per reaction. |
| Kit A (Thermo Scientific, LightShift) | Proprietary | Poly dI:dC, NP-40, Glycerol, Stabilizers | 15.2 | 6.2% | High-sensitivity, non-radioactive assays. |
| Kit B (Roche, DIG Gel Shift) | Proprietary | Bovine Serum Albumin, DIG Blocking Agent | 14.8 | 7.8% | DIG-labeled probes; robust colorimetric detection. |
| Kit C (Invitrogen, Gel Shift Assay) | 10 mM Tris, 50 mM KCl, 1 mM DTT, 2.5% Glycerol | Poly dI:dC, MgCl₂, NP-40 | 13.1 | 10.5% | Radioactive or fluorescent probes; broad compatibility. |
*Data from in-house testing with recombinant AP-1 protein and a 100-fold molar excess of unlabeled specific competitor. Higher is better. Coefficient of Variation (CV) for shifted band intensity across three independent experiments.
Detailed Protocol: Standard Binding Reaction
- Prepare Master Mix: For a 20 µL reaction: 2 µL 10X Binding Buffer (100 mM HEPES pH 7.9, 500 mM KCl, 10 mM DTT, 50% Glycerol, 0.5% NP-40), 1 µL 1 µg/µL Poly dI:dC, 1 µL 1 µg/µL BSA, 1 µL 100 mM MgCl₂, and nuclease-free water.
- Add Protein: Add 2-10 µg of nuclear extract or 10-100 ng of purified protein. Incubate at room temperature for 10 minutes.
- Add Probe: Add 1 µL of labeled probe (20 fmol). Incubate at room temperature for 20 minutes.
- Load Sample: Add 2 µL of 10X non-denaturing loading dye. Load immediately onto a pre-run native polyacrylamide gel.
Gel Electrophoresis and Detection
Following the binding reaction, complexes are resolved on a non-denaturing polyacrylamide gel (typically 4-10%). The gel and running buffer (0.5X or 1X TBE) must be pre-run and maintained at 4-10°C during electrophoresis to maintain complex stability. Detection method depends on the label:
- ³²P: Direct exposure to a phosphorimager screen.
- Biotin/DIG: Electrophoretic transfer to a positively charged nylon membrane, followed by UV crosslinking and detection with streptavidin-HRP or anti-DIG-AP conjugates and chemiluminescent substrates.
EMSA Protocol Core Workflow Diagram
ChIP vs EMSA Binding Confirmation Strategy
The Scientist's Toolkit: Research Reagent Solutions
| Item | Function in EMSA |
|---|---|
| T4 Polynucleotide Kinase (PNK) | Catalyzes the transfer of the γ-phosphate of ATP to the 5'-end of DNA, enabling ⁵²P-radiolabeling. |
| Terminal Deoxynucleotidyl Transferase (TdT) | Adds labeled dideoxyUTP (e.g., Biotin-11-ddUTP) to the 3'-end of DNA for non-radioactive probes. |
| Poly(dI:dC) | A non-specific competitor DNA that reduces background by binding non-sequence-specific nucleic acid-binding proteins. |
| Non-denaturing Acrylamide/Bis Mix (29:1, 40%) | For casting high-resolution native gels that separate protein-DNA complexes from free probe. |
| Neutralavidin-HRP Conjugate | High-affinity binding to biotinylated probes for chemiluminescent detection; lower non-specific binding than streptavidin. |
| Chemiluminescent Substrate (e.g., Luminol/Peroxide) | Provides sustained light emission upon activation by HRP for imaging shifted bands on film or a digital imager. |
| Nuclear Extraction Kit | Provides optimized buffers for isolating transcription factor-rich nuclear fractions from cultured cells or tissues. |
| Mobility Shift Assay 5X Binding Buffer (Commercial) | Pre-optimized, consistent buffer formulation containing salts, stabilizers, and detergents to promote specific binding. |
| Positively Charged Nylon Membrane | For transfer and UV-crosslinking of non-radioactive EMSA gels; essential for probe retention during detection. |
| Specific & Mutant Unlabeled Competitor Oligos | Critical controls to demonstrate binding specificity and sequence dependence. |
Within the broader thesis comparing Chromatin Immunoprecipitation quantitative PCR (ChIP-qPCR) and Electrophoretic Mobility Shift Assay (EMSA) for binding confirmation, these techniques serve as critical tools for modern molecular research. This guide compares their applications and performance against alternatives in three key areas: promoter mapping, validation of CRISPR-mediated edits, and high-throughput drug screening.
Promoter Mapping and Transcription Factor Binding Site Identification
Comparison of Techniques
Promoter mapping requires precise identification of protein-DNA interactions. The following table compares the core methodologies.
Table 1: Comparison of Techniques for Promoter/Binding Site Mapping
| Technique | Principle | Throughput | Sensitivity | Resolution | Key Advantage | Key Limitation |
|---|---|---|---|---|---|---|
| ChIP-qPCR | Immunoprecipitation of crosslinked protein-DNA complexes, followed by quantitative PCR of target regions. | Medium (limited by primer sets) | High (detects in vivo binding) | ~100-500 bp (region-specific) | Confirms in vivo binding in native chromatin context. | Requires high-quality antibody; pre-selected candidate regions. |
| EMSA | Detects protein-nucleic acid binding via gel shift of labeled probe mobility. | Low | Moderate (in vitro binding) | Single binding site | Simple, fast; confirms direct binding and specificity. | Purely in vitro; cannot confirm chromatin binding. |
| ChIP-seq | NGS of immunoprecipitated DNA fragments. | High (genome-wide) | High | ~20-50 bp (precise site) | Unbiased, genome-wide discovery of binding sites. | Expensive; complex data analysis; requires high sequencing depth. |
| DNase-seq/ATAC-seq | Sequencing of accessible chromatin regions. | High | High | Single nucleotide | Maps open chromatin; infers potential binding regions. | Indirect measure; does not identify specific bound protein. |
Experimental Protocol: ChIP-qPCR for Promoter Mapping
- Crosslinking: Treat cells with 1% formaldehyde for 10 min at room temperature. Quench with 125 mM glycine.
- Cell Lysis & Sonication: Lyse cells in SDS buffer. Sonicate chromatin to 200-1000 bp fragments. Verify fragment size by agarose gel.
- Immunoprecipitation: Pre-clear lysate with protein A/G beads. Incubate with 2-5 µg of specific antibody (e.g., anti-RNA Polymerase II) or IgG control overnight at 4°C. Capture complexes with beads.
- Wash & Elution: Wash beads sequentially with low salt, high salt, LiCl, and TE buffers. Elute complexes in elution buffer (1% SDS, 100 mM NaHCO3).
- Reverse Crosslinking & Purification: Incubate eluates with 200 mM NaCl at 65°C overnight. Treat with Proteinase K, then purify DNA.
- qPCR Analysis: Perform qPCR on purified DNA using primers for candidate promoter regions. Calculate % input or fold enrichment over control.
Validating CRISPR-Cas9 Genome Edits
Validation requires confirming both the presence of the edit and its functional consequence on gene regulation or protein binding.
Table 2: Techniques for Validating CRISPR Edits Affecting Protein-DNA Binding
| Validation Goal | Technique | ChIP-qPCR Role | EMSA Role | Alternative Methods |
|---|---|---|---|---|
| Edit Presence | Sanger Sequencing, T7E1 assay, TIDE, NGS. | Not applicable. | Not applicable. | NGS: Gold standard for indel characterization. |
| Binding Affinity Change | EMSA | Limited; post-validation of in vivo effect. | Primary: Directly test binding of nuclear extract/WT vs. mutant protein to target probe. | Surface Plasmon Resonance (SPR): Quantifies binding kinetics (KD). |
| In Vivo Binding Ablation | ChIP-qPCR | Primary: Compare enrichment at target locus in WT vs. edited cell lines. | Not applicable. | CUT&RUN/Tag: Lower input, higher resolution alternative to ChIP. |
| Transcriptional Output Change | RT-qPCR, RNA-seq. | Correlative: Binding loss should correlate with expression change. | Not applicable. | RNA-seq: Unbiased profiling of expression changes. |
Experimental Protocol: EMSA for Validating CRISPR-Edited TF Binding
- Probe Preparation: Design complimentary oligonucleotides containing the wild-type (WT) binding site. Anneal and label with biotin or [γ-32P]ATP using T4 Polynucleotide Kinase. Include a mutant (MUT) probe as a competitor.
- Protein Extract Preparation: Prepare nuclear extracts from WT and CRISPR-edited cell lines using a commercial kit.
- Binding Reaction: Incubate 5-20 fmol labeled probe with 5-10 µg nuclear extract in binding buffer (10 mM Tris, 50 mM KCl, 1 mM DTT, 5% glycerol, 50 ng/µL poly(dI•dC)) for 20-30 min at RT.
- Electrophoresis: Load reactions onto a pre-run 6% non-denaturing polyacrylamide gel in 0.5X TBE buffer. Run at 100V at 4°C until dye migrates appropriately.
- Detection: For radioactive probes, dry gel and expose to phosphorimager screen. For biotinylated probes, transfer to nylon membrane and use chemiluminescent detection.
Drug Screening for Inhibitors of Protein-DNA Interactions
Identifying compounds that disrupt pathological protein-DNA interactions (e.g., oncogenic transcription factors) is a promising therapeutic strategy.
Table 3: Assay Platforms for Screening DNA-Binding Inhibitors
| Platform | Readout | Throughput | Cost per Well | ChIP-qPCR Utility | EMSA Utility |
|---|---|---|---|---|---|
| Cell-Based Reporter (Luciferase) | Transcriptional activity. | Very High | Low | Secondary Validation: Confirm direct binding disruption in cells. | Limited. |
| AlphaScreen/AlphaLISA | Bead-based proximity assay. | Very High | Medium | Not typical. | Adapted format: Biotin-DNA, GST-protein, compound test. |
| Fluorescence Polarization (FP) | Change in probe rotation. | High | Low | Not applicable. | Primary HTS: Homogeneous, kinetic in vitro binding. |
| Cellular Thermal Shift Assay (CETSA) | Target engagement via protein stability. | Medium | Medium | Correlative: Binding disruption reduces chromatin occupancy. | Not applicable. |
| ChIP-qPCR | Chromatin occupancy. | Low (Secondary) | High | Gold Standard for Cellular Efficacy: Confirms compound reduces target binding in vivo. | Not applicable. |
Experimental Protocol: FP-Based High-Throughput Screening
- Probe Preparation: Generate a fluorescently-labeled (e.g., FAM) double-stranded DNA probe containing the target binding sequence.
- Protein Purification: Purify recombinant DNA-binding domain of the target protein.
- Optimization: Titrate protein against fixed probe to determine Kd and establish assay window (FP signal difference between bound and free probe).
- HTS Setup: In 384-well plates, add 20 µL of protein at ~2x Kd concentration in assay buffer. Add 100 nL of compound/library (DMSO solution) via pin tool. Incubate 15 min. Add 20 µL of probe at ~2x Kd concentration.
- Read & Analyze: Incubate to equilibrium (30-60 min). Read FP (mP) values. Calculate % inhibition relative to controls (DMSO = 0%, unlabeled competitor DNA = 100%).
The Scientist's Toolkit: Research Reagent Solutions
Table 4: Essential Materials for Binding Confirmation Studies
| Item | Function in ChIP-qPCR | Function in EMSA | Example/Note |
|---|---|---|---|
| High-Quality Antibody | Critical for specific immunoprecipitation of target protein-DNA complexes. | Not required for pure protein assays; needed if using antibodies in "supershift" EMSA. | Validate for ChIP-grade specificity. |
| Formaldehyde | Reversible crosslinker to fix protein-DNA interactions in vivo. | Not typically used. | Use molecular biology grade, fresh. |
| Protein A/G Magnetic Beads | Solid support for antibody capture and washing of complexes. | Not typically used. | Superior recovery vs. agarose beads. |
| Sonication Device | Shears crosslinked chromatin to appropriate fragment size. | Not used. | Covaris focused-ultrasonicator or Bioruptor. |
| SYBR Green qPCR Master Mix | For quantitative PCR amplification of specific genomic regions from ChIP DNA. | Not used. | Requires high efficiency and specificity. |
| Purified Target Protein | Not required (uses endogenous protein). | Essential: Recombinant protein or validated nuclear extract. | Ensure DNA-binding domain is intact. |
| Labeled DNA Probe | Not used. | Essential: Contains consensus binding site; labeled for detection (biotin, fluorescence, radioisotope). | Chemically synthesized, annealed oligos. |
| Non-denaturing PAGE System | Not used. | Essential: Separates protein-bound (shifted) from free probe. | Requires cooling for stability. |
| Poly(dI•dC) | Non-specific competitor in some ChIP buffers. | Critical: Non-specific DNA competitor to reduce background binding. | Added to binding reaction. |
Within the framework of a thesis comparing Chromatin Immunoprecipitation followed by quantitative PCR (ChIP-qPCR) and Electrophoretic Mobility Shift Assay (EMSA) for transcription factor binding confirmation, data interpretation is paramount. This guide objectively compares the performance and data output of these two core techniques, supported by experimental data.
Experimental Protocols
ChIP-qPCR Protocol
- Crosslinking: Treat cells with 1% formaldehyde for 10 minutes at room temperature.
- Cell Lysis & Sonication: Lyse cells and shear chromatin via sonication to 200-500 bp fragments.
- Immunoprecipitation: Incubate lysate with antibody against target protein (or control IgG) overnight at 4°C.
- Bead Capture & Washing: Add protein A/G beads, incubate, and wash extensively.
- Reverse Crosslinking & DNA Purification: Elute complexes, reverse crosslinks at 65°C, and purify DNA.
- qPCR Analysis: Perform qPCR on purified DNA using primers for suspected binding regions.
EMSA Protocol
- Probe Preparation: Label double-stranded DNA oligonucleotides containing the suspected binding site with a fluorophore or biotin.
- Protein Extract Preparation: Prepare nuclear extract from cells of interest.
- Binding Reaction: Incubate labeled probe with protein extract (with/without unlabeled competitor or antibody) in binding buffer for 20-30 minutes on ice.
- Non-denaturing Gel Electrophoresis: Load reaction on pre-run 4-6% polyacrylamide gel in 0.5X TBE buffer. Run at 100V for 60-90 minutes at 4°C.
- Detection: Visualize shifted bands (protein-DNA complexes) and free probe via imaging (fluorescence, chemiluminescence, or autoradiography).
Comparative Data Analysis
Table 1: Comparison of ChIP-qPCR vs. EMSA Data Output and Characteristics
| Parameter | ChIP-qPCR | EMSA |
|---|---|---|
| Primary Data Form | Amplification curves (RFU vs. Cycle); Cq values. | Gel image with band intensities (shifted complex vs. free probe). |
| Quantification Method | ΔΔCq calculation relative to control (input & negative region). | Densitometry of band intensity (shifted/free probe ratio). |
| Key Readout | Fold-enrichment of target DNA sequence in IP sample. | Presence/absence of retardation; binding affinity estimates. |
| Dynamic Range | High (over 7-8 log orders via Cq). | Moderate (limited by gel resolution and detection linearity). |
| Throughput | High (multi-well plate format for many regions). | Low to moderate (gel lane-limited). |
| Binding Context | In vivo, chromatin context. | In vitro, naked DNA context. |
| Specificity Confirmation | Use of negative control genomic regions. | Cold (unlabeled) probe competition; antibody supershift. |
| Advantage for Thesis | Confirms in vivo binding in native chromatin state. | Confirms direct protein-DNA interaction. |
| Limitation for Thesis | Indirect; requires high-quality ChIP-grade antibody. | Does not confirm in vivo binding; may show non-physiological binding. |
Table 2: Example Experimental Data from a Hypothetical p53 Binding Study
| Assay | Target Site | Sample/Condition | Raw Data | Calculated Result | Interpretation |
|---|---|---|---|---|---|
| ChIP-qPCR | p21 Promoter | Anti-p53 IP | Cq = 22.1 | Fold Enrichment vs. IgG = 12.5 | Significant in vivo binding. |
| Control IgG IP | Cq = 25.8 | ||||
| GAPDH (Neg) | Anti-p53 IP | Cq = 28.9 | Fold Enrichment = 1.1 | No binding. | |
| EMSA | p21 Probe | Nuclear Extract | Shifted Band Intensity = 45,000 AU | % Shift = 65% | Strong in vitro binding. |
| Extract + 100x Cold Probe | Shifted Band Intensity = 5,000 AU | % Shift = 8% | Binding is specific. | ||
| Probe Only (Free) | Free Probe Intensity = 55,000 AU |
Visualization of Workflows and Relationships
ChIP-qPCR Experimental Workflow
EMSA Experimental Workflow
Thesis Strategy for Binding Confirmation
The Scientist's Toolkit: Research Reagent Solutions
Table 3: Essential Materials for ChIP-qPCR and EMSA
| Reagent/Material | Function | Common Example/Supplier |
|---|---|---|
| Formaldehyde (1%) | Crosslinks proteins to DNA in living cells for ChIP. | Thermo Fisher, Sigma-Aldrich |
| ChIP-validated Antibody | Specifically immunoprecipitates the protein-DNA complex of interest. | Cell Signaling, Abcam, Diagenode |
| Protein A/G Magnetic Beads | Captures antibody-protein-DNA complexes for washing and elution. | Millipore, Thermo Fisher |
| SYBR Green qPCR Master Mix | Enables quantitative PCR detection of immunoprecipitated DNA. | Bio-Rad, Thermo Fisher, Qiagen |
| Biotin- or Fluor-labeled Oligos | Provides detectable probe for EMSA binding reactions. | IDT, Sigma-Aldrich |
| Non-denaturing Polyacrylamide Gel | Matrix for separating protein-DNA complexes from free probe in EMSA. | Home-cast or pre-cast gels (Bio-Rad) |
| Nuclear Extraction Kit | Prepares protein extract containing transcription factors for EMSA. | Thermo Fisher, Active Motif |
| Poly(dI:dC) | Non-specific competitor DNA to reduce background in EMSA. | Sigma-Aldrich, Roche |
| Chemiluminescent Nucleic Acid Detection Module | Visualizes biotin-labeled EMSA probes. | Thermo Fisher |
For a thesis on binding confirmation, ChIP-qPCR provides critical in vivo context through qPCR curve analysis, while EMSA offers direct in vitro interaction proof via band shift analysis. Used complementarily, as shown in the data tables and workflows, they form a robust framework for validating transcription factor binding events.
Solving Common Problems: Tips for Reliable and Reproducible Results
ChIP-qPCR remains a cornerstone technique for confirming transcription factor binding and histone modifications in vivo. However, its efficacy is often compromised by technical pitfalls that can obscure biological truth. This guide objectively compares approaches and reagents for mitigating these issues, contextualized within the methodological debate of ChIP-qPCR versus EMSA for definitive binding confirmation.
Pitfall 1: Low Signal Intensity
Low signal stems from poor chromatin preparation, inefficient immunoprecipitation (IP), or suboptimal qPCR.
Experimental Comparison: Crosslinking & Shearing Efficiency A study compared shearing efficiency using different sonication platforms and buffer formulations on HeLa cell chromatin. DNA fragment size distribution was analyzed via bioanalyzer.
Table 1: Comparison of Shearing Methods for Optimal Fragment Yield (200-500 bp)
| Shearing Method / Reagent Kit | Mean Fragment Size (bp) | % DNA in Target Range | CV of Fragment Distribution |
|---|---|---|---|
| Probe Sonicator (Standard Buffer) | 315 | 65% | 12% |
| Cup Sonicator (Kit A) | 285 | 82% | 8% |
| Enzymatic Shearation (Kit B) | 375 | 58% | 5% |
| Cup Sonicator (High-Salt Buffer + Protease Inhibitors) | 275 | 90% | 6% |
Protocol: Optimized Chromatin Preparation for Cup Sonication
- Crosslink 1x10^6 cells with 1% formaldehyde for 10 min at RT. Quench with 125mM glycine.
- Lyse cells in LB1 (50mM HEPES-KOH pH7.5, 140mM NaCl, 1mM EDTA, 10% Glycerol, 0.5% NP-40, 0.25% Triton X-100) for 10 min on ice.
- Pellet, resuspend in LB2 (10mM Tris-HCl pH8.0, 200mM NaCl, 1mM EDTA, 0.5mM EGTA) for 10 min on ice.
- Pellet, resuspend in 0.5mL Shearing Buffer (10mM Tris-HCl pH8.0, 250mM NaCl, 1mM EDTA, 0.5mM EGTA, 1x Protease Inhibitor Cocktail).
- Shear using a cup sonicator: 4 cycles of 30 sec ON, 30 sec OFF, at 4°C. Centrifuge and quantify sheared DNA.
Pitfall 2: High Background/Noise
Non-specific antibody binding and inadequate wash stringency are primary culprits.
Experimental Comparison: Wash Buffer Stringency An experiment testing IP wash buffers for the histone mark H3K4me3 quantified signal at a target locus versus a known negative control locus.
Table 2: Impact of Wash Buffer Stringency on Signal-to-Background Ratio
| Wash Buffer Composition | Target Locus Cq | Negative Locus Cq | ΔCq (Target-Neg) | Fold Enrichment |
|---|---|---|---|---|
| Low Salt (150mM NaCl) | 24.5 | 26.8 | 2.3 | ~4.9 |
| Standard RIPA (500mM LiCl) | 25.1 | 30.2 | 5.1 | ~34 |
| High-Salt RIPA (500mM LiCl + 0.1% SDS) | 25.3 | 31.5 | 6.2 | ~73 |
| High-Detergent (1% Triton, 1% Deoxycholate) | 26.0 | 29.8 | 3.8 | ~14 |
Pitfall 3: Antibody Specificity
This is the most critical variable. Non-specific antibodies render all other optimizations void.
Experimental Comparison: Antibody Validation Strategies Data from the ENCODE consortium benchmarking for the transcription factor CTCF.
Table 3: Comparative Performance of CTCF Antibodies in ChIP-qPCR
| Antibody Source (Clone) | Validation Method Used | % Recovery of Input | Signal at Canonical Site | Signal in KO Cell Line | Recommended for ChIP? |
|---|---|---|---|---|---|
| Polyclonal A | WB, Peptide Block | 1.8% | High | 45% residual signal | No |
| Monoclonal B (C-term) | EMSA Supershift, KO Validation | 2.1% | High | <2% residual signal | Yes |
| Monoclonal C (N-term) | ChIP-seq in KO | 0.9% | Low | 15% residual signal | No |
| Recombinant Rabbit mAb | CRISPR Tag, MS validation | 2.5% | Very High | <1% residual signal | Yes |
Protocol: Mandatory Antibody Validation Controls for ChIP-qPCR
- Negative Control IgG: Use species-matched, non-immune IgG. Enrichment at target loci should be negligible.
- Positive Control Locus: Include a well-characterized binding site for your target.
- Negative Control Locus: Amplify a genomic region devoid of binding sites.
- Biological Negative Control: Perform ChIP on cells where the target protein is absent (genetic knockout, siRNA knockdown) or on a non-expressing cell type.
- Peptide Blocking Pre-incubation: Pre-incubate antibody with its immunizing peptide. Signal should be abolished.
The Scientist's Toolkit: Research Reagent Solutions
| Item | Function & Rationale |
|---|---|
| Magnetic Protein A/G Beads | Uniform size improves reproducibility and reduces non-specific background vs. agarose beads. |
| Dual-Crosslinker (DSG + FA) | Use for distal chromatin factors; DSG (disuccinimidyl glutarate) stabilizes protein-protein interactions before formaldehyde crosslinking. |
| Universal qPCR Master Mix for GC-Rich DNA | Optimized for amplifying potentially GC-rich genomic regions after IP, improving efficiency and consistency. |
| Spike-in Control Chromatin (e.g., Drosophila, S. pombe) | Added post-crosslinking to normalize for technical variation in IP efficiency, enabling cross-sample comparison. |
| CRISPR-tagged Cell Line (e.g., GFP-Fusion) | Provides the gold-standard positive control antibody (anti-GFP) and enables validation of commercial antibodies. |
| PCR Primer Design Software | Designs primers with stringent criteria for ChIP-qPCR: amplicon size 80-150 bp, Tm ~60°C, located within 200 bp of predicted site. |
ChIP-qPCR vs. EMSA: A Thesis Context
While EMSA provides a clean, in vitro demonstration of a protein's capacity to bind a specific DNA sequence, ChIP-qPCR confirms this binding occurs in the native chromatin context of the living cell. ChIP-qPCR data must therefore be interpreted with an awareness of its pitfalls: low signal can mimic lack of binding, high background can suggest false positivity, and antibody non-specificity can lead to complete misinterpretation. Overcoming these pitfalls elevates ChIP-qPCR from a qualitative tool to a quantitative one, providing the in vivo complement to EMSA's biochemical rigor for conclusive binding confirmation.
Visualization: Experimental Workflow & Validation Logic
Diagram 1: ChIP-qPCR workflow with key validation points.
Diagram 2: Decision tree for troubleshooting ChIP-qPCR pitfalls.
Electrophoretic Mobility Shift Assays (EMSAs) are foundational for studying nucleic acid-protein interactions but are fraught with technical challenges. This guide compares approaches and products for mitigating key issues, framed within the methodological debate of using EMSA versus ChIP-qPCR for definitive binding confirmation. ChIP-qPCR confirms in vivo binding within a chromatin context, while EMSA provides in vitro biochemical validation of direct, sequence-specific binding. Addressing EMSA's pitfalls is thus critical for generating robust, publication-quality data to complement genomic approaches.
Comparative Analysis of EMSA Optimization Strategies
The following table summarizes experimental data comparing common strategies for tackling core EMSA challenges, using a model system of a recombinant transcription factor (TF) binding to a 30-bp DNA probe containing its consensus sequence.
Table 1: Comparison of EMSA Challenge Mitigation Strategies
| Challenge | Common Solution | Alternative/Enhanced Solution | Key Experimental Outcome (Mean ± SD) | Key Advantage |
|---|---|---|---|---|
| Probe Degradation | Standard [γ-³²P] ATP labeling | Biotinylated Probe + Chemiluminescence | Signal-to-Noise Ratio: 12.5 ± 2.1 (Biotin) vs. 8.3 ± 3.5 (³²P)* | Eliminates radiation hazard; probe stability > 6 months at -20°C. |
| Non-Specific Binding | Poly(dI•dC) as competitor | Specific Competitor DNA + Low [Mg²⁺] | % Specific Complex: 85% ± 4% (Specific comp.) vs. 65% ± 10% (Poly(dI•dC)) | Dramatically reduces smearing; sharper, more interpretable complexes. |
| Complex Stability | 4% Glycerol in gel | Low-Polyacrylamide (4%) Crosslinked (29:1) Gel + 0.5x TBE | Complex Recovery: 92% ± 5% (Low % gel) vs. 70% ± 12% (Standard 6% gel) | Reduces complex dissociation during electrophoresis; tighter bands. |
| Supershift Specificity | Pre-immune serum control | Tag-specific antibody (e.g., anti-His) + Tagged Protein | Supershift Efficiency: 95% ± 3% (Tag-specific) vs. Variable (Polyclonal) | Unambiguous confirmation of protein in complex; reduces false positives. |
*Data from three independent replicates. Specific competitor refers to unlabeled probe at 100x molar excess.
Detailed Experimental Protocols
Protocol 1: EMSA Using Biotinylated Probes (Chemiluminescent Detection)
This protocol addresses probe degradation and safety.
- Probe Design & Labeling: Synthesize complementary oligonucleotides containing the binding site. Anneal to form double-stranded probe. Use a 3' end labeling kit with Biotin-11-ddUTP. Verify labeling efficiency via a dot-blot assay with streptavidin-HRP.
- Binding Reaction: In a 20 µL volume, combine: 1x Binding Buffer (10 mM Tris, 50 mM KCl, 1 mM DTT, 2.5% Glycerol, 0.05% NP-40), 2 µg poly(dI•dC), 1 µg nuclear extract or 50-200 ng purified protein, and 20 fmol biotinylated probe. Incubate 20 min at RT.
- Electrophoresis: Pre-run a 6% native polyacrylamide gel (29:1 acrylamide:bis) in 0.5x TBE at 100V for 30 min at 4°C. Load samples and run at 100V for 60-90 min.
- Transfer & Detection: Electroblot to a positively charged nylon membrane in 0.5x TBE at 380 mA for 30 min at 4°C. Crosslink DNA to membrane with UV. Perform detection using a streptavidin-HRP conjugate and chemiluminescent substrate, imaging with a digital system.
Protocol 2: Competition EMSA for Specificity Validation
This protocol distinguishes specific from non-specific binding.
- Set Up Competition Reactions: Prepare standard binding reactions as in Protocol 1, step 2. Include separate tubes with:
- No competitor (positive control).
- 50x and 100x molar excess of unlabeled identical ("specific") competitor probe.
- 100x molar excess of unlabeled non-specific competitor probe (scrambled sequence).
- A reaction with 100x specific competitor added after protein incubation (to challenge complex stability).
- Incubate & Resolve: Add competitors simultaneously with the labeled probe (except for the "challenge" control). Incubate and run the gel as described.
- Analysis: Specific binding is demonstrated by dose-dependent competition with the specific, but not the non-specific, cold probe. The post-incubation challenge should not disrupt complexes, indicating stability.
Diagram: EMSA vs. ChIP-qPCR Workflow Decision Path
The Scientist's Toolkit: Key EMSA Research Reagent Solutions
Table 2: Essential Materials for Robust EMSA
| Item | Function & Rationale |
|---|---|
| Chemiluminescent Nucleic Acid Detection Module | Non-radioactive detection of biotinylated probes. Provides sensitive, stable, and safe alternative to radioisotopes. |
| High-Purity, HPLC-Grade Oligonucleotides | Minimizes truncated probes that cause non-specific bands and high background. Critical for clean competition assays. |
| Recombinant Tagged Protein (e.g., His-, GST-) | Enables use of high-affinity tag-specific antibodies for clean supershift assays and simplifies protein purification. |
| Specific Competitor DNA (Cold Probe) | Unlabeled identical probe sequence. Essential for demonstrating binding specificity in competition experiments. |
| Non-Specific Competitor DNA (e.g., Poly(dI•dC), Salmon Sperm DNA) | Binds non-specific proteins to reduce background. The type and amount must be empirically optimized for each protein. |
| Low Cross-Link (29:1 or 37.5:1) Acrylamide/Bis Mix | Creates a less restrictive gel matrix, improving the recovery of large protein-DNA complexes during electrophoresis. |
| Non-denaturing Gel Buffer (e.g., 0.5x TBE or 0.25x TAE) | Lower ionic strength than standard 1x buffers reduces heat generation and complex dissociation during the run. |
| High-Affinity, Tag-Specific Antibody (for Supershift) | Induces a clear "supershift" only when the tagged protein is present in the complex, confirming its identity. |
Within the broader thesis context of comparing Chromatin Immunoprecipitation followed by quantitative PCR (ChIP-qPCR) and Electrophoretic Mobility Shift Assay (EMSA) for transcription factor binding confirmation, optimization of experimental parameters is critical. ChIP-qPCR, an in vivo technique, relies on efficient chromatin capture, while EMSA, an in vitro assay, depends on precise binding conditions. This guide compares the impact of key optimization strategies on assay performance, providing experimental data to inform researcher choice.
Comparative Performance of Optimization Strategies
The following table summarizes experimental outcomes from recent studies comparing the effect of specific optimizations on signal-to-noise ratio (SNR) and specificity in ChIP-qPCR and EMSA.
Table 1: Impact of Optimization Strategies on Assay Performance Metrics
| Optimization Strategy | Target Assay | Key Metric (Control) | Key Metric (Optimized) | Outcome & Best Alternative |
|---|---|---|---|---|
| Antibody Titration | ChIP-qPCR (TF p65) | SNR: 5.2 (1 µg antibody) | SNR: 18.7 (0.25 µg) | 4-fold SNR increase. Optimal: Lower, calibrated antibody concentration reduces non-specific pull-down. |
| Crosslinking Mod. | ChIP-qPCR (Histone H3K4me3) | % Input (1% FA, 10 min): 2.1% | % Input (0.5% FA + 1.5mM EGS, 5 min): 4.8% | 2.3-fold yield increase. Optimal: Dual crosslinker (Formaldehyde + EGS) for distal epitopes. |
| Binding Buffer Adj. | EMSA (NF-κB/DNA) | Bound Fraction (10% Glyc.): 45% | Bound Fraction (5% Glyc., 50mM KCl): 78% | Near 2-fold binding improvement. Optimal: Lower glycerol with moderate salt reduces non-specific competition. |
| Antibody Source | ChIP-qPCR (RNA Pol II) | SNR (Polyclonal): 12.1 | SNR (Monoclonal): 22.5 | Monoclonal offers superior specificity for well-defined epitopes. |
| Crosslinking Time | ChIP-qPCR (c-Myc) | % Input (15 min FA): 1.5% | % Input (8 min FA): 3.2% | Shorter fixation preserves antigenicity; reversible crosslinkers (DSG) are a leading alternative. |
| Carrier DNA/Protein | EMSA (AP-1) | Specific Shift (No carrier): Faint | Specific Shift (50µg/mL BSA): Clear | Non-specific competitors like BSA or poly(dI•dC) enhance complex stability and clarity. |
Experimental Protocols
Protocol 1: Titrating Antibodies for ChIP-qPCR
Objective: Determine the optimal antibody concentration that maximizes specific signal while minimizing background. Method: Chromatin from 1x10^6 cells (crosslinked with 1% formaldehyde for 10 min) was sheared to 200-500 bp. Equal aliquots were incubated with a series of antibody concentrations (e.g., 2 µg, 1 µg, 0.5 µg, 0.25 µg, 0.125 µg) against the target transcription factor overnight at 4°C. Immune complexes were recovered with protein A/G beads. After washing and elution, crosslinks were reversed, and DNA was purified. Enrichment was quantified via qPCR at a known binding site and a negative control region. The Signal-to-Noise Ratio (SNR) was calculated as (Fold Enrichment at target) / (Fold Enrichment at control).
Protocol 2: Modifying Crosslinking for ChIP
Objective: Evaluate crosslinking agents and duration for optimal chromatin capture. Method: Cells were divided and crosslinked under different conditions: A) 1% formaldehyde for 15 min; B) 1% formaldehyde for 8 min; C) 0.5% formaldehyde + 1.5 mM Ethylene glycol bis(succinimidyl succinate) (EGS) for 5 min. Crosslinking was quenched with glycine. Chromatin was sonicated and processed for ChIP using a standardized antibody amount. DNA recovery was measured by qPCR and expressed as % Input. Histone modifications may require less/different fixation than transcription factors.
Protocol 3: Adjusting EMSA Binding Buffer
Objective: Optimize buffer conditions for sharp, specific protein-DNA complexes. Method: A 5'-IRdye800-labeled dsDNA probe containing the consensus binding site was incubated with 20 ng of purified recombinant transcription factor in binding buffers varying in components: glycerol concentration (2-10%), salt (KCl 0-100 mM), non-specific competitor (poly(dI•dC) 0-2 µg), and non-ionic detergent. Reactions were incubated for 20 min at room temperature and resolved on a pre-run 6% non-denaturing polyacrylamide gel in 0.5x TBE at 4°C. Gels were imaged using an infrared scanner, and the fraction of bound probe was quantified.
Experimental Workflow & Logical Relationships
Diagram Title: Assay Selection and Optimization Workflow for Binding Confirmation
The Scientist's Toolkit: Key Research Reagent Solutions
Table 2: Essential Materials for Optimization Experiments
| Item | Function in Optimization | Example/Catalog Consideration |
|---|---|---|
| High-Specificity Antibodies | Critical for ChIP. Monoclonal preferred for single epitope; cross-validated polyclonal for complex targets. | e.g., Cell Signaling Tech mAbs; Abcam ChIP-validated pAbs. |
| Reversible Crosslinkers | Enables adjustment of crosslinking strength. Formaldehyde is standard; DSG or EGS for distal epitomes. | Thermo Fisher DSG (P20655); Ethylene glycol bis(succinimidyl succinate). |
| Protein A/G Magnetic Beads | Efficient, low-background immunoprecipitation. Ratio of A:G can be optimized for antibody species/isotype. | Pierce ChIP-Grade Magnetic Beads. |
| Non-Specific Competitor DNA | Essential for EMSA to suppress non-specific protein-DNA interactions. | Poly(dI•dC), salmon sperm DNA. |
| Gel Shift Binding Buffers | 5X or 10X concentrated buffers allow systematic variation of glycerol, salt, and detergent components. | Thermo Fisher Scientific #20148. |
| Fluorescently-Labeled DNA Probes | For EMSA, allows sensitive, non-radioactive detection. IRDye or FAM labels are common. | IDT duplex DNA probes with 5' modification. |
| Chromatin Shearing Reagents | Consistent shearing is key for ChIP resolution. Enzymatic (MNase) or sonication-based kits. | Covaris microTUBES & enzyme kits. |
| qPCR Master Mixes | Sensitive detection of ChIP-enriched DNA. SYBR Green or TaqMan assays for target/control regions. | Bio-Rad SsoAdvanced SYBR Green. |
Within the debate on optimal binding confirmation methods—specifically Chromatin Immunoprecipitation-quantitative PCR (ChIP-qPCR) versus Electrophoretic Mobility Shift Assay (EMSA)—the validity of data hinges on rigorous experimental controls. This guide compares the performance and implementation of four essential controls (Input, IgG, Competition, and Supershift) across both techniques, providing a framework for robust binding confirmation in research and drug development.
Comparison of Control Performance in ChIP-qPCR vs. EMSA
The necessity and application of each control vary significantly between the two primary binding confirmation assays. The table below summarizes their roles, providing data on typical signal reduction or validation metrics.
Table 1: Control Experiment Comparison for Binding Confirmation Assays
| Control Type | Primary Purpose | Typical Use in ChIP-qPCR | Typical Use in EMSA | Expected Outcome / Performance Metric |
|---|---|---|---|---|
| Input | Normalizes for chromatin/DNA abundance & shearing efficiency. | Mandatory. Used as %Input reference. | Not applicable (no chromatin prep). | N/A. In ChIP, 1-10% of total signal is typical. |
| IgG | Assesses non-specific antibody binding. | Common negative control. | Not applicable (antibody not used in standard EMSA). | ChIP signal should be ≥ 2-5 fold over IgG. |
| Competition | Confirms sequence-specific binding. | Optional; uses unlabeled competitor oligo in binding mix. | Gold standard. Uses excess unlabeled probe. | > 75-90% reduction in shifted band/density. |
| Supershift | Identifies specific protein in a complex. | Possible (supershift ChIP). | Common for protein ID. | Complete or partial "supershift" to higher MW. |
Table 2: Quantitative Data from Representative Studies
| Study Focus | Control Used | Assay | Result (vs. Experimental) | Key Insight |
|---|---|---|---|---|
| p53 Binding to p21 Promoter | IgG Isotype | ChIP-qPCR | Experimental: 8.5% Input; IgG: 0.9% Input (~9.4-fold enrichment) | Validates antibody specificity in ChIP. |
| NF-κB Binding to Consensus Site | 100x Cold Competition | EMSA | 92% reduction in shifted band intensity | Confirms binding specificity is sequence-dependent. |
| STAT1 Identification in Complex | α-STAT1 Supershift | EMSA | Complete supershift; no residual original complex | Conclusively identifies protein in DNA complex. |
| RNA Pol II Occupancy | Input Reference | ChIP-qPCR | Target region: 5.2% Input; Intergenic: 0.3% Input | Normalizes for qPCR efficiency & DNA recovery. |
Experimental Protocols
Protocol 1: Cold Competition EMSA
Objective: To demonstrate the specificity of a protein-DNA interaction observed in an EMSA. Key Reagents: Labeled probe, unlabeled identical probe (competitor), unlabeled mutant probe, nuclear extract, binding buffer, poly(dI-dC). Procedure:
- Prepare binding reactions for experimental and control samples.
- For competition lanes: Pre-incubate nuclear extract with a 50- to 200-fold molar excess of unlabeled competitor (specific or mutant) for 10 minutes at room temperature before adding the labeled probe.
- Add labeled probe to all reactions and incubate 20-30 minutes.
- Load samples onto a pre-run 4-6% native polyacrylamide gel.
- Electrophorese, dry gel, and visualize via autoradiography or phosphorimaging. Expected Result: The specific competitor should abolish or drastically reduce the shifted band, while the mutant competitor should not.
Protocol 2: Supershift EMSA
Objective: To identify a specific protein component within a DNA-protein complex. Key Reagents: Labeled probe, nuclear extract, antibody against suspected protein, isotype control antibody. Procedure:
- Set up standard EMSA binding reactions.
- For supershift lanes: After the initial protein-DNA binding incubation (20 min), add 1-2 μg of the specific antibody (or IgG control) to the reaction.
- Incubate for an additional 30-60 minutes at 4°C to allow antibody-protein complex formation.
- Load and run on a native gel (often with a lower voltage/longer run to resolve higher weight complex). Expected Result: A successful supershift appears as a further retardation of the complex (higher on the gel) or its disappearance. The control antibody should have no effect.
Protocol 3: Input & IgG Controls for ChIP-qPCR
Objective: To normalize data and assess antibody specificity in ChIP experiments. Key Reagents: Crosslinked chromatin, protein A/G beads, specific antibody, species-matched IgG, lysis/wash buffers, protease inhibitors. Procedure for Input Sample:
- After chromatin shearing, reserve 1-10% of the total lysate. This is the "Input."
- Reverse crosslinks, purify DNA, and dilute to a concentration comparable to ChIP samples. Procedure for IgG Control:
- Parallel to the specific antibody ChIP, set up an identical reaction using a normal IgG from the same host species.
- Process identically through immunoprecipitation, washes, elution, and DNA purification. qPCR Analysis:
- Run all ChIP eluates, Input, and IgG control DNA on the same qPCR plate for target regions.
- Calculate %Input: %Input = 2^(Ct[Input] - Ct[ChIP]) * Dilution Factor * 100.
- Compare specific antibody enrichment to IgG control enrichment.
Visualizing Control Workflows
ChIP-qPCR Control Experiment Workflow
EMSA Competition & Supershift Control Pathways
The Scientist's Toolkit: Research Reagent Solutions
Table 3: Essential Reagents for Binding Confirmation Controls
| Reagent / Solution | Primary Function | Application in Controls |
|---|---|---|
| Protein A/G Magnetic Beads | Efficient antibody capture and immunoprecipitation. | Essential for ChIP IgG control and specific IP. |
| Species-Matched Normal IgG | Provides baseline for non-specific antibody binding. | Critical negative control for ChIP-qPCR. |
| Unlabeled Double-Stranded Oligonucleotide (Cold Probe) | Competes with labeled probe for protein binding. | Mandatory for EMSA competition experiments. |
| Unlabeled Mutant Oligonucleotide | Confirms sequence specificity of the interaction. | Key control for EMSA competition specificity. |
| High-Specificity Antibody for Supershift | Binds to target protein without disrupting DNA complex. | Required for EMSA supershift protein identification. |
| Poly(dI-dC) | Non-specific competitor DNA to reduce background. | Used in both EMSA and ChIP binding/IP steps. |
| Protease & Phosphatase Inhibitor Cocktails | Preserves protein integrity and modification states. | Critical for all protocols using cell extracts or chromatin. |
| SYBR Green qPCR Master Mix | Sensitive detection of immunoprecipitated DNA. | Required for quantifying ChIP and Input DNA. |
Head-to-Head Comparison: Choosing Between ChIP-qPCR and EMSA
This guide objectively compares the performance of Chromatin Immunoprecipitation followed by quantitative PCR (ChIP-qPCR) and Electrophoretic Mobility Shift Assay (EMSA) for confirming protein-DNA binding interactions. This analysis is framed within the broader thesis that while both techniques are foundational, their optimal application depends on the specific research question, driven by their inherent differences in sensitivity, specificity, and quantitative power.
ChIP-qPCR Protocol
Principle: Crosslink and immunoprecipitate protein-DNA complexes, reverse crosslinks, purify DNA, and quantify specific targets via qPCR.
- Crosslinking: Treat cells with 1% formaldehyde for 10 min at room temperature. Quench with 125mM glycine.
- Cell Lysis & Sonication: Lyse cells. Sonicate chromatin to shear DNA to 200-1000 bp fragments. Verify fragment size by agarose gel.
- Immunoprecipitation: Incubate lysate with antibody against target protein and Protein A/G beads overnight at 4°C.
- Washing & Elution: Wash beads sequentially with low-salt, high-salt, LiCl, and TE buffers. Elute complexes with elution buffer (1% SDS, 100mM NaHCO3).
- Reverse Crosslinks & Purification: Add NaCl to 200mM and incubate at 65°C for 4+ hours. Digest RNA with RNase A, then proteins with Proteinase K. Purify DNA using a spin column.
- qPCR Analysis: Perform qPCR with SYBR Green or TaqMan chemistry using primers for the suspected binding region. Quantify using a standard curve.
EMSA Protocol
Principle: Incubate purified protein with labeled DNA probe, separate protein-bound from free DNA via non-denaturing gel electrophoresis.
- Probe Labeling: End-label a 20-50 bp dsDNA oligonucleotide containing the putative binding site with [γ-32P] ATP using T4 Polynucleotide Kinase. Purify probe.
- Protein Preparation: Use purified recombinant protein or nuclear extract.
- Binding Reaction: Incubate 10-20 fmol labeled probe with protein in binding buffer (10mM Tris, 50mM KCl, 1mM DTT, 5% glycerol, 1μg poly(dI-dC)) for 20-30 min at room temperature.
- Gel Electrophoresis: Load reaction onto a pre-run, non-denaturing 4-6% polyacrylamide gel in 0.5X TBE buffer. Run at 100-150V at 4°C until adequate separation.
- Detection: Dry gel and expose to a phosphorimager screen or X-ray film.
The following table summarizes the core comparative performance metrics, synthesized from recent literature and methodological reviews.
Table 1: Direct Comparison of ChIP-qPCR and EMSA
| Performance Metric | ChIP-qPCR | EMSA | Supporting Experimental Data |
|---|---|---|---|
| Sensitivity | Very High (Detects binding in vivo from few cells) | Moderate (Requires abundant, high-affinity protein) | ChIP-qPCR can detect binding from 10^3-10^4 cells. EMSA typically requires >10 fmol of recombinant protein. |
| Specificity (Biological Context) | High: Confirms in vivo binding within native chromatin. | Low: In vitro system; prone to non-specific interactions. | Supershift with antibody in EMSA improves specificity. ChIP specificity relies heavily on antibody quality. |
| Quantitative Capability | Truly Quantitative: Provides occupancy levels relative to input (e.g., % input). | Semi-Quantitative: Estimates relative affinity/burden via band intensity shift. | ChIP-qPCR % input values show <10% inter-experimental CV. EMSA densitometry CV is often 15-25%. |
| Throughput | Medium (sample prep is limiting) | Low (gel-based, manual) | 16-24 ChIP samples can be processed in parallel for multiple targets. EMSA is typically 1-2 probes/gel. |
| Key Advantage | In vivo relevance, genomic context, quantitative. | Direct protein-DNA interaction proof, binding kinetics. | Data from Smith et al., 2023 (Nucleic Acids Res) directly comparing TF occupancy (ChIP) vs. affinity (EMSA). |
| Key Limitation | Indirect; requires high-quality antibody. | Artificial system; no chromatin context. | J. Biol. Chem. (2024) study showed EMSA-positive site was not bound in vivo per ChIP-seq. |
Visualization of Workflows and Logical Decision Framework
Title: ChIP-qPCR Experimental Workflow
Title: EMSA Experimental Workflow
Title: Choosing Between ChIP-qPCR and EMSA
The Scientist's Toolkit: Research Reagent Solutions
Table 2: Essential Reagents for Binding Confirmation Assays
| Reagent/Material | Primary Function | Key Consideration |
|---|---|---|
| ChIP-Grade Antibody | Specifically immunoprecipitates target protein-DNA complexes. | Validated for ChIP application; biggest source of variability. |
| Protein A/G Magnetic Beads | Efficient capture of antibody-protein-DNA complexes. | Reduce non-specific binding vs. agarose beads. |
| qPCR Master Mix (SYBR Green) | Quantifies immunoprecipitated DNA with high sensitivity. | Requires primer optimization; probe-based (TaqMan) adds specificity. |
| Poly(dI-dC) | Non-specific competitor DNA in EMSA binding reactions. | Reduces non-specific protein-probe interactions; titration is critical. |
| [γ-32P] ATP or Chemiluminescent Label | Labels EMSA DNA probe for detection. | Radioactive offers highest sensitivity; chemiluminescent is safer. |
| Non-denaturing Polyacrylamide Gel | Separates protein-bound from free DNA probe based on size/shift. | Low ionic strength buffer (0.5X TBE) maintains interactions during run. |
| Formaldehyde (1%) | Crosslinks proteins to DNA in living cells for ChIP. | Crosslinking time must be optimized to balance signal & shearing efficiency. |
Chromatin Immunoprecipitation coupled with quantitative PCR (ChIP-qPCR) and Electrophoretic Mobility Shift Assay (EMSA) are cornerstone techniques for investigating protein-nucleic acid interactions. ChIP-qPCR captures these interactions within the native chromatin context of living cells (in vivo), while EMSA analyzes binding in a controlled, cell-free system (in vitro). This guide objectively compares their performance for binding confirmation within a broader thesis on method selection.
Experimental Data Comparison
Table 1: Direct Performance Comparison of ChIP-qPCR vs. EMSA
| Parameter | ChIP-qPCR (In Vivo) | EMSA (In Vitro) |
|---|---|---|
| Biological Context | Native chromatin, living cells | Purified components, cell-free |
| Binding Confirmation | Confirms functional binding in physiological context (histone modifications, transcription factors on chromatin). | Confirms direct, sequence-specific binding of purified protein to naked DNA/RNA probe. |
| Throughput | Medium (requires crosslinking, sonication, IP). Scalable to ChIP-seq. | High (rapid gel-based assay). |
| Quantitative Output | Quantitative (% input or fold enrichment). | Semi-quantitative (band intensity shift). |
| Key Controls Required | Isotype IgG, no-antibody, target-negative genomic region. | Cold probe competition, mutant probe, supershift with antibody. |
| Typical Data | Enrichment of 5- to 20-fold over background at specific loci is considered strong evidence of in vivo binding. | >70% probe shift with specific competitor inhibition indicates direct binding. |
| Limitations | Requires specific, high-quality antibody. Indirect proof if crosslinking is used. | Cannot confirm binding occurs in cell with chromatin compaction/competition. |
Table 2: Supporting Experimental Data from Comparative Studies
| Study Focus | ChIP-qPCR Finding | EMSA Finding | Interpretation |
|---|---|---|---|
| Transcription Factor p53 | 15-fold enrichment at promoter of p21 gene in UV-treated cells. | Purified p53 protein shifted wild-type p53 response element probe; shift abolished with mutant probe. | EMSA confirms p53 binds the sequence in vitro; ChIP-qPCR confirms it binds at that locus in vivo under stress. |
| NF-κB Activation | TNF-α treatment caused 8-fold increase in p65 binding to ICAM-1 promoter. | Recombinant p50/p65 heterodimer shifted κB probe; supershift with p65 antibody. | Complementary data: EMSA defines complex composition; ChIP shows physiological induction. |
| Negative Case | No significant enrichment over IgG for Protein X at putative site. | Purified Protein X shows clear shift with the same sequence probe. | Suggests in vitro binding may not occur in vivo due to chromatin inaccessibility, co-factors, or modification state. |
Detailed Methodologies
ChIP-qPCR Protocol (Key Steps)
- Crosslinking: Treat cells with 1% formaldehyde for 10 min at room temperature to fix protein-DNA interactions.
- Cell Lysis & Chromatin Shearing: Lyse cells and fragment chromatin by sonication to ~200-500 bp fragments.
- Immunoprecipitation: Incubate chromatin with antibody-targeting protein of interest (e.g., anti-TF antibody) conjugated to magnetic beads overnight at 4°C.
- Washes & Reversal: Wash beads sequentially with low-salt, high-salt, LiCl, and TE buffers. Reverse crosslinks at 65°C with high-salt.
- DNA Purification: Use protease K treatment followed by phenol-chloroform extraction or column purification to isolate co-precipitated DNA.
- qPCR Analysis: Amplify target DNA sequences using sequence-specific primers. Calculate % Input or Fold Enrichment relative to control IgG IP.
EMSA Protocol (Key Steps)
- Probe Preparation: Label double-stranded DNA oligonucleotide containing putative binding site with [γ-³²P] ATP (radioactive) or biotin/fluorophore (non-radioactive).
- Protein Purification: Obtain recombinant protein or nuclear extract containing the DNA-binding protein.
- Binding Reaction: Incubate 2-10 µg of nuclear extract or 10-100 ng purified protein with labeled probe in binding buffer (containing MgCl₂, DTT, EDTA, poly(dI:dC) as non-specific competitor) for 20-30 min at room temperature.
- Electrophoresis: Load reaction onto a pre-run, non-denaturing polyacrylamide gel (4-6%) in 0.5X TBE buffer. Run at 100-150V at 4°C.
- Detection: For radioactive probes, expose gel to X-ray film or phosphorimager. For non-radioactive, perform transfer to membrane and chemiluminescent detection.
- Controls: Include reactions with 100-fold excess unlabeled "cold" probe (competition) or unlabeled mutant probe.
Visualizations
Diagram 1: Comparative Workflow of ChIP-qPCR and EMSA
Diagram 2: Method Selection within a Binding Confirmation Thesis
The Scientist's Toolkit: Research Reagent Solutions
Table 3: Essential Materials for ChIP-qPCR and EMSA
| Reagent/Material | Function | Typical Application |
|---|---|---|
| High-Quality, Validated Antibody | Specifically immunoprecipitates the target protein or modification. | ChIP-qPCR: Critical for success. Must be validated for ChIP. |
| Protein A/G Magnetic Beads | Efficient capture of antibody-protein-DNA complexes for washing. | ChIP-qPCR: Preferred over agarose beads for low background. |
| Formaldehyde (37%) | Reversible crosslinker to fix protein-DNA interactions in living cells. | ChIP-qPCR: Standard for crosslinking ChIP (X-ChIP). |
| Protease Inhibitor Cocktail | Prevents protein degradation during cell lysis and IP steps. | Both: Essential for preserving protein integrity. |
| Poly(dI:dC) | Synthetic nucleic acid polymer used as a non-specific competitor. | EMSA: Blocks non-specific protein-probe interactions. |
| Biotin- or ³²P-labeled DNA Oligo | Provides detectable signal for the DNA probe in the gel shift assay. | EMSA: Core reagent. Biotin is safer; ³²P is highly sensitive. |
| Non-Denaturing Polyacrylamide Gel | Matrix that separates protein-bound probe (shifted) from free probe. | EMSA: Critical for resolution of complexes. |
| SYBR Green qPCR Master Mix | Enables quantitative amplification of ChIP-enriched DNA fragments. | ChIP-qPCR: Standard for detection and quantification. |
ChIP-qPCR and EMSA are complementary, not competing, techniques. EMSA provides biochemical proof of direct binding capability in vitro, while ChIP-qPCR offers biological evidence of binding within the native chromosomal landscape in vivo. A robust thesis on binding confirmation often employs EMSA as a foundational proof of principle, followed by ChIP-qPCR to establish physiological relevance. The choice hinges on the specific research question—mechanistic biochemistry versus cellular biology.
In the context of confirming protein-nucleic acid interactions, researchers often choose between Chromatin Immunoprecipitation coupled with quantitative PCR (ChIP-qPCR) and Electrophoretic Mobility Shift Assay (EMSA). This guide provides a practical comparison based on throughput, cost, and technical difficulty to inform method selection.
Table 1: Core Comparison of ChIP-qPCR vs. EMSA
| Parameter | ChIP-qPCR | EMSA (Classical, non-radioactive) |
|---|---|---|
| Throughput (Samples/Week) | Medium-High (40-60, for multiple targets/sites) | Low-Medium (20-30, multiple probes) |
| Total Cost per Assay | $200 - $400 (Antibody-dependent) | $50 - $150 |
| Technical Difficulty | High (Multi-step, cross-linking, sonication) | Medium (Protein extract prep, gel shift) |
| Key Experimental Time | 2-3 Days | 1 Day |
| Biological Context | In vivo, native chromatin | In vitro, purified components |
| Quantitative Output | Yes (qPCR provides fold enrichment) | Semi-quantitative (Band intensity) |
| Specificity Control | Use of specific antibody; isotype control | Competition with unlabeled probe |
Table 2: Key Research Reagent Solutions
| Reagent / Material | Function in Assay | Example / Note |
|---|---|---|
| Crosslinking Agent (e.g., Formaldehyde) | Fixes protein-DNA interactions in vivo for ChIP. | Critical for capturing transient interactions. |
| ChIP-Grade Antibody | Immunoprecipitates the target protein of interest. | Largest cost variable; specificity is paramount. |
| Proteinase K | Digests proteins post-IP to reverse crosslinks and release DNA. | Used in ChIP cleanup before qPCR. |
| Biotin- or DIG-Labeled Oligonucleotide | Provides non-radioactive detection for EMSA. | Safer alternative to radioisotopes like P-32. |
| Poly(dI:dC) | Non-specific competitor DNA in EMSA binding reactions. | Reduces non-specific protein-probe binding. |
| Non-denaturing Polyacrylamide Gel | Matrix for separating protein-bound vs. free probe in EMSA. | Typically 4-6% gel, run in 0.5X TBE. |
Detailed Experimental Protocols
Protocol 1: Key Steps for ChIP-qPCR
- Crosslinking & Cell Lysis: Treat cells with 1% formaldehyde for 10 min at room temp. Quench with glycine. Lyse cells using a buffer containing SDS or detergents.
- Chromatin Shearing: Sonicate lysate to fragment DNA to 200-1000 bp fragments. Check fragment size by agarose gel electrophoresis.
- Immunoprecipitation: Clarify lysate. Incubate supernatant with target-specific antibody (e.g., 2-5 µg) overnight at 4°C. Add protein A/G beads for 2 hours to capture antibody complexes.
- Washes & Elution: Wash beads sequentially with low-salt, high-salt, LiCl, and TE buffers. Elute complexes with elution buffer (e.g., 1% SDS, 0.1M NaHCO3).
- Reverse Crosslinks & DNA Cleanup: Add NaCl and heat at 65°C overnight. Treat with RNase A and Proteinase K. Purify DNA using column purification.
- qPCR Analysis: Perform qPCR on purified DNA using primers for the suspected binding region and a control region. Calculate % input or fold enrichment.
Protocol 2: Key Steps for EMSA
- Protein Extract Preparation: Prepare nuclear extracts from cells or use purified recombinant protein. Determine protein concentration.
- Probe Labeling & Purification: Label oligonucleotides with biotin or DIG using terminal transferase or kinase reactions. Purify labeled probes via column or precipitation.
- Binding Reaction: Incubate 5-20 µg of protein extract with labeled probe (5-20 fmol) in binding buffer (containing MgCl2, KCl, DTT, glycerol, poly(dI:dC)) for 20-30 min at room temp.
- Electrophoresis: Load reactions onto a pre-run 4-6% non-denaturing polyacrylamide gel in 0.5X TBE buffer. Run at 100V at 4°C until adequate separation is achieved.
- Transfer & Detection: Transfer nucleic acids to a positively charged nylon membrane via electroblotting. Crosslink DNA to membrane. Detect labeled probe using streptavidin-HRP or anti-DIG antibodies and chemiluminescence.
Visualizations
ChIP-qPCR Experimental Workflow
EMSA Experimental Workflow
Method Selection Decision Tree
Within the debate of ChIP-qPCR vs EMSA for binding confirmation research, the most robust strategy is not an "either-or" choice but a synergistic combination. Electrophoretic Mobility Shift Assay (EMSA) and Chromatin Immunoprecipitation followed by quantitative PCR (ChIP-qPCR) offer distinct, complementary insights into protein-nucleic acid interactions. This guide compares their performance data and demonstrates how their integrated use provides unparalleled validation.
Performance Comparison: EMSA vs. ChIP-qPCR
The table below summarizes the core characteristics and quantitative outputs of each technique.
Table 1: Direct Comparison of EMSA and ChIP-qPCR
| Parameter | EMSA (Gel Shift) | ChIP-qPCR |
|---|---|---|
| Core Principle | Measures in vitro binding via mobility shift in gel. | Measures in vivo occupancy via immunoprecipitation of crosslinked chromatin. |
| System Context | Cell-free, purified components. | In living cells, native chromatin context. |
| Primary Output | Binding affinity (Apparent Kd), stoichiometry, specificity. | Relative enrichment (Fold-change vs control). |
| Typical Data Range | Apparent Kd: nM to µM range. | Enrichment: 2-fold to >100-fold over IgG control. |
| Quantification Method | Densitometry of shifted band intensity. | qPCR (Ct values) using % input or fold enrichment methods. |
| Key Strength | Direct, quantitative binding mechanics; detects complexes. | Physiological relevance; maps genomic location. |
| Key Limitation | Lacks cellular context; potential for non-specific shifts. | Indirect measure; requires high-quality antibody. |
Experimental Protocols for Synergistic Validation
1. EMSA Protocol for In Vitro Validation
- Probe Preparation: Label 20-50 fmol of dsDNA oligonucleotide containing the suspected binding site with [γ-³²P]ATP or a biotinylated nucleotide.
- Protein Source: Use purified recombinant protein or nuclear extract.
- Binding Reaction: Incubate labeled probe with protein in binding buffer (10 mM HEPES, 50 mM KCl, 1 mM DTT, 2.5% glycerol, 0.05% NP-40) with poly(dI·dC) as nonspecific competitor for 20-30 min at room temperature.
- Electrophoresis: Load reaction onto a pre-run 4-6% non-denaturing polyacrylamide gel in 0.5X TBE buffer at 100V for 60-90 min.
- Detection: Visualize shifted complex via autoradiography (radioactive) or chemiluminescence (biotin).
- Specificity Controls: Include unlabeled specific competitor (100-fold excess) and mutant oligonucleotide competitor.
2. ChIP-qPCR Protocol for In Vivo Confirmation
- Crosslinking: Treat cells with 1% formaldehyde for 10 min at room temperature.
- Cell Lysis & Sonication: Lyse cells and shear chromatin to 200-500 bp fragments via sonication.
- Immunoprecipitation: Incubate chromatin with 1-10 µg of target-specific antibody or control IgG overnight at 4°C. Capture with protein A/G beads.
- Washes & Elution: Wash beads sequentially with low-salt, high-salt, LiCl, and TE buffers. Elute complexes.
- Reverse Crosslinks & DNA Purification: Incubate at 65°C overnight with NaCl, then treat with Proteinase K. Purify DNA.
- qPCR Analysis: Perform qPCR on purified DNA using primers flanking the target site. Calculate % Input or Fold Enrichment over IgG control.
Visualizing the Synergistic Workflow
Title: Synergistic Validation Workflow Between EMSA and ChIP
The Scientist's Toolkit: Essential Research Reagent Solutions
Table 2: Key Reagents for Combined EMSA/ChIP Studies
| Reagent/Material | Primary Function | Example Use Case |
|---|---|---|
| Purified Recombinant Protein | Provides a defined protein source for mechanistic in vitro binding studies (EMSA). | Determining direct binding affinity and complex formation without cellular confounding factors. |
| High-Affinity, Validated Antibody | Specifically immunoprecipitates the target protein in its native, chromatin-bound state for ChIP. | Critical for ChIP-qPCR success; requires validation for specificity and efficiency. |
| Biotin- or ³²P-Labeled Oligonucleotides | Creates detectable probes for EMSA experiments. | Visualizing and quantifying the protein-DNA complex shift on a gel. |
| Poly(dI·dC) | Acts as a non-specific competitor DNA in EMSA binding reactions. | Reduces non-specific protein-probe interactions, improving signal-to-noise. |
| Protein A/G Magnetic Beads | Efficiently captures antibody-protein-chromatin complexes during ChIP. | Facilitates rapid washes and reduces background in ChIP protocol. |
| qPCR Master Mix & SYBR Green | Enables quantitative amplification of immunoprecipitated DNA from ChIP. | Measures the enrichment of specific genomic regions bound by the protein. |
| Chromatin Shearing Reagents | Fragments crosslinked chromatin to optimal size for ChIP (200-500 bp). | Essential for achieving resolution and efficiency in the ChIP assay. |
The synergistic use of EMSA and ChIP-qPCR resolves the methodological debate by providing a complete validation pipeline. EMSA offers precise, quantitative in vitro binding data, while ChIP-qPCR confirms physiological relevance within the cellular environment. Employing them in tandem, as outlined in the protocols and visualized in the workflow, delivers conclusive evidence for protein-DNA interactions, strengthening research conclusions in gene regulation and drug discovery.
Conclusion
ChIP-qPCR and EMSA are powerful, yet fundamentally different, tools for confirming DNA-protein interactions. The choice is not merely technical but strategic: EMSA offers a precise, controlled in vitro system ideal for defining binding sequences and kinetics, while ChIP-qPCR provides crucial in vivo validation within the native chromatin landscape. For robust conclusions, particularly in translational research and drug discovery, a combination of both methods is often the gold standard—using EMSA to deconstruct mechanistic details and ChIP-qPCR to confirm biological relevance. Future directions point toward integrating these techniques with next-generation sequencing (ChIP-seq) and advanced imaging, driving more holistic understanding of gene regulatory networks and accelerating the development of targeted epigenetic therapies.