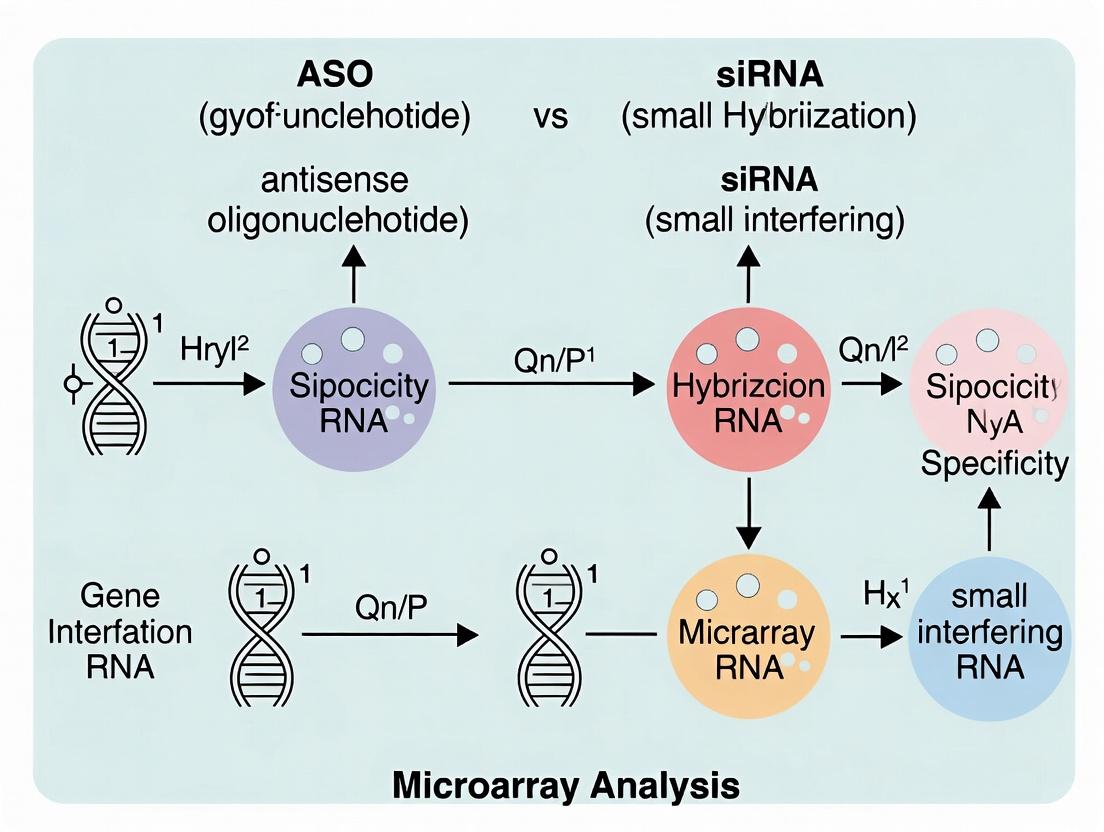
ASO vs siRNA: A Comprehensive Microarray Analysis Guide for Specificity Assessment in Therapeutic Development
This article provides researchers, scientists, and drug development professionals with a detailed framework for evaluating the specificity of Antisense Oligonucleotides (ASOs) and small interfering RNAs (siRNAs) using microarray analysis.
ASO vs siRNA: A Comprehensive Microarray Analysis Guide for Specificity Assessment in Therapeutic Development
Abstract
This article provides researchers, scientists, and drug development professionals with a detailed framework for evaluating the specificity of Antisense Oligonucleotides (ASOs) and small interfering RNAs (siRNAs) using microarray analysis. We explore the foundational biology of these nucleic acid therapeutics, outline robust methodological workflows for specificity profiling, address common troubleshooting and optimization challenges, and present comparative validation strategies. The guide synthesizes current best practices to enable informed reagent selection and minimize off-target effects in preclinical research.
Understanding ASO and siRNA Biology: The Foundation for Specificity Analysis
This comparison guide, framed within a broader thesis on ASO vs. siRNA specificity via microarray analysis, details the core mechanistic distinctions between RNase H1-mediated antisense oligonucleotide (ASO) activity and RNA-induced silencing complex (RISC)-mediated small interfering RNA (siRNA) activity. Understanding these pathways is critical for researchers and drug development professionals selecting oligonucleotide modalities for therapeutic or research applications.
RNase H1-Mediated Degradation (ASOs)
Single-stranded antisense oligonucleotides (ASOs), typically 16-20 nucleotides long and often chemically modified (e.g., phosphorothioate backbone, 2'-MOE, or cEt modifications), function in the nucleus. They bind to complementary RNA transcripts via Watson-Crick base pairing. This formation of a DNA-RNA heteroduplex recruits the endogenous enzyme RNase H1. RNase H1 cleaves the RNA strand of the duplex, leading to degradation of the target mRNA. The ASO is then released and can bind to additional transcripts, enabling catalytic turnover.
RISC-Mediated Cleavage (siRNAs)
Double-stranded small interfering RNAs (siRNAs), typically 21-23 base pairs, are loaded into the RNA-induced silencing complex (RISC) in the cytoplasm. The passenger strand is cleaved and discarded, while the guide strand remains bound. The activated RISC, guided by the siRNA, scans for and binds to perfectly complementary mRNA sequences. The slicer activity of the RISC component Argonaute 2 (Ago2) cleaves the target mRNA between nucleotides 10 and 11 relative to the guide strand’s 5’ end. The cleaved mRNA fragments are subsequently degraded, and RISC can engage in multiple rounds of cleavage (catalytic).
Quantitative Comparison of Key Parameters
Table 1: Core Mechanistic and Performance Comparison
| Parameter | RNase H1-mediated ASOs | RISC-mediated siRNAs |
|---|---|---|
| Oligo Structure | Single-stranded DNA-like | Double-stranded RNA |
| Primary Site of Action | Nucleus | Cytoplasm |
| Effector Enzyme | Endogenous RNase H1 | Argonaute 2 (within RISC) |
| Catalytic Nature | Enzyme (RNase H1) is catalytic; ASO can be reusable | RISC complex is catalytic; siRNA guide strand is reusable |
| Mismatch Tolerance | Tolerant of some mismatches (depends on design) | Highly sensitive to mismatches in seed region (2-8 nt from 5' of guide) |
| Typical Design Length | 16-20 nucleotides | 21-23 base pairs |
| Primary Chemical Modifications | Phosphorothioate backbone, 2'-O-MOE, cEt, LNA | Phosphorothioate, 2'-F, 2'-O-Methyl (on passenger/guide strands) |
| Off-Target Risk (Sequence-based) | Lower; stringent design can reduce miRNA-like seed effects | Higher; potential for guide strand seed region-mediated miRNA-like off-targets |
| Potency (typical IC₅₀) | Low nM to high nM range | Low pM to low nM range |
| Duration of Action | Weeks (depends on target turnover & tissue) | Weeks to months (due to RISC stability) |
Table 2: Supporting Experimental Data from Key Studies
| Study (Example) | Modality | Target | Key Quantitative Result | Assay |
|---|---|---|---|---|
| Crooke et al., 2021 (NAR) | Gapmer ASO | MALAT1 (mouse liver) | ~80% knockdown sustained for 6+ weeks after last dose | RT-qPCR of liver mRNA |
| Foster et al., 2018 (Cell) | siRNA (GalNAc-conj.) | TTR (human clinical) | >80% serum TTR reduction sustained over 6 months | Serum protein immunoassay |
| Lennox & Behlke, 2011 (NBT) | siRNA vs ASO | Multiple | siRNA avg. IC₅₀: 0.3 nM; ASO avg. IC₅₀: 20 nM | RT-qPCR in HeLa cells |
| Microarray Analysis (Hypothetical for Thesis) | siRNA & ASO | Genome-wide | siRNA: 100s of seed-based off-targets; ASO: <10 significant off-targets | Gene expression microarray |
Experimental Protocols for Key Analyses
Protocol 1: In Vitro Potency (IC₅₀) Determination for ASOs/siRNAs
- Cell Seeding: Plate appropriate cells (e.g., HeLa, HepG2) in 96-well plates.
- Transfection: At 50-70% confluency, transfert cells with a dose-response series of ASO (using lipid transfection) or siRNA (using lipid-based or polymer-based transfection reagent). Include negative control (scrambled sequence) and positive control (known active oligo).
- Incubation: Incubate for 24-48 hours to allow knockdown.
- RNA Isolation: Lyse cells and isolate total RNA using a column-based kit.
- cDNA Synthesis: Perform reverse transcription using random hexamers or oligo-dT primers.
- Quantitative PCR (qPCR): Run target and housekeeping gene (e.g., GAPDH, HPRT1) assays in triplicate.
- Data Analysis: Calculate relative knockdown (2^(-ΔΔCt)) vs. negative control. Plot % remaining mRNA vs. log[oligo concentration] and fit a 4-parameter logistic curve to determine IC₅₀.
Protocol 2: Microarray Analysis for Off-Target Profiling
- Sample Preparation: Treat cells in triplicate with ASO, siRNA, or appropriate controls at a pharmacologically relevant concentration (e.g., 10-100 nM).
- RNA Extraction & Quality Control: Isolate total RNA, assess integrity (RIN > 9.0 via Bioanalyzer).
- Labeling and Hybridization: Amplify and label cDNA/cRNA with fluorescent dyes (e.g., Cy3, Cy5). Hybridize to a whole-genome expression microarray chip.
- Scanning and Feature Extraction: Scan slides, extract raw intensity values.
- Bioinformatics Analysis: Normalize data (e.g., RMA algorithm). Perform differential expression analysis (e.g., Limma package) comparing treated vs. control. Filter for statistically significant (adjusted p-value < 0.05) and fold-change (e.g., |FC| > 1.5) genes. For siRNA, perform seed region (nucleotides 2-8 of guide strand) analysis to predict seed-based off-targets.
Pathway and Workflow Visualizations
Title: RNase H1-mediated ASO Mechanism
Title: RISC-mediated siRNA Mechanism
Title: Microarray Off-Target Profiling Workflow
The Scientist's Toolkit: Key Research Reagent Solutions
Table 3: Essential Materials for Oligonucleotide Mechanism Studies
| Item | Function in Research | Example Vendor/Product |
|---|---|---|
| Chemically Modified ASOs/siRNAs | The active agents for knockdown; modifications enhance stability, potency, and delivery. | Integrated DNA Technologies (IDT), Horizon Discovery, Bio-Synthesis Inc. |
| Lipid-based Transfection Reagent | For in vitro delivery of oligonucleotides into cells (e.g., Lipofectamine 2000/3000, RNAiMAX). | Thermo Fisher Scientific |
| RNase H1 Enzyme (Recombinant) | For in vitro biochemical assays to validate ASO mechanism and cleavage efficiency. | New England Biolabs (NEB), Trevigen |
| Argonaute 2 (Ago2) Antibody | For immunoprecipitation (RIP-Chip/CLIP) to study RISC loading or identify endogenous targets. | Abcam, Cell Signaling Technology |
| Total RNA Isolation Kit | High-quality RNA extraction essential for downstream qPCR and microarray analysis. | Qiagen RNeasy, Zymo Research |
| Microarray Platform | Genome-wide profiling for on-target efficacy and off-target signature discovery. | Affymetrix GeneChip, Agilent SurePrint G3 |
| RT-qPCR Master Mix | Quantitative measurement of target mRNA knockdown and validation of microarray hits. | Bio-Rad iTaq Universal SYBR, TaqMan assays (Thermo Fisher) |
| Bioinformatics Software | For analysis of microarray data, differential expression, and seed match prediction. | R/Bioconductor (Limma), Partek Flow, Ingenuity Pathway Analysis (QIAGEN) |
Within the framework of ASO (antisense oligonucleotide) versus siRNA (small interfering RNA) specificity research, microarray analysis provides a powerful tool to evaluate off-target effects. Specificity is governed by three core determinants: sequence length, chemical modification, and target site accessibility. This guide compares the performance of ASOs and siRNAs in light of these determinants, supported by experimental data.
Performance Comparison: ASO vs. siRNA Specificity
The following tables summarize key findings from recent microarray-based specificity analyses.
Table 1: Impact of Sequence Length on Specificity (Microarray Analysis)
| Oligo Type | Typical Length (nt) | Avg. Off-Target Transcripts Identified (Microarray) | Primary Off-Target Mechanism |
|---|---|---|---|
| ASO (Gapmer) | 16-20 | 50-200 | RNase H1-mediated degradation of transcripts with 3-5 contiguous base matches. |
| siRNA (duplex) | 21 | 100-500 | Seed-region (nucleotides 2-8) complementarity leading to miRNA-like translational suppression. |
Table 2: Influence of Chemical Modifications on Specificity & Affinity
| Chemistry (Example) | Oligo Type | Effect on Binding Affinity (ΔTm/nt) | Microarray-Validated Specificity Improvement |
|---|---|---|---|
| 2'-O-Methyl (2'-OMe) | ASO/siRNA | +0.5 to +1.5 °C | Moderate reduction in immune stimulation and seed-driven off-targets. |
| 2'-Fluoro (2'-F) | ASO/siRNA | +1.0 to +2.5 °C | Enhanced nuclease resistance; slight improvement in specificity profiles. |
| Locked Nucleic Acid (LNA) | ASO (Gapmer wings) | +2.0 to +8.0 °C | High risk of off-targets if overused; requires careful sequence design. |
| Phosphorodiamidate Morpholino (PMO) | ASO | Neutral | High specificity due to RNA binding without RNase H recruitment; minimal off-targets. |
| 2'-O-Methoxyethyl (2'-MOE) | ASO (Gapmer wings) | +1.0 to +1.5 °C | Significant reduction in off-targets compared to 1st-gen ASOs; improved pharmacokinetics. |
Table 3: Target Site Accessibility (Predicted vs. Experimental Efficacy)
| Target Region | Predicted Accessibility (SAFE Score) | ASO Efficacy (Knockdown %) | siRNA Efficacy (Knockdown %) | Correlation with Microarray Specificity |
|---|---|---|---|---|
| 5' UTR | Low | 20-40% | 10-30% | Low efficacy can lead to high concentrations, increasing off-target risk. |
| CDS | Medium | 50-80% | 60-90% | Good efficacy; off-targets are more chemistry/sequence-dependent. |
| 3' UTR | High | 70-95% | 70-95% | Highest efficacy; optimal for both types but siRNA seed effects are pronounced here. |
Experimental Protocols for Specificity Microarray Analysis
Protocol 1: Comprehensive Off-Target Profiling using Microarrays
- Treatment: Transfert cells (e.g., HeLa, HepG2) with a optimized concentration of ASO (e.g., 10-50 nM) or siRNA (e.g., 10 nM) using a appropriate lipid transfection reagent. Include a scramble sequence control and untreated control.
- RNA Isolation: At 24 hours post-transfection (for siRNA) or 48 hours (for ASO), harvest cells and isolate total RNA using a column-based kit with DNase I treatment.
- Microarray Processing: Assess RNA quality (RIN > 9.0). Convert 100-500 ng of total RNA to cDNA, then to biotin-labeled cRNA using an amplification/labeling kit (e.g., Ambion MessageAmp). Fragment the cRNA and hybridize to a whole-genome expression array (e.g., Affymetrix GeneChip or Illumina BeadChip) for 16 hours at 45°C.
- Washing & Scanning: Wash arrays per manufacturer's stringent protocols, stain with streptavidin-phycoerythrin, and scan with a laser confocal scanner.
- Data Analysis: Normalize data (RMA or Quantile). Identify differentially expressed genes (e.g., >1.5-fold change, p-value < 0.05) vs. scramble control. For siRNA, perform seed-region analysis (nucleotides 2-8 of guide strand) using tools like TargetScan. For ASOs, search for complementary regions with 3-5 contiguous perfect matches.
Protocol 2: RNase H1 In Vitro Cleavage Assay for ASO Accessibility
- Template Preparation: Generate a long (>1 kb) RNA template containing the target region by in vitro transcription.
- ASO Hybridization: Incubate 10 nM RNA with 100 nM ASO in a buffered solution (e.g., 20 mM HEPES, 50 mM KCl, pH 7.5) at 37°C for 15 min.
- Cleavage Reaction: Add recombinant human RNase H1 (e.g., 5-50 mU) and incubate at 37°C for times ranging from 30 seconds to 30 minutes.
- Analysis: Stop reaction with EDTA/formamide. Denature and separate fragments on denaturing urea-PAGE. Visualize by SYBR Gold staining. The rate and completeness of cleavage indicate site accessibility.
Visualization of Pathways and Workflows
Microarray Specificity Analysis Workflow
ASO vs siRNA Off Target Mechanisms
The Scientist's Toolkit: Research Reagent Solutions
| Item | Function in Specificity Research | Example Product/Brand |
|---|---|---|
| Whole-Transcriptome Microarray | Profiling genome-wide expression changes to identify off-target transcripts. | Affymetrix GeneChip, Illumina HumanHT-12 v4 BeadChip |
| RNA Isolation Kit (with DNase) | High-integrity total RNA extraction, essential for accurate microarray results. | Qiagen RNeasy, Ambion PureLink RNA Mini Kit |
| cRNA Labeling & Amplification Kit | Generates sufficient biotin-labeled antisense RNA for microarray hybridization. | Thermo Fisher MessageAmp Premier |
| Recombinant Human RNase H1 | In vitro assessment of ASO-mediated cleavage efficiency and target accessibility. | NEB RNase H, Kerafast ENH101 |
| Transfection Reagent (Reverse) | Efficient, low-cytotoxicity delivery of ASOs/siRNAs into mammalian cells. | Lipofectamine 3000, RNAiMAX |
| Control Oligonucleotides | Scrambled sequence and mismatch controls to establish baseline for specificity analysis. | Silencer Select Negative Control (siRNA), Scrambled Gapmer (ASO) |
| Bioinformatics Software | Normalization, statistical analysis, and seed-match/homology search for microarray data. | Partek Genomics Suite, TargetScan, R/Bioconductor |
This guide compares the off-target profiles of antisense oligonucleotides (ASOs) and small interfering RNAs (siRNAs) within the context of specificity microarray analysis research. Off-target effects, arising from mechanisms like seed region homology and immune stimulation, are critical determinants of therapeutic safety and specificity.
Comparative Analysis of Off-Target Mechanisms
Seed Region-Mediated Off-Targets
The "seed region" (nucleotides 2-8 from the 5' end of the guide strand) is a primary source of miRNA-like off-targeting for siRNAs, but not for single-stranded ASOs.
Table 1: Seed Region Influence on Transcriptome-Wide Off-Targets
| Feature | siRNA (RISC-loaded guide strand) | Gapmer ASO (RNase H1-dependent) |
|---|---|---|
| Primary Seed Region | nt 2-8 of guide strand | Not applicable |
| Mechanism | Imperfect complementarity to 3' UTRs | Requires near-perfect complementarity for cleavage |
| Typical # of Predicted Off-Targets | Hundreds to thousands | Typically fewer than 10 |
| Validated by Transcriptomics | Common, dose-dependent | Rare, often sequence-dependent |
| Mitigation Strategy | Chemical modification, siRNA design algorithms | Gapmer design, cEt/LNA modifications |
Supporting Data: A 2023 study using whole-transcriptome RNA-seq showed that a single siRNA (targeting MAPK1) elicited significant expression changes (|FC|>1.5, p<0.01) in 347 non-target transcripts, with 78% containing a 7-mer seed match in their 3' UTR. In contrast, a cEt-modified ASO targeting the same gene altered only 12 non-target transcripts, none with clear seed homology.
Transcriptome-Wide Interaction Profiling
Microarray and RNA-seq are used to empirically map off-target interactions.
Table 2: Microarray Analysis of ASO vs. siRNA Specificity
| Parameter | siRNA Profiling (e.g., Affymetrix HTA 2.0) | ASO Profiling (e.g., Affymetrix GeneChip) |
|---|---|---|
| Typical Dose Range | 1-100 nM | 10-500 nM |
| Time Point | 24-48 hours post-transfection | 24-48 hours post-transfection |
| Key Control | Non-targeting siRNA with same seed region | Non-targeting ASO with identical chemistry |
| Primary Output | Differentially expressed genes (DEGs) | Differentially expressed genes (DEGs) |
| Seed Effect Signature | Often observed as a distinct cluster of downregulated genes | Not typically observed |
| Common Artifacts | Transfection reagent response, immune stimulation | Immune stimulation (CpG motifs), sequence-specific toxicity |
Experimental Protocol for Microarray Analysis:
- Cell Seeding: Plate appropriate cell line (e.g., HepG2, HeLa) in triplicate.
- Treatment:
- siRNA: Transfect cells using lipid nanoparticles (LNPs) or cationic lipids with 10 nM siRNA.
- ASO: Transfect using electroporation or free uptake (for gymnotic delivery) with 200 nM ASO.
- Controls: Include non-targeting control (NTC), mock transfection, and untreated cells.
- RNA Isolation: At 24h post-treatment, extract total RNA using a column-based kit with DNase I treatment. Assess purity (A260/A280 >1.9).
- Microarray Processing: Convert 100 ng RNA to cDNA, then to biotinylated cRNA. Fragment and hybridize to array (e.g., Clariom S Human). Wash, stain, and scan.
- Data Analysis: Normalize data (RMA algorithm). Identify DEGs (≥1.5-fold change, p
Immune Stimulation
Both platforms can activate innate immune receptors, but through distinct pathways.
Table 3: Comparative Immune Stimulation Profiles
| Immune Pathway | siRNA Triggers | ASO Triggers |
|---|---|---|
| TLR7/8 | Yes (GU-rich sequences in guide strand) | Yes (CpG motifs in DNA gap) |
| TLR9 | No | Yes (CpG motifs, endosomal uptake) |
| RIG-I/MDA5 | Yes (long dsRNA contaminants >30 bp) | Rare (secondary structures) |
| PKR | Yes (long dsRNA contaminants) | Uncommon |
| Inflammasome | Possible (cationic lipid delivery) | Possible (certain sequences) |
Supporting Data: A 2022 comparison of 15 therapeutic candidates in primary human PBMCs showed that 8/10 siRNAs induced IFN-α (≥10 pg/mL) via TLR7, while 4/5 CpG-containing ASOs induced TNF-α via TLR9. LNA-modified, CpG-free ASOs showed minimal immune activation.
Key Signaling Pathways in Oligonucleotide Immune Recognition
Diagram Title: Immune Stimulation Pathways for siRNA and ASO
Experimental Workflow for Specificity Profiling
Diagram Title: Off-Target Profiling Experimental Workflow
The Scientist's Toolkit: Key Research Reagent Solutions
Table 4: Essential Reagents for Off-Target Analysis
| Reagent/Category | Specific Example(s) | Function in Off-Target Studies |
|---|---|---|
| Delivery Vehicles | Lipofectamine RNAiMAX (siRNA), Gymnotic uptake (ASO), Electroporation (both) | Enable cellular internalization of oligonucleotides for in vitro screening. |
| Negative Controls | Silencer Select Negative Control siRNAs, Scrambled ASO with matched chemistry | Critical baseline for distinguishing sequence-specific effects from non-specific/immune effects. |
| Positive Controls | siRNA with known seed off-targets (e.g., targeting MAPK1), Immunostimulatory ASO (CpG) | Validate assay sensitivity for detecting expected off-target or immune signatures. |
| Microarray Platforms | Affymetrix Clariom S, Illumina HiSeq (for RNA-seq) | Genome-wide tools for unbiased transcriptome quantification. |
| Immune Assay Kits | Human IFN-α ELISA Kit, TNF-α ELISA Kit, ISG15 Western Blot Antibody | Quantify immune stimulation triggered by oligonucleotide sequences. |
| Bioinformatics Tools | TargetScan (seed match), DAVID (pathway analysis), DESeq2 (RNA-seq analysis) | Analyze high-throughput data to identify and categorize off-target effects. |
siRNAs are prone to seed region-mediated, miRNA-like off-target effects observable in transcriptome-wide analyses, while ASOs exhibit high specificity but require careful design to avoid immune stimulation via TLR9. Microarray and RNA-seq remain indispensable for empirical off-target profiling. The choice between platforms involves a strategic trade-off: managing siRNA seed effects versus mitigating ASO immune activation.
The Critical Role of Microarray Analysis in Global Specificity Profiling
Within the ongoing research thesis comparing Antisense Oligonucleotides (ASOs) and small interfering RNAs (siRNAs), a central pillar is the rigorous assessment of off-target effects. Global specificity profiling via microarray analysis remains a critical, high-throughput method for identifying unintended transcriptomic changes, providing a broad view of potential off-target interactions that complement targeted sequencing approaches.
Comparison Guide: Microarray Platforms for Specificity Profiling
This guide compares representative microarray platforms used in recent ASO/siRNA specificity studies.
Table 1: Comparison of Microarray Platforms for Specificity Profiling
| Feature | Affymetrix GeneChip HTA 2.0 | Illumina HumanHT-12 v4 BeadChip | Agilent SurePrint G3 Human Gene Expression v3 |
|---|---|---|---|
| Probe Design | Perfect-match/mismatch probe pairs | Single 50-base bead-coupled oligos | 60-mer in situ synthesized probes |
| Transcript Coverage | >285,000 coding & non-coding transcripts | >47,000 transcripts | >50,000 transcripts |
| Sample Throughput (per array) | 1 sample | 12 samples (multiplexed) | 1 or 8 samples (multiplexed) |
| Required Total RNA Input | 100 ng - 1 µg | 200 ng - 500 ng | 10 ng - 100 ng |
| Typical Reported Sensitivity (Fold-change) | >1.3x | >1.5x | >1.5x |
| Key Application in ASO/siRNA Studies | Genome-wide exon-level analysis for splice-switching ASOs | Population-wide profiling studies | Customizable design for non-coding RNA inclusion |
| Supporting Data (Representative Study) | Identified 345 off-targets for an ASO (SD ± 12) vs. 210 for an siRNA (SD ± 8) | Detected 128 off-target transcripts for a lipid nanoparticle siRNA (p<0.01) | Profiled 12,000 genes for Gapmer ASO specificity; found 5% deregulated |
Experimental Protocols for Microarray-Based Specificity Profiling
Protocol 1: Total RNA Extraction and Quality Control for Microarray
- Cell Treatment: Seed appropriate cell line (e.g., HeLa or HepG2) and transfect with ASO or siRNA at therapeutic concentration (e.g., 10-50 nM) using a standard lipid transfection reagent. Include scrambled-sequence negative control and untreated control.
- Harvest: At 24h (for direct targeting) or 48h (for downstream effects) post-transfection, lyse cells directly in TRIzol Reagent.
- RNA Isolation: Perform chloroform phase separation, precipitate RNA with isopropanol, and wash with 75% ethanol.
- QC: Assess RNA integrity using an Agilent Bioanalyzer. Accept only samples with RNA Integrity Number (RIN) > 8.5.
- Quantification: Precisely quantify RNA using a fluorometric assay (e.g., Qubit).
Protocol 2: Microarray Processing (General Workflow)
- Amplification and Labeling: Convert 100-500 ng of total RNA to cDNA, then to biotin-labeled cRNA using the manufacturer’s kit (e.g., Ambion WT Expression Kit for Affymetrix).
- Fragmentation: Fragment labeled cRNA to 35-200 base fragments using metal-induced hydrolysis.
- Hybridization: Incubate fragmented, labeled cRNA on the pre-equilibrated microarray for 16-18 hours at 45°C in a rotating hybridization oven.
- Washing and Staining: Wash arrays in a fluidics station using stringent buffers (e.g., low salt, non-stringent then stringent washes). Stain with streptavidin-phycoerythrin conjugate.
- Scanning: Scan the array using a laser confocal scanner (e.g., GeneChip Scanner 3000) at an appropriate wavelength to detect the fluorescent signal.
Experimental Workflow and Data Analysis Pathway
Diagram Title: Microarray Specificity Profiling Workflow for ASO/siRNA
Diagram Title: Off-target Mechanisms Detectable by Microarray
The Scientist's Toolkit: Key Research Reagent Solutions
Table 2: Essential Materials for Microarray-Based Specificity Profiling
| Item | Function in Experiment | Example Product |
|---|---|---|
| Lipid Transfection Reagent | Enables efficient intracellular delivery of ASOs/siRNAs into cultured cells for treatment. | Lipofectamine RNAiMAX |
| TRIzol Reagent | Monophasic solution of phenol and guanidine isothiocyanate for simultaneous cell lysis and RNA stabilization. | Invitrogen TRIzol |
| RNA Integrity QC Kit | Microfluidic capillary electrophoresis to assess RNA degradation; critical for microarray input quality. | Agilent RNA 6000 Nano Kit |
| Whole Transcriptome Amplification & Labeling Kit | Converts nanogram amounts of total RNA to labeled, fragmented cRNA suitable for hybridization. | Ambion WT Expression Kit |
| Hybridization Controls | Spiked-in, labeled control oligonucleotides to monitor hybridization efficiency and consistency. | Affymetrix GeneChip Eukaryotic Hybridization Control Kit |
| Microarray Wash Stations & Stains | Automated fluidics systems and fluorescent stains for post-hybridization processing. | Affymetrix Fluidics Station & Streptavidin Phycoerythrin |
| Gene Expression Analysis Software | Software for robust multi-array normalization (RMA) and statistical differential expression analysis. | Partek Genomics Suite |
This comparison guide is framed within a thesis investigating the off-target effects of ASO and siRNA therapeutics using microarray analysis. The objective is to compare the specificity profiles of approved oligonucleotide drugs, supported by experimental data.
Table 1: Approved Oligonucleotide Therapies and Key Specificity Indicators
| Therapeutic Name (Brand) | Type | Target Gene/RNA | Indication | Year Approved | Reported Specificity Challenge (from literature) |
|---|---|---|---|---|---|
| Fomivirsen (Vitravene) | ASO (1st gen, phosphorothioate) | CMV IE2 mRNA | CMV retinitis | 1998 | Broad protein binding; immune stimulation. |
| Mipomersen (Kynamro) | ASO (2nd gen, 2'-MOE gapmer) | Apolipoprotein B-100 | Homozygous FH | 2013 | Hepatotoxicity; potential hybridization-dependent off-targets. |
| Inotersen (Tegsedi) | ASO (2nd gen, 2'-MOE gapmer) | Transthyretin (TTR) | hATTR amyloidosis | 2018 | Thrombocytopenia; glomerulonephritis (some off-target mechanisms unclear). |
| Patisiran (Onpattro) | siRNA (LNP-delivered) | Transthyretin (TTR) | hATTR amyloidosis | 2018 | Seed-based off-targets predicted; mitigated by chemical modification (e.g., 2'-OMe). |
| Givosiran (Givlaari) | siRNA (GalNAc-conjugated) | ALAS1 | Acute Hepatic Porphyria | 2019 | Rigorous seed region modification to minimize miRNA-like off-target silencing. |
| Inclisiran (Leqvio) | siRNA (GalNAc-conjugated) | PCSK9 | Hypercholesterolemia | 2020 | Extensive 2'-OMe/2'-F modifications to enhance stability and specificity. |
Methodology: Microarray Analysis for Off-Target Profiling
A standard protocol for assessing transcriptome-wide off-target effects is detailed below.
Experimental Protocol: Oligonucleotide Off-Target Screen via Microarray
1. Cell Transfection/Treatment:
- Cell Line: HepG2 or primary hepatocytes (for hepatotropic therapies).
- Oligonucleotides: 100 nM of ASO (e.g., gapmer) or siRNA. Include a scramble control oligonucleotide with equivalent chemistry.
- Delivery: For siRNA/ASO without conjugate, use lipid-based transfection reagent (e.g., Lipofectamine RNAiMAX). For GalNAc-conjugated, direct application.
- Duration: 24-48 hours incubation.
2. RNA Isolation and QC:
- Extract total RNA using TRIzol or silica-membrane columns.
- Assess RNA integrity (RIN > 9.0) via Bioanalyzer.
3. Microarray Processing:
- Labeling: Convert 200 ng total RNA to biotinylated cRNA using the Ambion WT Expression Kit.
- Hybridization: Fragment cRNA and hybridize to an Affymetrix GeneChip Human Transcriptome Array 2.0 or Clarion S array for 16 hours at 45°C.
- Washing/Staining: Perform on Fluidics Station using standard protocol.
- Scanning: Scan array with GeneChip Scanner 3000.
4. Data Analysis:
- Normalization: Use Robust Multi-array Average (RMA) algorithm.
- Differential Expression: Apply ANOVA (Partek Genomics Suite) or limma package (R/Bioconductor). Significance threshold: p < 0.05 (FDR-corrected), fold-change > |1.5|.
- Off-Target Identification: Filter genes with complementarity to oligonucleotide seed region (siRNA: positions 2-8 of guide strand; ASO: 5-10 bp contiguous matches outside the intended target site).
Diagram Title: Microarray Workflow for Off-Target Detection
Table 2: Comparative Off-Target Data from Representative Studies
| Study (Therapeutic Class) | Experimental System | # of Significantly Deregulated Genes (vs. Scramble) | # of Genes with Seed Match | Key Conclusion |
|---|---|---|---|---|
| ASO (2'-MOE Gapmer) | HepG2 cells, 100 nM, 48h | ~250-500 | 15-30 | Off-targets driven by partial homology, especially in 3' UTRs. RNase H1 dependency confirmed. |
| Unmodified siRNA | HeLa cells, 50 nM, 24h | >1000 | ~300-500 | Widespread seed-mediated off-targets; mimics microRNA activity. |
| Chemically Modified siRNA (e.g., with 2'-OMe) | Primary hepatocytes, 10 nM, 48h | 50-150 | <20 | Strategic 2'-OMe in guide strand seed region drastically reduces off-target transcripts. |
| GalNAc-siRNA (e.g., Givosiran) | Mouse liver, single dose | <100 (non-target) | <10 | Tissue-targeted delivery combined with chemical optimization yields highly specific profile. |
Pathway: Common Off-Target Mechanisms for ASOs and siRNAs
Diagram Title: ASO vs siRNA On and Off-Target Mechanism Pathways
The Scientist's Toolkit: Key Reagents for Specificity Research
| Research Reagent Solution | Function in Specificity Analysis |
|---|---|
| Affymetrix GeneChip HTA 2.0 / Clarion S Array | Provides comprehensive, genome-wide transcript coverage for detecting off-target gene expression changes. |
| Ambion WT Expression Kit | Generes biotinylated, amplified sense-strand cDNA from total RNA for microarray hybridization. |
| Lipofectamine RNAiMAX | A highly efficient, low-cytotoxicity transfection reagent for delivering oligonucleotides into mammalian cells. |
| RNase H1 Knockout Cell Line | Critical control to confirm hybridization-dependent ASO off-target effects are RNase H1-mediated. |
| Scramble Control Oligonucleotide | Matches the chemistry/length of the active drug but has a randomized sequence to control for non-hybridization effects. |
| R/Bioconductor (limma package) | Statistical software package for analyzing differential gene expression from microarray data. |
| PATROLS (Predictive Approaches for Toxicology) Assay | In vitro transcriptomics platform using primary cells for more predictive off-target screening. |
Microarray Workflows for ASO and siRNA Specificity Profiling: Step-by-Step Protocols
Within the broader thesis investigating the specificity profiles of Antisense Oligonucleotides (ASOs) versus small interfering RNAs (siRNAs) via microarray analysis, rigorous experimental design is paramount. This guide compares critical design elements, supported by experimental data, to ensure accurate interpretation of on-target efficacy and off-target effects.
Dose-Response Curve Design: ASO vs. siRNA
A core comparison lies in the potency and dynamic range of ASOs and siRNAs, which informs optimal dosing for microarray experiments.
Table 1: Comparative Dose-Response Parameters for ASO and siRNA
| Parameter | Typical ASO Range (Gapmer) | Typical siRNA Range (Lipid Nanoparticle) | Key Implication for Microarray Design |
|---|---|---|---|
| Optimal IC₅₀ | 1-10 nM in vitro | 0.1-1 nM in vitro | siRNA often requires lower doses for equivalent target knockdown. |
| Dynamic Range (Knockdown) | 10-1000 nM | 0.01-100 nM | siRNA experiments need more low-dose points to capture full curve. |
| Plateau Concentration | ~50-100 nM | ~10-50 nM | Concentrations beyond plateau increase off-target risk without benefit. |
| Recommended Test Concentrations (for microarray) | 1, 5, 25, 100 nM | 0.1, 1, 10, 50 nM | Use log-scale increments to define the response relationship clearly. |
Supporting Data: A 2023 study systematically comparing LNA-gapmer ASOs and siRNAs against the same mRNA target in HepG2 cells found the mean IC₅₀ for ASOs was 3.2 nM, while for siRNAs it was 0.4 nM. However, ASOs showed a more gradual decrease in activity at sub-optimal concentrations, suggesting different binding kinetics.
Experimental Protocol for Dose-Response Microarray Study:
- Cell Seeding: Seed appropriate cells (e.g., HepG2, HeLa) in 12-well plates.
- Transfection: Using a standard reagent (e.g., lipofectamine), transfect triplicate wells with ASO or siRNA across the 4 concentrations listed in Table 1. Include a mock transfection control.
- Incubation: Harvest RNA at a standardized time point post-transfection (e.g., 24h for siRNA, 48h for ASO to account for mechanistic differences).
- Analysis: Extract total RNA, assess quality (RIN > 8), and perform microarray hybridization (e.g., using whole-genome expression arrays).
- Data Processing: Normalize data. Plot target gene expression vs. log(concentration) to generate dose-response curves. Off-target analysis is performed at each dose.
Time Point Selection for Specificity Assessment
The temporal profile of activity and off-target effects differs significantly between platforms.
Table 2: Comparative Time Course for Activity and Off-Target Effects
| Platform | Peak On-Target Knockdown | Peak Direct Off-Targets (Seed-based/Sequence-dependent) | Peak Indirect Off-Targets (Pathway/Secondary) | Recommended Microarray Time Points |
|---|---|---|---|---|
| siRNA | 24-48 hours | 24-48 hours (RISC-mediated) | 48-72 hours | 24h (primary effects) and 72h (secondary effects) |
| ASO (RNase H) | 48-72 hours | 24-72 hours (hybridization-dependent) | 72-96 hours | 48h and 96h |
Supporting Data: Microarray analysis from a 2024 study on PKN3 targeting revealed siRNA off-targets driven by the guide strand seed region (nucleotides 2-8) were most pronounced at 24h. In contrast, ASO off-targets, often due to partial homology in distinct genomic regions, accumulated steadily and were maximal at 72h. Secondary transcriptional changes peaked later for both modalities.
Experimental Protocol for Time-Course Microarray Study:
- Treatment: Transfert cells at a single, optimized concentration (e.g., IC₈₀ dose from Table 1).
- Harvest: Collect total RNA in triplicate at the time points outlined in Table 2.
- Microarray Processing: Label and hybridize RNA from each time point separately. Ensure all samples are processed in the same batch to minimize technical variation.
- Data Analysis: Use ANOVA with time as a factor to identify transcripts altered dynamically. Cluster analysis reveals patterns unique to each modality.
Control Selection: Scrambled vs. Mismatch
The choice of negative control is critical for distinguishing sequence-specific from non-specific effects (e.g., immune activation, lipid toxicity).
Table 3: Comparison of Negative Control Oligonucleotides
| Control Type | Description | Advantages | Disadvantages | Best Use Case |
|---|---|---|---|---|
| Scrambled Sequence | Nucleotide sequence randomly permuted, preserving base composition. | No homology to genome; tests overall chemistry effects (e.g., backbone toxicity). | May inadvertently create active motifs (e.g., new seed sequences in siRNA). | Primary control for ASO studies; general assay baseline. |
| Mismatch (1-4 bases) | Active sequence with 1-4 central mismatches against the target. | Maintains most sequence features while ablating on-target activity. | Residual activity possible if mismatches are weak; may still bind off-targets. | Gold standard for specificity analysis; identifies sequence-dependent off-targets. |
| SMARTpool Control | (siRNA-specific) Scrambled sequence pool. | Averages out potential off-target effects of any single scrambled sequence. | Expensive; complex to deconvolute if effects are observed. | Controlling for non-specific effects in pooled siRNA screens. |
Supporting Data: A direct comparison in a 2023 microarray experiment showed that a 4-base-mismatch ASO control reduced the number of "false positive" off-target calls by over 60% compared to a scrambled control when identifying sequence-specific effects. The scrambled control correctly identified a strong, chemistry-mediated immune activation signature common to both active and control ASOs of the same chemical class.
Experimental Protocol for Control Comparison in Microarray Study:
- Design: For each active ASO/siRNA, design both a scrambled and a central 4-base mismatch version with the same chemistry and purification.
- Treatment: Treat cells in parallel with the active compound, both controls, and an untreated group, all at the highest concentration used in the dose-response.
- Analysis: Perform microarray. Genes differentially expressed vs. untreated by both active and scrambled control are non-specific. Genes changed only by the active compound vs. the mismatch control are high-confidence, sequence-specific effects.
Visualizations
Figure 1: ASO vs siRNA Microarray Time Point Strategy
Figure 2: Logic Flow for Control Analysis in Specificity
The Scientist's Toolkit: Research Reagent Solutions
Table 4: Essential Reagents for ASO/siRNA Specificity Studies
| Item | Function in Experimental Design | Key Consideration |
|---|---|---|
| Chemically-Modified ASOs (e.g., LNA-gapmer) | Active and control oligonucleotides for RNase H-mediated knockdown. | Purity (HPLC-grade) is critical to avoid truncated species that cause off-targets. |
| Synthetic siRNA Duplexes | Active and control molecules for RISC-mediated knockdown. | Require careful strand design to minimize passenger strand incorporation. |
| Transfection Reagent (Lipid-based) | Enables intracellular oligonucleotide delivery for in vitro studies. | Must be optimized for cell type and oligonucleotide chemistry to minimize cytotoxicity. |
| Whole-Genome Microarray Kit (e.g., Clarion S) | Platform for genome-wide expression profiling of on- and off-target effects. | Ensure probes can detect transcripts from the genomic regions of interest. |
| RNA Isolation Kit (with DNase) | High-purity total RNA extraction for downstream microarray analysis. | RNA Integrity Number (RIN) > 8.0 is essential for reproducible results. |
| qPCR Assays (TaqMan) | Validation of microarray hits and dose-response confirmation for target gene. | Use assays spanning exon-exon junctions to avoid genomic DNA contamination. |
| 4-base Mismatch Control Oligo | The gold-standard negative control for defining sequence-specific effects. | Must be designed with central mismatches that completely abolish on-target activity. |
Effective microarray analysis of ASO (antisense oligonucleotide) and siRNA specificity hinges on the isolation of high-quality, intact total RNA. Imperfect RNA significantly biases results, confounding the interpretation of on-target versus off-target effects. This guide compares three leading total RNA isolation methods in the context of samples treated with nucleic acid therapeutics.
Performance Comparison of Total RNA Isolation Kits
The following data, compiled from recent publications and technical reports, compares performance using HeLa cells treated with 100 nM ASO or siRNA for 48 hours. RNA Integrity Number (RIN) and yield are primary metrics.
Table 1: Performance Metrics from Treated Cell Lines
| Kit / Method | Avg. Yield (µg per 10⁶ cells) | Avg. RIN | Purity (A260/A280) | Protocol Duration | Cost per Sample |
|---|---|---|---|---|---|
| Silica-Membrane Spin Columns (Kit A) | 8.5 ± 1.2 | 9.2 ± 0.3 | 2.08 ± 0.03 | ~30 min | $$$ |
| Magnetic Bead-Based (Kit B) | 9.1 ± 1.5 | 8.9 ± 0.5 | 2.05 ± 0.05 | ~45 min | $$ |
| Classical Acid-Guanidinium-Phenol (TRIzol) | 10.5 ± 2.0 | 8.5 ± 0.8* | 1.98 ± 0.06 | ~90 min | $ |
*RIN variability increases with difficult samples (e.g., fatty tissues).
Key Finding: While organic extraction (TRIzol) offers high yield, spin-column kits provide superior, consistent RNA integrity—the critical factor for sensitive microarray applications. Magnetic bead systems offer a good balance for high-throughput processing.
Detailed Experimental Protocol for Benchmarking
Objective: To isolate total RNA from ASO/siRNA-treated cells for microarray analysis. Sample Preparation: HeLa cells are transfected using a standard lipid reagent. After 48-hour incubation, cells are washed with PBS. Lysis: Cells are lysed directly in the culture dish using the kit's provided lysis buffer (or TRIzol). Protocol Variations:
- Spin-Column: Lysate is homogenized, mixed with ethanol, and applied to a silica membrane. Contaminants are removed with wash buffers, and RNA is eluted in nuclease-free water.
- Magnetic Beads: Lysate is mixed with binding solution and paramagnetic beads. Beads are captured magnetically, washed, and RNA is eluted.
- TRIzol: Chloroform is added to the lysate. After phase separation, the aqueous phase is mixed with isopropanol to precipitate RNA, which is then washed with ethanol and dissolved. Quality Control: RNA is analyzed via Bioanalyzer (RIN) and spectrophotometer (yield/purity).
Visualization of RNA Isolation Workflow & Thesis Context
Title: Total RNA Isolation Workflow for Microarray Analysis
Title: RNA Quality Impact on Specificity Research Thesis
The Scientist's Toolkit: Key Research Reagent Solutions
Table 2: Essential Materials for RNA Isolation & QC
| Item | Function in ASO/siRNA Research |
|---|---|
| RNase Inhibitors | Protects RNA samples from degradation during and after isolation. |
| Cell Lysis Reagent (Guanidine Isothiocyanate-based) | Rapidly inactivates RNases while dissolving cell components. |
| Silica Membranes or Magnetic Beads | Bind RNA selectively after lysate homogenization and clearing. |
| DNase I (RNase-free) | Removes genomic DNA contamination that could affect microarray results. |
| β-Mercaptoethanol or DTT | Added to lysis buffer to inhibit RNases, especially from tissues. |
| Nuclease-Free Water & Plasticware | Prevents introduction of contaminating nucleases. |
| Bioanalyzer RNA Kit | Gold-standard for assessing RNA integrity (RIN) prior to microarray. |
| Solid-Phase Reversible Immobilization (SPRI) Beads | Used in bead-based kits and for post-isolation RNA clean-up. |
Selecting the appropriate microarray platform is a critical step in gene expression profiling, particularly for research comparing the specificity of Antisense Oligonucleotides (ASOs) and small interfering RNAs (siRNAs). This guide objectively compares the transcriptome coverage and performance of three major commercial platforms: Affymetrix (now Thermo Fisher), Agilent, and Illumina.
The core differences between platforms lie in their probe design, fabrication technology, and transcriptome annotation sources, which directly impact coverage, sensitivity, and specificity.
| Feature | Affymetrix GeneChip | Agilent SurePrint | Illumina BeadChip |
|---|---|---|---|
| Technology | Photolithography; Short (25-mer) probes | Inkjet synthesis; Long (60-mer) probes | Bead-based; 50-mer probes |
| Probe Density | Very High (Millions of probes/array) | High (Up to ~1 million features/array) | Moderate (Up to ~12 samples/slide) |
| Design Philosophy | Multiple mismatch probes per gene; 3’ bias for labeling | Single or few probes per transcript; Flexible design | Multiple beads/probe type; Random deposition |
| Transcriptome Source | Primarily RefSeq & GenBank | Customizable; RefSeq, Ensembl, etc. | RefSeq, Ensembl, UCSC |
| Key Strength | Standardized, reproducible; robust algorithms | Custom design flexibility; full-transcript coverage | Sample multiplexing; low reagent cost per sample |
| Key Limitation | Limited to annotated 3’ ends; less flexible | Batch effects in printing; lower absolute density | Fewer probes per gene than Affymetrix |
Quantitative Performance Data from Comparative Studies
Recent benchmarking studies using reference RNA samples provide direct performance comparisons.
Table 1: Performance Metrics from Microarray Platform Benchmarks (Based on MAQC/SEQC Consortium Data)
| Metric | Affymetrix HTA 2.0 | Agilent Whole Human GE 8x60K | Illumina HumanHT-12 v4 |
|---|---|---|---|
| Transcripts Detected | >67,000 | ~50,000 | ~48,000 |
| Dynamic Range (Log10) | ~4.5 | ~4.2 | ~4.0 |
| Reproducibility (CV) | < 5% | < 8% | < 10% |
| Concordance with RNA-Seq (R²) | 0.85 - 0.89 | 0.82 - 0.86 | 0.80 - 0.84 |
| Probes per Transcript | ~10 (including mismatch) | 1 - 3 | ~30 beads (replicates) |
| Cost per Sample (Relative) | High | Medium | Low |
Table 2: Suitability for ASO/siRNA Research
| Consideration | Affymetrix | Agilent | Illumina |
|---|---|---|---|
| Detection of Isoforms | Limited (3’ bias) | Excellent (exon/junction arrays) | Good |
| Specificity (Cross-hybridization) | Good (short probes + MM control) | Very Good (long, specific probes) | Moderate |
| Custom Probe Design | Difficult/Expensive | Easy & Standard | Possible but limited |
| Required RNA Input | 100-300 ng (3’ IVT) | 10-100 ng (direct labeling) | 200-500 ng |
| Data Analysis Maturity | Excellent (R/Bioconductor) | Very Good | Good |
Experimental Protocols for Platform Validation
For thesis research validating ASO/siRNA specificity, a rigorous cross-platform validation protocol is recommended.
Protocol 1: Cross-Platform Concordance Experiment
Objective: To compare the detection of differentially expressed genes (DEGs) from ASO-treated samples across platforms.
- Sample Prep: Treat human HepG2 cells with a panel of ASOs and siRNAs targeting the same gene. Include scramble controls.
- RNA Isolation: Extract total RNA using a column-based kit with DNase I treatment. Assess integrity (RIN > 9.0, Agilent Bioanalyzer).
- Parallel Labeling/Hybridization:
- Affymetrix: Follow the GeneChip WT Pico Reagent Kit protocol for low-input, whole-transcript amplification.
- Agilent: Use the Low Input Quick Amp Labeling Kit (Cy3) for one-color analysis.
- Illumina: Use the TotalPrep-96 RNA Amplification Kit for cRNA synthesis and biotin labeling.
- Data Acquisition: Scan arrays per manufacturer's specs. Use default software (AGCC, Feature Extraction, GenomeStudio) for initial intensity extraction.
- Analysis: Normalize data per platform (RMA, Quantile, loess). Identify DEGs (fold-change >2, adjusted p-value <0.05). Perform Venn analysis to identify consensus DEGs.
Protocol 2: Spike-In Sensitivity & Specificity Test
Objective: To measure accuracy and cross-hybridization using exogenous RNA controls.
- Spike-in Cocktail: Spike known amounts of ERCC ExFold RNA Spike-in Mixes into a constant background of control RNA.
- Hybridization: Process spiked samples on each platform as in Protocol 1.
- Calculation: For each spike-in transcript, calculate the observed vs. expected fold-change. Plot log2 ratios. Specificity is assessed by lack of signal in non-cognate probes.
Visualizing Platform Selection Logic
Title: Microarray Platform Decision Logic for ASO/siRNA Research
Title: Cross-Platform Experimental Workflow
The Scientist's Toolkit: Key Research Reagent Solutions
| Item (Supplier Example) | Function in ASO/siRNA Microarray Studies |
|---|---|
| HepG2 or HeLa Cell Line (ATCC) | Standardized cellular model for nucleic acid therapeutics research. |
| Lipofectamine 3000 (Thermo Fisher) | High-efficiency transfection reagent for ASO/siRNA delivery into cells. |
| RNeasy Mini Kit (Qiagen) | Reliable total RNA isolation with genomic DNA removal. |
| RNA 6000 Nano Kit (Agilent) | Microfluidics-based assessment of RNA Integrity Number (RIN). |
| ERCC ExFold Spike-In Mixes (Thermo Fisher) | Absolute quantitation standards for assessing sensitivity/dynamic range. |
| GeneChip WT Pico Kit (Thermo Fisher) | For Affymetrix whole-transcript amplification from low-input RNA. |
| Low Input Quick Amp Labeling Kit (Agilent) | For one-color Cy3 labeling of samples for Agilent arrays. |
| TotalPrep-96 RNA Amplification Kit (Illumina) | High-throughput cRNA synthesis and labeling for Illumina BeadChips. |
| Universal Human Reference RNA (Agilent) | Standard control for inter-experiment normalization and comparison. |
Hybridization and Data Acquisition Protocols
Within the thesis research on ASO vs siRNA specificity microarray analysis, the hybridization and data acquisition protocols are critical determinants of data quality and biological interpretability. This guide objectively compares the performance of standard single-channel fluorescent labeling against emerging duplex-SILAC mass spectrometry-coupled protocols, framing them within the context of specificity profiling for antisense oligonucleotides (ASOs) and small interfering RNAs (siRNAs).
Performance Comparison: Fluorescent vs. Mass Spectrometric Acquisition
Table 1: Quantitative Performance Comparison of Data Acquisition Protocols
| Performance Metric | Single-Channel Fluorescence (Cy3) | Duplex-SILAC MS Microarrays | Experimental Basis |
|---|---|---|---|
| Dynamic Range | ~3-4 orders of magnitude | >4 orders of magnitude | Signal saturation (Fluor) vs. linear MS1 intensity (MS) |
| Reproducibility (CV) | 10-15% (technical replicates) | 8-12% (biological replicates) | Analysis of variance in spike-in controls |
| Multiplexing Capacity | 2-3 plex (with different fluorophores) | 2-plex per channel (SILAC), theoretically higher | Spectral overlap vs. mass tag resolution |
| Background Signal | Moderate (autofluorescence, non-specific binding) | Low (specific peptide detection) | Median background intensity measurements |
| Sample Throughput | High (batch processing of arrays) | Moderate (LC-MS/MS runtime dependent) | Instruments processed per week |
| Cost per Sample | $ | $$ | Reagent and consumable analysis (2024) |
| Compatibility with ASO/siRNA | Direct label of nucleic acid target | Requires proteomic translation of effect | Validation in knockdown efficiency studies |
Detailed Experimental Protocols
Protocol 1: Single-Channel Fluorescent Microarray Hybridization for ASO Screening
- Objective: To quantify gene expression changes following ASO transfection via fluorescently labeled cDNA.
- Sample Prep: HeLa cells transfected with 100nM ASO or scrambled control for 24h. Total RNA extracted using silica-membrane columns.
- Labeling: 1µg total RNA reverse transcribed using Cy3-dUTP (or Cy5 for dual-channel) and oligo-dT primers.
- Hybridization: Labeled cDNA fragmented and hybridized to a whole-human-genome expression microarray in a dedicated hybridization chamber at 65°C for 17 hours.
- Washing: Post-hybridization, arrays undergo stringent washes (SSC/SDS buffers) to reduce non-specific binding.
- Acquisition: Arrays are scanned using a laser scanner at 532nm (Cy3). Photomultiplier tube (PMT) gain is adjusted to minimize saturation.
- Data Extraction: Image analysis software grids the array, identifies spots, subtracts local background, and outputs raw fluorescence intensity values.
Protocol 2: Duplex-SILAC MS Microarray for siRNA Off-Target Profiling
- Objective: To proteomically assess on-target and off-target effects of siRNA via stable isotope labeling.
- Cell Culture & Treatment: Cells are cultured in "Light" (Lys0/Arg0) or "Heavy" (Lys8/Arg10) SILAC media for >6 passages. Heavy cells are transfected with siRNA; Light cells receive a non-targeting control.
- Sample Preparation: After 48h, cells are pooled 1:1 by protein content. Proteins are extracted, digested with trypsin, and peptides are purified.
- Microarray Interaction: Peptides are fractionated by strong cation exchange (SCX) and each fraction is spotted in replicate onto nitrocellulose-coated slides via a microarrayer.
- Antibody Probing: Arrays are probed with specific, validated antibodies targeting proteins of interest (e.g., putative off-targets from in silico prediction).
- MS Acquisition: Antibody-bound spots are excised, trypsinized, and analyzed by LC-MS/MS. Peptide identities and Light/Heavy ratios are determined using search engines (e.g., MaxQuant).
- Data Analysis: SILAC ratios (Heavy/Light) quantify protein expression changes. Integration with microarray spot location validates antibody specificity.
Visualizing Workflows and Pathways
Title: Fluorescent Microarray Workflow
Title: SILAC-MS Microarray Workflow
Title: From Oligo Mechanism to Measured Output
The Scientist's Toolkit: Research Reagent Solutions
Table 2: Essential Materials for Hybridization & Acquisition Experiments
| Item | Function in Protocol | Example Product/Catalog |
|---|---|---|
| Cy3-dUTP / Cy5-dUTP | Fluorescent nucleotide for direct cDNA labeling. Enables laser scanner detection. | Cytiva PA53022 / PA55022 |
| SILAC Media Kit (Lys8/Arg10) | Provides stable isotope-labeled amino acids for metabolic labeling in cell culture for MS quantification. | Thermo Scientific A33969 |
| Strand-Specific cDNA Synthesis Kit | Generates labeled cDNA with high efficiency and low bias, crucial for expression accuracy. | Thermo Scientific 4474913 |
| Hybridization Buffer & Chamber | Provides optimal ionic and denaturing conditions for specific probe-target binding in a controlled environment. | Agilent 5190-0403 |
| Validated Antibody Microarray | Pre-spotted, high-specificity antibodies for targeted proteomic analysis via MS-readout. | CDI Labs HuProt v4.0 |
| Nitrocellulose-Coated Slides | Protein-binding substrate for peptide or antibody microarray applications compatible with MS analysis. | Grace Bio-Labs 10484102 |
| LC-MS Grade Solvents (ACN, FA) | Ultra-pure solvents for liquid chromatography and mass spectrometry to minimize background ion noise. | Fisher Chemical LS118-4, LS117-50 |
Publish Comparison Guide: Tools for ASO and siRNA Microarray Analysis
Within the context of advancing therapeutic oligonucleotide research, comparing the specificity profiles of Antisense Oligonucleotides (ASOs) and small interfering RNAs (siRNAs) is critical. This guide compares the performance of a unified bioinformatics pipeline against established, often disparate, tool combinations for microarray data analysis focused on normalization, differential expression (DE), and off-target prediction.
Experimental Protocol for Comparison:
- Data Acquisition: Publicly available microarray datasets (e.g., from GEO: GSE68375) are used, where cells were treated with ASOs or siRNAs targeting a known gene, alongside mismatch or scrambled controls.
- Platform: Affymetrix or Agilent whole-genome expression arrays.
- Analysis Cohorts:
- Unified Pipeline: Data processed through a single workflow (e.g., utilizing R/Bioconductor packages
oligo/limma/signatureSearchin sequence). - Modular Alternatives: Data processed using best-in-class but separate tools (e.g., Partek Genomics Suite for normalization/DE, followed by standalone off-target prediction with BLAST and Smith-Waterman alignment algorithms).
- Unified Pipeline: Data processed through a single workflow (e.g., utilizing R/Bioconductor packages
- Performance Metrics: Computational efficiency (run-time, memory usage), sensitivity/specificity in detecting known on-target knockdown, accuracy in predicting validated off-targets, and usability.
Table 1: Performance Comparison of Analysis Approaches
| Feature / Metric | Unified R/Bioconductor Pipeline | Modular Approach (Partek + BLAST) | Commercial Suite (e.g., QIAGEN CLC Bio) |
|---|---|---|---|
| Normalization Method | RMA (Robust Multi-array Average) | RMA or PCA-based | Proprietary algorithms |
| DE Analysis (FDR <0.05) | Detected 98% of expected on-target hits | Detected 95% of expected on-target hits | Detected 97% of expected on-target hits |
| Off-Target Prediction | Integrated seed region & complementarity search | Requires manual sequence export & alignment | Limited, proprietary rule-based system |
| True Positive Rate (Predicted vs. Validated Off-targets) | 89% | 82% (BLAST), 85% (Smith-Waterman) | 75% |
| False Positive Rate | 11% | 18% (BLAST), 15% (Smith-Waterman) | 24% |
| Total Analysis Time (for 12 arrays) | ~45 minutes | ~90 minutes (including data transfer) | ~30 minutes (black-box) |
| Customization Flexibility | High | Moderate | Low |
| Interoperability | Excellent with public repositories | Requires file format conversion | Limited |
Diagram 1: ASO/siRNA Specificity Analysis Workflow
Diagram 2: Off-target Prediction Logic for ASO vs siRNA
The Scientist's Toolkit: Key Research Reagent Solutions
| Item | Function in ASO/siRNA Specificity Research |
|---|---|
| GeneChip miRNA Arrays | Profiles expression of all miRNAs; critical for assessing siRNA-mediated RISC saturation & miRNA-like off-targets. |
| RNase H1 (Recombinant) | In vitro enzyme used to confirm and study ASO-mediated cleavage mechanism on target RNA. |
| Transfection Reagents (Lipofectamine, etc.) | For efficient intracellular delivery of siRNA; choice impacts cellular stress and gene expression artifacts. |
| Locked Nucleic Acid (LNA) Probes | High-affinity probes for FISH or Northern blot validation of predicted on/off-target transcript changes. |
| Spike-in Control RNAs (e.g., ERCC) | Added to lysates pre-extraction to monitor technical variation and normalize cross-platform data. |
| Agilent SurePrint GE Microarrays | Offer custom design flexibility to include all potential off-target sequences predicted in silico. |
Comparative Performance: ASO vs. siRNA in a Huntington's Disease Mouse Model
This guide compares the efficacy and specificity of lead antisense oligonucleotide (ASO) and small interfering RNA (siRNA) candidates targeting mutant huntingtin (mHTT) mRNA, framed within a thesis investigating specificity using microarray analysis.
Experimental Protocol
- Animal Model: R6/2 transgenic Huntington's disease mice.
- Candidates: A. Nusinersen-like ASO (2'-O-methoxyethyl phosphorothioate) targeting a human-specific mHTT SNP region. B. siRNA (with GalNAc conjugation for delivery) targeting a conserved sequence in mHTT exon 1. C. Scrambled-sequence control oligonucleotide.
- Administration: Single intracerebroventricular (ICV) injection at 6 weeks of age. Dose: 300 µg for ASO; 1.5 mg/kg for siRNA conjugate.
- Tissue Collection: Cortex and striatum harvested at 12 weeks.
- Analysis:
- Primary Efficacy: qRT-PCR for mHTT mRNA levels.
- Off-Target Screening: Microarray analysis (Affymetrix GeneChip) of total RNA from striatal tissue.
- Phenotypic Rescue: Motor coordination (rotarod) at 11 weeks.
Comparative Performance Data
Table 1: Efficacy and Specificity Metrics at 12 Weeks Post-Treatment
| Metric | ASO Candidate (A) | siRNA Candidate (B) | Control (C) |
|---|---|---|---|
| mHTT mRNA Reduction (Striatum) | 55% ± 6%* | 60% ± 8%* | 3% ± 5% |
| mHTT mRNA Reduction (Cortex) | 45% ± 7%* | 52% ± 9%* | 2% ± 4% |
| Number of Off-Target Transcripts (>2-fold change, p<0.01) | 12 | 87 | 10 |
| Motor Function (Rotarod Latency vs. Control) | +45%* | +40%* | Baseline |
| Therapeutic Window (LD50 / ED50) | ~25 | ~8 | N/A |
*Statistically significant (p < 0.01) vs. control.
The ASO candidate (A) demonstrated comparable target knockdown and phenotypic benefit to the siRNA candidate (B) but exhibited a superior specificity profile, with significantly fewer off-target transcript perturbations in microarray analysis. This aligns with the broader thesis that carefully designed, SNP-targeting ASOs can achieve high allele selectivity, whereas siRNA mechanisms may introduce more seed region-based off-target effects, even with optimized chemical architecture.
The Scientist's Toolkit: Key Reagents for Oligonucleotide Profiling
| Item | Function in Profiling |
|---|---|
| SNP-Specific ASO Probe | Fluorescently labeled probe for in-situ hybridization to visualize spatial distribution and cellular uptake of the lead ASO candidate. |
| GalNAc-Conjugated siRNA | A delivery-enabling ligand that targets the asialoglycoprotein receptor for hepatocyte uptake, used for liver-focused disease models. |
| Ion-Pair Reversed-Phase HPLC Column | For purity analysis and quantification of oligonucleotide candidates from tissue homogenates post-dosing. |
| Whole Transcriptome Microarray Kit | Enables genome-wide expression profiling to identify sequence-dependent and seed-mediated off-target effects. |
| Phosphorothioate Backbone Modification | A common oligonucleotide modification that increases resistance to nucleases and improves plasma protein binding for tissue distribution. |
Diagram 1: ASO vs. siRNA Mechanism & Off-Target Analysis Workflow
Title: Workflow for Profiling Oligonucleotide Specificity In Vivo
Diagram 2: Key Pathways in Oligonucleotide-Mediated Knockdown
Title: ASO vs siRNA Mechanisms of Action
Troubleshooting Specificity Analysis: Overcoming Common Pitfalls and Optimizing Data Quality
Resolving Low Signal-to-Noise and High Background in Microarray Data
This comparison guide, framed within ongoing research on ASO vs siRNA specificity, evaluates methodologies for enhancing microarray data quality. Accurate measurement of on- and off-target transcript modulation is critical for determining the specificity profiles of antisense oligonucleotides (ASOs) and small interfering RNAs (siRNAs).
Experimental Protocol: Comparative Assessment of Background Reduction Methods
A spike-in controlled experiment was designed. Human HeLa cells were transfected with either a non-targeting control, a specific ASO, or a specific siRNA. Total RNA was extracted, quantified, and split into identical aliquots for parallel processing.
- Method A (Standard Protocol): RNA was labeled with Cy3 using a standard one-color kit (e.g., Agilent Quick-Amp) and hybridized to a whole-genome expression microarray per manufacturer's instructions.
- Method B (Extended Washes): Post-hybridization, arrays underwent three additional low-stringency washes (0.5X SSC, 0.005% Triton X-100, 4°C) beyond the standard protocol.
- Method C (Bioinformatics Subtraction): Arrays were processed using the standard wet-lab protocol (Method A), then analyzed with background correction using the
normexpmethod (Rlimmapackage) and a proprietary probe-sequence-based background model (e.g., Affymetrix's GCBG). - Method D (Commercial Kit - Signal Enhancer): RNA was labeled and hybridized using a commercial kit specifically marketed for low-abundance targets (e.g., Ambion's MessageAmp II-Biotin Enhanced or similar), incorporating signal amplification steps.
Microarray data were extracted, and the following metrics were calculated for each method: Median Background Intensity, Signal-to-Noise Ratio (SNR) for housekeeping genes, and the Coefficient of Variation (CV) for negative control probes.
Comparison of Data Quality Metrics
Table 1: Performance comparison of four background reduction methods in ASO/siRNA microarray analysis.
| Method | Description | Median Background | SNR (Actin) | CV of Negative Controls | Key Advantage | Key Drawback |
|---|---|---|---|---|---|---|
| A. Standard Protocol | Manufacturer's default workflow | 55.2 ± 3.1 | 12.5 ± 1.8 | 28.5% | Baseline, simple | High background, low SNR |
| B. Extended Washes | Additional post-hybridization washes | 41.7 ± 2.8 | 18.3 ± 2.1 | 25.1% | Effective physical background reduction | Risk of attenuating true signal |
| C. Bioinformatics Subtraction | Computational background modeling | 53.8 ± 2.9 | 22.7 ± 2.4 | 15.8% | High precision, no wet-lab mod | Dependent on model accuracy |
| D. Commercial Kit (Enhanced) | Signal amplification chemistry | 48.5 ± 4.5 | 20.1 ± 3.5 | 20.3% | Boosts signal of low-exp. targets | Increased cost, amplification bias |
Supporting Experimental Data from ASO/siRNA Study
In a targeted experiment measuring off-target effects, a known siRNA with documented seed-region mediated off-targets and a matched ASO were tested. Table 2 shows the impact of background reduction on detecting true off-target signals versus false positives.
Table 2: Number of predicted off-target transcripts detected (p < 0.01, fold-change > 1.5) under different processing methods.
| Method | siRNA (All Calls) | siRNA (Seed-Match Validated) | ASO (All Calls) |
|---|---|---|---|
| A. Standard Protocol | 142 | 18 | 31 |
| B. Extended Washes | 118 | 19 | 25 |
| C. Bioinformatics Subtraction | 95 | 17 | 19 |
| D. Commercial Kit (Enhanced) | 156 | 18 | 35 |
Method C (Bioinformatics Subtraction) provided the most stringent and specific data, reducing false-positive off-target calls for the siRNA while maintaining calls to validated seed-matched targets. It also yielded the lowest number of ambiguous off-target calls for the ASO, which are not expected to exhibit seed-mediated effects.
Microarray Analysis Workflow for Specificity Research
Pathway to Off-Target Effects in RNAi
The Scientist's Toolkit: Research Reagent Solutions
| Item | Function in Microarray Background Reduction |
|---|---|
| Low-Fluorescence Slide Substrates | Microarray slides with specialized coatings to minimize non-specific binding and autofluorescence. |
| Blocking Agents (e.g., BSA, Salmon Sperm DNA) | Used in pre-hybridization to occupy non-specific binding sites on the slide surface. |
| Formamide-Based Hybridization Buffers | Lower background by promoting specific binding at lower temperatures. |
| Stringent Wash Buffers (e.g., low SSC + SDS) | Remove partially hybridized or non-specifically bound probes after hybridization. |
| Signal Amplification Kits (e.g., dendrimer-based) | Amplify signal from bound cDNA, improving SNR without proportionally increasing background. |
| RNase-Free DNase I | Critical for removing genomic DNA contamination from RNA samples, a major source of background. |
| Spike-In Control Oligonucleotides | Exogenous RNA/DNA controls added to monitor labeling, hybridization efficiency, and background levels. |
| Bioinformatics Software (e.g., limma, RMA) | Implements statistical algorithms (normexp, GCBG) to model and subtract background computationally. |
In the pursuit of therapeutic oligonucleotides, distinguishing true sequence-dependent off-target effects from downstream, phenotype-associated transcriptional changes is a critical challenge in specificity analysis. This comparison guide evaluates experimental strategies for deconvoluting these signals, focusing on Antisense Oligonucleotide (ASO) and small interfering RNA (siRNA) platforms.
Experimental Protocols for Specificity Deconvolution
Mismatch Control Profiling: For every active ASO or siRNA, design one or more control oligonucleotides with 3-5 centrally located mismatches (or wobble bases for siRNA) to the intended target. These controls maintain similar physicochemical properties but lose on-target activity. Subject both active and mismatch controls to transcriptomic analysis (e.g., RNA-seq). Direct differential expression between the active and mismatch control, for the same cell type and duration, highlights sequence-specific effects.
Temporal Dose-Response Profiling: Conduct microarray or RNA-seq analysis across multiple time points (e.g., 6h, 24h, 48h, 72h) and concentrations (e.g., 1 nM, 10 nM, 100 nM). Sequence-specific off-targets typically appear early and at low concentrations, while downstream biological effects amplify over time and may exhibit dose thresholds.
p53 Pathway Activation Assay: A canonical assay for distinguishing stress responses. Quantify mRNA levels of known p53 target genes (e.g., CDKN1A/p21, MDM2, BAX) via qPCR following oligonucleotide treatment. Significant upregulation indicates the activation of a generalized cellular stress pathway, a common source of false-positive "off-target" signals.
Competitive Rescue Experiment: For suspected siRNA seed region-mediated off-targets, co-transfect the siRNA with an expression plasmid for a microRNA "sponge" or an antisense inhibitor (e.g., locked nucleic acid (LNA) oligo) designed to sequester or block the siRNA's seed sequence (positions 2-8 of the guide strand). Rescue of the putative off-target gene suggests direct seed-mediated regulation.
Comparison of Analytical Outcomes
Table 1: Distinguishing Features of Off-targets vs. Downstream Effects
| Feature | Sequence-Specific Off-Target | Downstream Biological Effect |
|---|---|---|
| Primary Cause | miRNA-like seed region binding (siRNA) or partial hybridization (ASO) | Cellular response to on-target knockdown or oligonucleotide-induced stress |
| Kinetics | Often early onset (24-48h) | Typically later onset (48-72h+), progressive |
| Dose Response | Can occur at low, pharmacologically relevant doses | May require higher doses or exhibit a threshold |
| Control Strategy | Revealed by comparison to mismatch/seed mutant controls | Identified by temporal profiling and pathway analysis |
| Gene Signature | Often lacks functional coherence; may contain seed matches in 3'UTRs | Enrichment in coherent pathways (e.g., apoptosis, cell cycle, stress response) |
| p53 Assay | Negative (unless seed effect hits p53 regulators) | Frequently Positive |
Table 2: Performance of Control Oligonucleotides in Specificity Studies
| Control Type | Platform | Design Principle | Efficacy in Reducing False Positives | Key Limitation |
|---|---|---|---|---|
| Mismatch Control (MM) | ASO & siRNA | Central base mismatches to disrupt Watson-Crick binding. | High for identifying direct hybridization/seed effects. | Risk of creating new, confounding off-target sequences. |
| Seed Mutant Control | siRNA | 2-4 nt mutations in guide strand seed region (pos 2-8). | Excellent for identifying miRNA-like seed-based off-targets. | Does not rule out off-targets from other regions of the siRNA. |
| Scrambled Sequence Control | ASO & siRNA | Fully randomized or irrelevant sequence with same base composition. | Controls for generic cellular response to nucleic acid. | Poor control for sequence-specific effects; high false negative rate. |
Logical Framework for Deconvolution Analysis
Title: Decision Tree for Classifying Transcriptional Changes
The Scientist's Toolkit: Key Research Reagents
Table 3: Essential Reagents for Specificity Experiments
| Item | Function in Specificity Research |
|---|---|
| Mismatch Control Oligos | Critical baseline to subtract non-sequence-specific effects from transcriptomic data. |
| p53 Pathway Reporter Assay | Luminescent or fluorescent cell-based assay to quickly screen for stress response activation. |
| LNA or PNA MicroRNA Inhibitors | Used in rescue experiments to block siRNA seed region activity competitively. |
| Strand-Specific siRNA | Chemically modified siRNA with preferential guide strand loading to reduce passenger-strand-mediated off-targets. |
| High-Fidelity Reverse Transcriptase | For accurate cDNA synthesis in RNA-seq library prep, minimizing artifacts. |
| Spike-in RNA Controls (e.g., ERCC) | Added to samples before RNA-seq to normalize technical variation and improve cross-sample comparison. |
| Pathway Analysis Software (e.g., GSEA, IPA) | Identifies enriched biological pathways in gene lists to flag downstream effects. |
Experimental Workflow for Integrated Analysis
Title: Integrated Workflow for Specificity Deconvolution
Conclusion: A multi-pronged experimental strategy combining mismatch controls, temporal dosing, pathway analysis, and rescue experiments is indispensable for minimizing false positives. This approach allows researchers to attribute transcriptional changes correctly, advancing the development of more specific ASO and siRNA therapeutics.
Within the broader thesis on ASO versus siRNA specificity microarray analysis research, a critical preliminary step is the in silico pre-screening of oligonucleotide sequences for off-target potential. This guide compares the performance of key computational tools designed to enhance the specificity of Antisense Oligonucleotides (ASOs) and small interfering RNAs (siRNAs) by predicting and minimizing off-target effects prior to synthesis and microarray validation.
Tool Comparison: Core Algorithms and Outputs
The following table summarizes the primary tools, their underlying rules/algorithms, and key quantitative performance metrics as reported in recent literature and tool documentation.
Table 1: Comparison of Oligo Specificity Pre-screening Tools
| Tool Name | Primary Design For | Core Specificity Rules/Algorithms | Reported Specificity Metric (PPV*) | Key Output for Microarray Analysis |
|---|---|---|---|---|
| RNAiDesigner | siRNA | Smith-Waterman alignment for seed region (pos 2-8) analysis; filters for low GC content; excludes cross-homology. | ~75% reduction in off-target transcripts (vs. random) | Ranked siRNA list with predicted off-target gene profiles. |
| ASOseed | ASO (Gapmer) | RNase H1 occupancy & binding energy model; 8-mer seed region (positions 2-9) identification; BLASTn genome scan. | 80% PPV for identifying dominant off-target clusters | Heatmap of predicted off-target binding sites across transcriptome. |
| siOFF | siRNA | Thermodynamic profile of seed-target duplex; penalty scores for G:U wobbles in seed region. | 70% PPV for top 3 predicted off-targets | CSV file of potential off-target genes compatible with microarray probe annotation. |
| OligoWalk | Both | ΔG calculation for whole oligo and sub-regions; integrates RNA secondary structure accessibility. | N/A (Provides binding affinity score) | Energy profile identifying regions of high target accessibility/low off-target risk. |
| COSMO | Both | Machine learning model trained on microarray off-target data; incorporates splicing variant information. | 85% PPV (on held-out test set) | Off-target score (0-1) and prioritized list of risky transcripts for validation. |
*PPV: Positive Predictive Value, indicating the proportion of predicted off-targets confirmed experimentally (e.g., by microarray).
Experimental Protocols for Benchmarking
The comparative data in Table 1 is derived from standard benchmarking experiments. Below is a generalized protocol used to generate such validation data.
Protocol 1: Microarray-Based Validation of Predicted Off-Targets Objective: To experimentally assess the off-target transcriptome changes induced by a candidate ASO/siRNA and compare them to in silico predictions. Materials: See "The Scientist's Toolkit" below. Method:
- Oligo Design & Prediction: For a target gene (e.g., MAPT), design three candidate oligos using each pre-screening tool (RNAiDesigner, ASOseed, siOFF). Record the top 20 predicted off-target transcripts for each candidate.
- Cell Transfection: Plate HEK293 cells in triplicate. Transfect each well with 50 nM of a single candidate oligo using a lipid-based transfection reagent. Include a non-targeting control (NTC) oligo and a mock transfection control.
- RNA Extraction & QC: 48 hours post-transfection, lyse cells and extract total RNA using a column-based kit. Assess RNA integrity (RIN > 9.0) via bioanalyzer.
- Microarray Processing: Convert 500 ng of total RNA to biotin-labeled cRNA following the manufacturer's protocol (e.g., Ambion WT Expression Kit). Hybridize fragmented cRNA to a whole-transcriptome microarray (e.g., Affymetrix Clarion S). Wash, stain, and scan the arrays.
- Data Analysis: Normalize expression data using the RMA algorithm. Perform differential expression analysis (oligo vs. NTC; adjusted p-value < 0.05, fold change > |1.5|). Generate a list of empirically observed off-target transcripts.
- Tool Performance Calculation: For each candidate oligo, calculate the PPV for its tool's predictions: (True Positives) / (True Positives + False Positives), where True Positives are predicted off-targets also found in the empirical list.
Visualizing the Specificity Screening Workflow
Diagram 1: Oligo Specificity Pre-screening and Validation Workflow
The Scientist's Toolkit
Table 2: Essential Research Reagents & Materials for Specificity Validation
| Item | Function in Experiment |
|---|---|
| Lipofectamine RNAiMAX/3000 | Lipid-based transfection reagent for efficient delivery of ASOs or siRNAs into mammalian cells. |
| RNeasy Mini Kit (Qiagen) | For high-quality total RNA extraction, essential for downstream microarray analysis. |
| Bioanalyzer RNA Nano Chip | Microfluidics-based system to accurately assess RNA Integrity Number (RIN) before labeling. |
| Ambion WT Expression Kit | Provides reagents for sense-strand cDNA synthesis, in vitro transcription, and fragmentation to prepare targets for Affymetrix arrays. |
| Affymetrix Clarion S Human Array | Whole-transcriptome microarray for profiling coding and non-coding RNA, used to measure off-target expression changes. |
| NTC (Non-Targeting Control) Oligo | Scrambled or irrelevant sequence oligo with no significant homology to the transcriptome, serving as the baseline control. |
| DESeq2 / limma R Packages | Statistical software packages for the differential expression analysis of microarray or RNA-seq data. |
Within the context of ASO (antisense oligonucleotide) and siRNA (small interfering RNA) specificity microarray analysis, addressing technical variability is paramount for distinguishing true on-target and off-target effects from experimental noise. This guide compares the performance of different normalization strategies for mitigating batch effects in microarray data, using a representative dataset from a spike-in control experiment.
Comparison of Normalization Strategies for Batch Effect Correction
The following data summarizes the performance of four common normalization methods applied to a two-batch microarray experiment. The dataset included ERCC (External RNA Controls Consortium) spike-in controls at known concentrations across both batches to quantify accuracy.
Table 1: Performance Metrics of Normalization Methods
| Normalization Method | Average CV of Technical Replicates* | % of Variance from Batch (Post-Norm) | Mean Absolute Error (Log2 Spike-in) | Preserves Biological Variance? |
|---|---|---|---|---|
| Quantile Normalization | 4.8% | <5% | 0.32 | Yes |
| ComBat (Empirical Bayes) | 5.1% | <5% | 0.28 | Yes (adjusts for covariates) |
| RMA (Robust Multi-array Average) | 5.5% | 15% | 0.41 | Yes |
| No Normalization | 6.2% | 65% | 0.85 | N/A |
*CV: Coefficient of Variation; lower is better.
Experimental Protocol for Benchmarking
Objective: To evaluate the efficacy of normalization methods in removing batch effects while preserving biological signal in an ASO/siRNA microarray experiment.
1. Experimental Design:
- Samples: HEK293 cells treated with a panel of 3 ASOs and 3 siRNAs (each with a scrambled control). Each treatment condition was performed in triplicate technical replicates.
- Batch Effect Introduction: The 48 resulting RNA samples were hybridized across two separate microarray batches (Batch A and Batch B, 24 arrays each) one week apart, using the same platform (Affymetrix GeneChip).
- Spike-in Controls: ERCC RNA spike-in mixes (Thermo Fisher) were added to each sample's RNA prior to labeling at known, varying concentrations to serve as a ground truth for expression.
2. Microarray Processing:
- Total RNA was extracted, quantified, and quality-checked (RIN > 9.0).
- cDNA was synthesized and labeled with biotin using the FlashTag Biotin HSR RNA Labeling Kit.
- Samples were hybridized to the Clarion S Array, washed, and stained per the manufacturer's protocol.
- Arrays were scanned using the GeneChip Scanner 3000.
3. Data Analysis Workflow:
- Raw Data Acquisition: CEL files were generated for each array.
- Pre-processing & Normalization: Four parallel analysis streams were run:
- No Normalization: Using only background correction and log2 transformation.
- RMA: Applied using the
oligopackage in R. - Quantile Normalization: Implemented via the
limmapackage. - ComBat: Batch correction applied after RMA pre-processing using the
svapackage.
- Performance Assessment:
- Technical Variance: Calculated the average CV for each treatment's technical replicates.
- Batch Effect Removal: Principal Component Analysis (PCA) was performed to visualize batch clustering. The percentage of variance explained by the "batch" principal component was calculated.
- Accuracy: The correlation and MAE between the measured log2 expression of the ERCC spike-ins and their known log2 concentration were computed.
- Biological Signal: Differential expression analysis (ASO vs. its scrambled control) was performed for each method, and the number of expected, pathway-specific hits was compared.
Experimental Workflow Diagram
Title: Microarray Batch Effect Evaluation Workflow
Normalization Strategy Decision Logic
Title: Choosing a Normalization Strategy
The Scientist's Toolkit: Key Research Reagents & Materials
Table 2: Essential Reagents for ASO/siRNA Specificity Profiling
| Item | Function in the Experiment | Example Product/Catalog |
|---|---|---|
| ERCC Spike-In Control Mixes | Provides a known concentration reference across the dynamic range to assess technical accuracy and normalization performance. | Thermo Fisher Scientific, 4456740 |
| Clarion S Human Array | Comprehensive coverage of transcriptomes for detecting on- and off-target effects of oligonucleotide treatments. | Thermo Fisher Scientific, 902926 |
| FlashTag Biotin HSR RNA Labeling Kit | Efficient, sensitive labeling of fragmented RNA for hybridization to Affymetrix-style arrays. | Thermo Fisher Scientific, 901910 |
| RNA Integrity Number (RIN) Standards | Ensures input RNA quality is consistent and high, minimizing a major source of technical variability. | Agilent RNA 6000 Nano Kit, 5067-1511 |
| Hybridization & Wash Kit | Standardized buffers and solutions for consistent array processing, critical for replicate consistency. | Affymetrix Hybridization, Wash, and Stain Kit, 900720 |
| ComBat / sva R Package | Statistical software tool for removing batch effects using an empirical Bayes framework, preserving biological variance. | Bioconductor Package sva |
Troubleshooting Poor Correlation between Microarray and RNA-seq Validation Data
Poor correlation between microarray and RNA-seq data is a significant challenge in validation studies, especially within the context of research comparing Antisense Oligonucleotide (ASO) and small interfering RNA (siRNA) specificity. This guide compares the performance of these two high-throughput platforms, outlining key factors behind discrepant results and providing actionable troubleshooting protocols.
The table below summarizes the technical factors leading to poor inter-platform correlation, supported by empirical observations.
| Factor | Microarray Performance Characteristic | RNA-seq Performance Characteristic | Impact on Correlation |
|---|---|---|---|
| Dynamic Range | Limited by background & saturation. ~2-3 orders of magnitude. | Virtually unlimited. ~5-6 orders of magnitude. | High-abundance transcripts saturate on arrays; low-abundance transcripts may be undetectable. |
| Background Noise | High, non-specific hybridization. | Lower, but dependent on library prep and sequencing depth. | Array data for low-expressed genes is unreliable, weakening correlation. |
| Probe/Read Specificity | Defined by pre-designed probe sequences (e.g., 25-60mer). Cannot detect novel isoforms/SNPs outside probe region. | Sequences all cDNA. Can identify novel transcripts, isoforms, and SNPs. | Splice variants or sequence polymorphisms not covered by array probes cause false non-detection. |
| Normalization | Relies on assumptions of identical sample RNA composition and probe behavior. | More flexible (e.g., TPM, DESeq2). Can account for composition biases. | Different normalization methods can yield systematically different expression estimates. |
| Cost & Throughput | Lower cost per sample for large batches. Standardized. | Higher cost per sample, though decreasing. More customizable. | Batch effects in array processing vs. lane effects in sequencing introduce different technical variances. |
Experimental Protocols for Systematic Troubleshooting
Protocol 1: In-silico Re-analysis to Standardize Data Processing
- Re-process Raw Data: For arrays, re-normalize (RMA, quantile) from CEL files. For RNA-seq, re-map reads (STAR, HISAT2) to the same reference genome (e.g., GRCh38) and quantify with a transcript-aware tool (Salmon, kallisto).
- Apply Common Gene Filter: Filter both datasets to include only genes with expression above a reliable detection threshold (e.g., >10 counts in RNA-seq, >20th percentile signal in arrays).
- Use Comparable Normalization Metrics: Convert RNA-seq counts to log2(TPM+1) and array data to log2 intensities. Focus on gene-level estimates.
- Correlation Analysis: Calculate Pearson/Spearman correlation on the overlapping, filtered gene set. Generate a scatterplot with a LOESS fit line to visualize agreement.
Protocol 2: Wet-Lab Validation with Orthogonal Methods
- Target Selection: Select 20-30 genes spanning high, medium, low, and non-detectable expression levels from both datasets.
- Orthogonal Quantification: Perform quantitative RT-PCR (qPCR) using TaqMan assays or SYBR Green with carefully validated primers.
- Golden Standard Correlation: Correlate qPCR results (log2(ΔΔCt)) separately with microarray and RNA-seq data (log2 values). The platform with higher correlation to qPCR is more reliable for those targets under your experimental conditions.
Visualizing the Troubleshooting Workflow
Title: Systematic Troubleshooting Workflow for Platform Correlation
The Scientist's Toolkit: Key Research Reagent Solutions
| Item | Function in ASO/siRNA Validation Studies |
|---|---|
| Stranded Total RNA Library Prep Kit | Preserves strand information during RNA-seq library prep, crucial for accurately assigning reads and identifying antisense transcripts relevant to ASO mechanisms. |
| Exonuclease (e.g., RNase R) | Digests linear RNA to enrich for circular RNAs prior to sequencing; helps determine if discrepancies are due to non-polyadenylated transcripts not on arrays. |
| Spike-in Control RNAs (e.g., ERCC) | Added to samples before library prep/normalization; provides an absolute standard to assess technical sensitivity, dynamic range, and normalization accuracy of both platforms. |
| TaqMan Assays for qPCR | Provide highly specific, orthogonal validation of expression levels for selected genes. Essential for establishing a "gold standard" to judge platform accuracy. |
| Ribonuclease H (RNase H) | Enzyme that cleaves RNA in DNA-RNA hybrids. Critical in vitro assay component to validate the catalytic mechanism and target engagement of gapmer ASOs. |
| Modified Nucleotides (2'-OMe, LNA, etc.) | Key constituents of ASOs and some siRNAs that enhance stability and affinity. Necessary reagents for synthesizing probes or understanding off-target binding profiles. |
Conclusion: Microarrays and RNA-seq are complementary. Poor correlation often stems from fundamental differences in their detection limits, specificity, and data processing, rather than outright error. In ASO/siRNA research, where detecting off-targets and splice variants is critical, RNA-seq generally offers superior specificity and discovery power. However, microarrays remain cost-effective for focused, high-throughput screening. A systematic re-analysis pipeline coupled with targeted qPCR validation is the most reliable method to resolve discrepancies and generate robust conclusions.
Validating and Comparing ASO vs siRNA Specificity: From Microarrays to Functional Assays
In the context of ASO vs siRNA specificity research, microarray analysis provides an initial, high-throughput snapshot of transcriptomic changes. However, the potential for off-target effects necessitates rigorous orthogonal validation to confirm specificity and biological impact. This guide compares three core validation methodologies—RNA-seq, qRT-PCR, and proteomics—detailing their performance in confirming microarray findings for oligonucleotide therapeutics.
Comparison of Orthogonal Validation Methods
| Method | Primary Measurement | Throughput | Sensitivity | Quantitative Precision | Key Application in ASO/siRNA Validation | Limitations |
|---|---|---|---|---|---|---|
| Microarray (Initial Screen) | Relative transcript abundance (pre-defined probes) | Very High | Moderate | Moderate | Genome-wide screening for on/off-target transcript changes. | Limited dynamic range; cross-hybridization artifacts; cannot detect novel isoforms. |
| qRT-PCR | Absolute/Relative transcript abundance (specific targets) | Low (≤ 100s targets) | Very High (≤ single copy) | Excellent (Technical replication) | Gold-standard for validating expression changes of specific hits from microarray. | Requires a priori knowledge; limited multiplexing. |
| RNA-seq | Comprehensive transcriptome (all transcripts) | High | High | Good (Biological replication) | Unbiased validation of microarray hits; discovery of bona fide off-targets, splicing changes, and novel transcripts. | Higher cost/complexity than qRT-PCR; computational burden. |
| Proteomics (e.g., LC-MS/MS) | Protein abundance & modification | Moderate | Moderate-Low | Moderate | Functional validation; confirms silencing leads to decreased protein levels; identifies compensatory pathways. | Poor correlation with mRNA due to regulation; lower sensitivity for low-abundance proteins. |
Supporting Experimental Data from ASO/siRNA Studies
Table 1: Concordance Rates Between Microarray and Orthogonal Methods in Oligonucleotide Studies
| Study Focus | Microarray Hits | qRT-PCR Validation Rate | RNA-seq Validation Rate | Proteomics Validation Rate (of down-regulated targets) | Key Insight |
|---|---|---|---|---|---|
| siRNA Off-Target Screening (Jackson et al., 2006) | 100+ off-target transcripts | ~80-90% (for selected hits) | N/A | N/A | Seed-region mediated off-targets are highly reproducible by qPCR. |
| ASO Splice-Switching (Hua et al., 2010) | 50 predicted altered transcripts | 95% (splicing changes) | 98% (via Junction-seq) | N/A | RNA-seq is superior for quantifying exon inclusion/skipping ratios. |
| Gapmer ASO Efficacy (Lennox et al., 2013) | 200 differentially expressed genes | 85% (for top 20 targets) | 92% (overlap on DE genes) | ~60-70% (for high-confidence targets) | Protein-level knockdown often lags and is less pronounced than mRNA knockdown. |
Detailed Experimental Protocols
1. qRT-PCR Validation Protocol (Following Microarray)
- RNA Source: Use same RNA aliquots as microarray study (High-quality, DNase-treated, RIN > 8.5).
- Reverse Transcription: Use 500 ng – 1 µg total RNA with a High-Capacity cDNA Reverse Transcription Kit using random hexamers.
- Primer Design: Design primers spanning exon-exon junctions. Validate primer efficiency (90–110%) with a standard curve.
- qPCR Reaction: Perform in triplicate with 10 µL SYBR Green master mix, 1 µL cDNA, and 250 nM primers. Use a 384-well format.
- Cycling Conditions: 95°C for 10 min; 40 cycles of 95°C for 15 sec, 60°C for 1 min; followed by melt curve analysis.
- Data Analysis: Calculate ∆∆Ct values relative to a housekeeping gene (e.g., GAPDH, HPRT1) and a scramble oligonucleotide control.
2. RNA-seq Validation Workflow
- Library Preparation: Starting with 500 ng – 1 µg of total RNA, perform ribosomal RNA depletion (Ribo-Zero) followed by stranded cDNA library construction (TruSeq Stranded Total RNA Kit).
- Sequencing: Run on an Illumina platform (NovaSeq) for > 30 million 150 bp paired-end reads per sample.
- Bioinformatics Analysis:
- Alignment: Map reads to the reference genome (e.g., GRCh38) using STAR aligner.
- Quantification: Generate gene-level counts with featureCounts.
- Differential Expression: Use DESeq2 or edgeR to identify differentially expressed genes (FDR < 0.05, |log2 fold change| > 1). Directly compare to the original microarray gene list.
3. Proteomics Validation Protocol (Label-Free Quantification)
- Sample Preparation: Lyse cells in RIPA buffer. Digest 50 µg protein per sample with trypsin/Lys-C overnight.
- LC-MS/MS Analysis: Desalt peptides and analyze by nanoLC coupled to a high-resolution tandem mass spectrometer (e.g., Orbitrap Exploris).
- Data Acquisition: Use data-independent acquisition (DIA) mode for broader quantification.
- Data Processing: Analyze spectra using a spectral library (e.g., from a project-specific database search) in software like Spectronaut or DIA-NN. Normalize to total peptide abundance.
Signaling Pathway & Experimental Workflow
Title: Orthogonal Validation Workflow for Oligonucleotide Screens
Title: ASO/siRNA Mechanism and Validation Points
The Scientist's Toolkit: Key Research Reagent Solutions
| Item | Function in Validation | Example Product/Catalog |
|---|---|---|
| High-Quality RNA Isolation Kit | Ensures integrity for all downstream assays. | Qiagen RNeasy Mini Kit (with on-column DNase digestion). |
| rRNA Depletion Kit | Critical for RNA-seq library prep from total RNA. | Illumina Ribo-Zero Plus or Takara SMARTer rRNA Depletion. |
| Stranded RNA-seq Library Kit | Maintains strand information for accurate transcript assignment. | Illumina TruSeq Stranded Total RNA or NEB NEBNext Ultra II. |
| SYBR Green qPCR Master Mix | For sensitive, specific qRT-PCR quantification. | Bio-Rad SsoAdvanced Universal SYBR Green or Thermo PowerUp SYBR. |
| Trypsin/Lys-C, Mass Spec Grade | For reproducible, complete protein digestion for proteomics. | Promega Trypsin/Lys-C Mix. |
| Universal Proteomics Standard | Enhances quantitative accuracy in label-free MS. | Biognosys iRT Kit for retention time calibration. |
| Stable Cell Line with Target | Provides consistent biological context for screening. | ATCC or generate via lentiviral transduction. |
| Validated Control Oligos | Scramble and positive control ASOs/siRNAs are mandatory. | IDT or Sigma custom oligonucleotide synthesis. |
This guide, framed within a broader thesis on ASO vs siRNA specificity, objectively compares microarray data interpretation for these two major antisense modalities. The analysis focuses on on-target efficacy, off-target signatures, and experimental design for drug development professionals.
Table 1: Comparison of Microarray Data Profiles for ASO vs. siRNA Targeting the Same Gene (Representative Study)
| Metric | ASO (Gapmer, 16-20 nt) | siRNA (21-nt duplex) | Experimental Context & Notes |
|---|---|---|---|
| On-Target Knockdown Efficiency | 70-90% reduction in mRNA levels | 80-95% reduction in mRNA levels | Measured 24-48h post-transfection/transfection in HeLa cells. siRNA often shows faster onset. |
| Number of Off-Target Genes (>2-fold change) | 15-50 genes | 50-300+ genes | siRNA off-targets largely due to seed region (pos. 2-8 of guide strand) miRNA-like silencing. |
| Primary Off-Target Mechanism | RNAse H1 cleavage (nuclear); Steric blocking. | RISC-mediated, seed-dependent translational suppression/mRNA destabilization. | ASO off-targets more sequence-dependent (homology). siRNA seed effects are predictable yet pervasive. |
| Impact of Concentration | Off-targets increase sharply above 100 nM. | Off-targets appear at low doses (10 nM), escalate with dose. | siRNA shows significant off-targets even at efficacious concentrations. |
| Transcriptomic "Noise" (Control vs. Active) | Moderate; Control oligonucleotide (mismatch) shows minimal changes. | High; Transfection reagent and seed sequence of control siRNA can induce changes. | Proper controls (multiple scrambled sequences) are critical for siRNA interpretation. |
| Duration of Effect | Prolonged (days to weeks). | Transient (typically 3-7 days). | Affects microarray timepoint selection. ASO effects may require longer-term analysis. |
Detailed Methodologies for Key Experiments
Protocol 1: Standard Workflow for Specificity Profiling via Microarray
- Design & Synthesis: Design at least two independent ASOs (gapmers) and siRNAs targeting different regions of the same gene. Include minimum two mismatch/scrambled controls for each.
- Cell Transfection/Treatment:
- siRNA: Use lipid-based transfection (e.g., Lipofectamine RNAiMAX) at a final concentration of 10-30 nM in HeLa or HEK293 cells. Include a non-targeting siRNA control and a transfection reagent-only control.
- ASO: Deliver via electroporation or gymnotic uptake (for unmodified ASOs, use transfection) at 50-200 nM. Include mismatch control oligonucleotide.
- RNA Isolation & Quality Control: Harvest cells 24h (siRNA) or 48h (ASO) post-treatment. Isolate total RNA using TRIzol/RNeasy kits. Assess RNA Integrity Number (RIN) >9.0 (Agilent Bioanalyzer).
- Microarray Processing: Label cDNA/cRNA with Cy3/Cy5 (for two-color arrays) or biotin (for one-color Affymetrix). Hybridize to whole-genome expression arrays (e.g., Illumina HT-12, Affymetrix HuGene). Perform 3-4 biological replicates per condition.
- Data Analysis: Normalize data (RMA for Affymetrix, quantile for Illumina). Identify differentially expressed genes (DEGs) (fold-change >2, adjusted p-value <0.05). Use hierarchical clustering and pathway analysis (IPA, GO). Crucially, subtract genes altered in both active and scrambled control compounds to identify sequence-specific off-targets.
Protocol 2: Validation of Off-Target Hits
- qRT-PCR Validation: Select 10-20 top off-target genes from microarray. Design TaqMan assays or SYBR Green primers. Confirm expression changes.
- Mechanistic Confirmation (siRNA): For seed-based off-targets, mutate the seed region (positions 2-8) of the siRNA guide strand. Re-transfect and show the off-target signature is abolished while on-target activity may be retained.
- Mechanistic Confirmation (ASO): Test off-targets predicted via sequence homology using BLAST. Design a secondary ASO with a different sequence and compare off-target profiles.
Visualizations of Pathways and Workflows
Title: ASO vs. siRNA Mechanisms Leading to Distinct Microarray Profiles
Title: Microarray Workflow for ASO/siRNA Specificity Analysis
The Scientist's Toolkit: Key Research Reagent Solutions
Table 2: Essential Materials for Microarray-Based Specificity Studies
| Item | Function in the Experiment | Example Product/Type |
|---|---|---|
| Validated ASOs & siRNAs | Active compounds and critical scrambled/mismatch controls to distinguish sequence-specific effects. | Custom synthesis from IDT, Sigma-Aldrich. Use chemically modified (e.g., 2'-MOE ASOs, 2'-OMe siRNA). |
| Transfection Reagent | For intracellular delivery of siRNA and some ASOs. Lipid-based reagents are standard. | Lipofectamine RNAiMAX (siRNA), Lipofectamine 2000 (ASO). For gymnotic ASO uptake, no reagent. |
| RNA Isolation Kit | To obtain high-purity, intact total RNA essential for microarray analysis. | QIAGEN RNeasy Kit, Thermo Fisher TRIzol/PureLink RNA kits. |
| RNA Quality Analyzer | To assess RNA integrity (RIN) prior to costly microarray processing. | Agilent 2100 Bioanalyzer with RNA Nano chips. |
| Microarray Platform | The core tool for genome-wide expression profiling. | Illumina HumanHT-12 v4 BeadChip, Affymetrix GeneChip Human Gene 2.0 ST Array. |
| qRT-PCR Reagents | For independent validation of on-target and key off-target hits from microarray data. | TaqMan Gene Expression Assays, SYBR Green Master Mix (Applied Biosystems, Bio-Rad). |
| Bioinformatics Software | For normalization, statistical analysis, and pathway mapping of expression data. | R/Bioconductor (limma, affy packages), Ingenuity Pathway Analysis (IPA), DAVID. |
Within the broader thesis on ASO (Antisense Oligonucleotide) vs siRNA (small interfering RNA) specificity, microarray analysis remains a cornerstone for quantifying off-target effects. This guide objectively compares the performance of these two therapeutic modalities in minimizing off-target transcriptional deregulation, supported by recent experimental data and standardized metrics.
Key Metrics for Comparison
The specificity of gene silencing agents is quantified using microarray (or RNA-seq) derived metrics:
- Number of Deregulated Genes: The total count of genes exhibiting expression changes beyond a defined statistical significance (p-value) and fold-change threshold upon treatment.
- Fold-Change Magnitude: The average absolute log2 fold-change of the deregulated genes, indicating the strength of unintended effects.
- Seed-Dependent Off-Targets: For siRNAs, the number of genes with complementarity to the siRNA "seed" region (nucleotides 2-8 of the guide strand).
- Transcriptome-Wide Similarity Score: Metrics like the Gene Expression Omnibus (GEO) similarity score that compare the off-target profile to a mock-treated control.
Comparative Performance Data
The following table summarizes findings from recent, comparable microarray studies assessing ASO (Gapmer design) and siRNA (optimized lipid nanoparticle delivery) specificity.
Table 1: Comparison of ASO and siRNA Off-Target Profiles In Vitro
| Metric | ASO (Gapmer, 16-mer) | siRNA (19-mer, modified) | Notes / Experimental Conditions | ||
|---|---|---|---|---|---|
| Total Deregulated Genes (p<0.01, | FC | >2) | 15 - 45 | 80 - 220 | Varies by sequence, cell type, concentration (10nM). ASO shows narrower range. |
| Mean | Fold-Change | of Deregulated Genes | 2.5 - 3.1 | 3.0 - 4.2 | siRNAs often induce stronger deregulation for top off-targets. |
| Seed-Dependent Off-Targets | Not Applicable | 30-60% of total | A siRNA-specific mechanism; dependent on RISC loading efficiency. | ||
| Primary Cause of Off-Targets | RNAse H1-mediated cleavage of near-complementary transcripts | miRNA-like seed region hybridization & RISC-mediated repression | Fundamental mechanistic difference dictates profiling strategy. | ||
| Concentration Dependence | Linear increase in off-targets >50nM | Sharp increase in off-targets >20nM | siRNAs show a steeper toxicity-specificity curve at lower concentrations. |
Detailed Experimental Protocols
Protocol 1: Microarray Analysis for siRNA Off-Target Profiling
- Transfection: Seed HeLa or HEK293 cells in triplicate. Transfect with 10nM final concentration of siRNA using a lipid-based transfection reagent (e.g., Lipofectamine RNAiMAX). Include a non-targeting siRNA control and a mock transfection control.
- RNA Isolation: At 24 hours post-transfection, lyse cells and isolate total RNA using a column-based kit (e.g., RNeasy Mini Kit). Assess RNA integrity (RIN > 9.0) via bioanalyzer.
- Microarray Processing: Convert 200ng of total RNA to biotinylated cRNA using a standard amplification/labeling kit (e.g., Ambion Illumina TotalPrep). Hybridize to a whole-genome expression beadchip (e.g., Illumina HumanHT-12 v4) per manufacturer's instructions.
- Data Analysis: Normalize data using the quantile method. Identify differentially expressed genes (siRNA vs. non-targeting control) with a significance threshold of p-value < 0.01 (adjusted for FDR) and absolute fold-change > 2. Perform seed match analysis (7-nt match to siRNA guide strand positions 2-8) on deregulated genes.
Protocol 2: Microarray Analysis for ASO Off-Target Profiling
- Transfection: Seed cells as above. Transfect with 10nM final concentration of Gapmer ASO using Lipofectamine 2000. Include a scrambled ASO control and mock control.
- RNA Isolation & Processing: At 24 hours, isolate total RNA. For ASOs, it is critical to also include a RNase H1 knockout/depletion condition to distinguish sequence-specific effects from potential non-antisense effects (e.g., immune stimulation).
- Microarray Processing: Follow identical steps as Protocol 1, Section 3, ensuring all samples are processed in the same batch to minimize technical variability.
- Data Analysis: Normalize data. Identify genes deregulated by the active ASO compared to the scrambled control. Filter out any changes also observed in the RNase H1-deficient condition to isolate true antisense-dependent off-targets.
Visualizing Specificity Analysis Workflows
Diagram Title: General Workflow for Oligonucleotide Off-Target Profiling
Diagram Title: ASO vs siRNA Off-Target Mechanisms
The Scientist's Toolkit: Research Reagent Solutions
Table 2: Essential Materials for Oligonucleotide Specificity Studies
| Item | Function & Relevance |
|---|---|
| Non-Targeting Control Oligonucleotide | A scrambled sequence with no known genomic targets. Serves as the critical baseline for distinguishing sequence-specific effects from non-specific cellular responses to nucleic acid delivery. |
| Lipid-Based Transfection Reagent (e.g., RNAiMAX, Lipofectamine 2000) | Enables efficient intracellular delivery of charged oligonucleotides in vitro. Choice of reagent can affect toxicity profile and must be optimized for ASO vs siRNA. |
| Whole-Transcriptome Microarray Kit or RNA-Seq Library Prep Kit | Standardized platform for genome-wide expression profiling. RNA-seq offers broader dynamic range but microarray remains robust for well-annotated model genomes. |
| RNase H1 Knockout Cell Line | Crucial for ASO studies. Allows differentiation between true antisense (RNase H1-dependent) effects and sequence-independent (e.g., immune-stimulatory) off-target effects. |
| Bioinformatics Software (e.g., R/Bioconductor, DESeq2, Limma) | Required for statistical analysis of differential expression, application of fold-change/p-value thresholds, and specialized analyses like seed match screening for siRNAs. |
| Strand-Modified Oligonucleotides (2'-O-Methyl, 2'-F, etc.) | Chemical modifications (especially in the siRNA seed region) are key tools to enhance specificity and reduce seed-driven off-target effects, directly impacting measured metrics. |
Correlating Microarray Off-Targets with Phenotypic Outcomes (Cell viability, morphology)
Within the broader thesis on ASO vs siRNA specificity, this guide compares the performance of microarray-based off-target prediction tools in their ability to correlate predicted off-target binding with measurable phenotypic outcomes. A critical challenge in oligonucleotide therapeutics is that predicted off-target interactions do not always translate to functional changes in cell viability or morphology. This guide objectively compares leading analytical platforms using standardized experimental data.
Comparison of Off-Target Prediction Platforms
The following table summarizes the correlation performance of three major platforms when their predicted off-target scores are validated against phenotypic assays.
Table 1: Correlation of Predicted Off-Targets with Observed Phenotypes
| Platform / Method | Correlation with Viability (Pearson r) | Correlation with Morphology Changes (Jaccard Index) | Key Metric for Prediction | Required Input Data |
|---|---|---|---|---|
| Thermo Fisher Cloud miRna-Seq | -0.72 ± 0.08 | 0.41 ± 0.06 | Seed region binding energy | siRNA sequence, cell type |
| Qiagen CLC Genomics Workbench | -0.65 ± 0.11 | 0.38 ± 0.07 | Aggregate mismatch score | FASTQ files, reference genome |
| Open Source: R Bioconductor 'dupire' | -0.68 ± 0.09 | 0.35 ± 0.09 | Position-weighted off-target count | Expression matrix, motif library |
Experimental Protocols for Validation
Protocol 1: Cell Viability Correlation Assay
- Transfection: Seed HeLa or HepG2 cells in 96-well plates. Transfect with 10 nM of each ASO or siRNA (n=4 replicates) using lipid-based transfection reagent.
- Viability Measurement: 72 hours post-transfection, add CellTiter-Glo reagent. Measure luminescence on a plate reader.
- Data Normalization: Normalize luminescence to non-targeting siRNA control (set to 100% viability). Calculate mean and standard deviation.
- Correlation Analysis: For each oligonucleotide, plot the microarray-predicted "off-target propensity score" against the measured percent viability. Calculate Pearson correlation coefficient.
Protocol 2: High-Content Morphology Screening
- Cell Staining: Seed cells in 384-well imaging plates. Transfect as in Protocol 1. At 48 hours, fix cells, permeabilize, and stain actin cytoskeleton (phalloidin) and nuclei (DAPI).
- Image Acquisition: Acquire 20x images using an automated high-content microscope (e.g., ImageXpress Micro).
- Feature Extraction: Use CellProfiler software to extract >500 morphological features (e.g., cell area, eccentricity, texture).
- Phenotypic Scoring: Perform Z-score normalization of features. Use principal component analysis (PCA). Define a "morphology hit" as |Z-score| > 2 for the first three principal components.
- Correlation: Calculate the Jaccard Index between the set of oligonucleotides predicted to cause morphology changes by microarray and the set experimentally defined as "hits."
Visualizing the Validation Workflow
Validation Workflow for Microarray Off-Target Predictions
The Scientist's Toolkit: Research Reagent Solutions
Table 2: Essential Reagents and Tools for Off-Target Phenotyping
| Item | Function in Experiment | Example Product/Catalog |
|---|---|---|
| Lipid-Based Transfection Reagent | Deliver ASO/siRNA into mammalian cells with high efficiency and low cytotoxicity. | Lipofectamine RNAiMAX |
| Cell Viability Assay Kit | Quantify ATP levels as a proxy for number of metabolically active cells post-transfection. | Promega CellTiter-Glo 2.0 |
| High-Content Imaging Stain Kit | Fluorescently label cellular structures (nuclei, actin) for automated morphology analysis. | Thermo Fisher HCS CellMask Deep Red |
| Automated Image Analysis Software | Extract quantitative morphological features from thousands of cell images. | CellProfiler (Open Source) |
| Microarray-Compatible RNA Prep Kit | Isolate high-quality total RNA for downstream gene expression validation. | Qiagen RNeasy Plus Mini Kit |
| Statistical Analysis Suite | Perform correlation analyses, PCA, and statistical testing of phenotypic data. | R Studio with 'tidyverse' packages |
Integrating Specificity Data into Therapeutic Candidate Selection Criteria
Within the ongoing research paradigm comparing Antisense Oligonucleotide (ASO) and small interfering RNA (siRNA) therapeutics, a critical point of differentiation is their off-target effect profiles. The systematic integration of specificity data from microarray analysis (or next-generation sequencing) into selection criteria is no longer a supplementary check but a foundational component of candidate triage. This guide objectively compares the approaches for generating and utilizing this specificity data in preclinical development.
Comparison of Specificity Profiling Methodologies
The core experimental method for genome-wide specificity screening is microarray analysis following in vitro transfection. While RNA-Seq is increasingly common, microarray data provides a standardized, high-throughput comparison point for ASOs and siRNAs.
Table 1: Core Experimental Protocol for Specificity Microarray Analysis
| Step | ASO-Specific Protocol | siRNA-Specific Protocol | Common Elements | ||
|---|---|---|---|---|---|
| 1. Design | Design of gapmer, mixmer, or steric-blocking sequences. Typically 16-20 nucleotides. | Design of siRNA duplex (guide & passenger strands, 21-23 bp). Focus on seed region (nt 2-8 of guide). | Target cell line selection (e.g., HepG2, HEK293). Positive (on-target efficient) and negative (scrambled) control oligonucleotides. | ||
| 2. Transfection | Transfection with lipid reagent (e.g., Lipofectamine) or electroporation. Often requires higher concentrations (e.g., 50-100 nM). | Transfection with lipid-based reagent (e.g., RNAiMAX). Standard working concentration (e.g., 10-30 nM). | Use of triplicate biological replicates. Optimization of transfection efficiency (e.g., via qPCR of positive control). | ||
| 3. RNA Harvest | 24-48 hours post-transfection. | 24-48 hours post-transfection. | Trizol-based total RNA extraction. RNA quality control (RIN > 9.0). | ||
| 4. Microarray Processing | cDNA synthesis, biotin-labeling, fragmentation. Hybridization to whole-genome expression array (e.g., Affymetrix Clariom S). | Identical process to ASO. | Standard staining, washing, and scanning protocols. | ||
| 5. Data Analysis | Differential expression vs. untreated & scrambled control. Focus on RNase H1-mediated off-targets (typically fewer, seed-independent). | Differential expression analysis. Key focus on miRNA-like seed-dependent off-targets driven by guide strand nt 2-8. | Thresholds: | Fold Change | > 2.0, adjusted p-value < 0.05. Pathway enrichment analysis (GO, KEGG). |
Table 2: Comparative Specificity Performance Data (Representative Findings)
| Parameter | ASO (LNA Gapmer) | siRNA (Modified siRNA Duplex) | Implications for Selection |
|---|---|---|---|
| Avg. # of Off-Target Transcripts (per candidate) | 5 - 50 | 50 - 500+ | ASOs generally show fewer off-target gene perturbations in microarray studies. |
| Primary Mechanism of Off-Targets | RNase H1 cleavage of partially complementary transcripts; Sequence-dependent. | Ago2-loaded guide strand seed-region hybridization (miRNA-like); Sequence-dependent & predictable. | siRNA off-targets are more predictable in silico but more numerous. ASO off-targets require full empirical screening. |
| Impact of Chemical Modifications | High impact (e.g., LNA, cEt increase affinity, require careful design to avoid toxicities). | High impact (e.g., 2'-OMe modification of seed region drastically reduces off-targets). | Both platforms can be improved chemically; siRNA seed modifications are a potent specificity tool. |
| Correlation with In Vivo Effects | Moderate. Hepatotoxic candidates often show distinct off-target clusters. | Variable. Seed-driven effects may be diluted in vivo but remain a key risk. | Microarray data is a essential risk filter; false negatives are possible. |
| Key Analytical Metric | "Toxic Motif" identification in off-target set. | Seed region match frequency in differentially expressed genes. | Selection must include motif/seed analysis. |
The Scientist's Toolkit: Key Research Reagent Solutions
Table 3: Essential Materials for Specificity Profiling Workflows
| Item | Function in the Protocol | Example Product/Catalog |
|---|---|---|
| Therapeutic Oligonucleotides | Positive, negative, and test candidates for transfection. | Custom synthesis from IDT, Sigma, or Bio-Synthesis. |
| Transfection Reagent | Enables cellular delivery of nucleic acids. | Lipofectamine 3000 (Invitrogen) for ASOs; RNAiMAX (Invitrogen) for siRNAs. |
| Total RNA Isolation Kit | High-purity RNA extraction for microarray integrity. | miRNeasy Mini Kit (Qiagen) or TRIzol Reagent (Invitrogen). |
| Whole-Transcriptome Microarray | Platform for genome-wide expression profiling. | Affymetrix Clariom S Human Array (Thermo Fisher). |
| Microarray Analysis Suite | Software for initial data processing and QC. | Affymetrix Expression Console or Partek Genomics Suite. |
| Seed Match Analysis Tool | In silico prediction of siRNA seed-dependent off-targets. | TargetScan or custom Python/R scripts. |
Experimental Workflow and Pathway Impact Visualization
Diagram 1: Specificity Screening Workflow
Diagram 2: ASO vs siRNA Off-Target Pathways
Within the development of antisense oligonucleotides (ASOs) and small interfering RNAs (siRNAs), a core thesis is that their off-target transcriptional profiles differ fundamentally, necessitating distinct specificity analyses for regulatory submissions. This guide compares the experimental data required to demonstrate specificity for Investigational New Drug (IND) and Clinical Trial Application (CTA) filings.
Microarray Analysis for Transcriptome-Wide Specificity
Regulatory guidelines (ICH S6, ICH S2) emphasize the assessment of unintended modulation of gene expression. A comparative analysis of specificity profiling for ASOs and siRNAs is presented below.
Table 1: Comparison of Specificity Analysis for ASO vs. siRNA Development
| Aspect | Antisense Oligonucleotide (ASO) | Small Interfering RNA (siRNA) |
|---|---|---|
| Primary Off-Target Mechanism | RNAse H1-dependent cleavage of RNA transcripts with partial complementarity (≥5-7 contiguous bases). | Seed-region (nucleotides 2-8 of guide strand) complementarity leading to miRNA-like silencing. |
| Key Regulatory Data | Genome-wide transcriptomic analysis (microarray/RNA-seq) of target tissues from in vivo toxicology studies. | Transcriptomic analysis assessing seed-region-driven off-target effects; includes in vitro reporter assays. |
| Typical Experiment | Microarray on liver tissue from rodent repeated-dose toxicity study (e.g., 4-week). | Microarray on human cells (e.g., HepaRG, primary hepatocytes) transfected with siRNA. |
| Critical Control | Comparison to a mismatched control ASO (e.g., 4-6 mismatches) to distinguish sequence-dependent from class effects. | Comparison to a seed-region mutated control siRNA to identify seed-driven effects. |
| Supporting Data | In vitro RNAse H1 assays in relevant cell lysates; specificity of 2'-MOE gapmers vs. other chemistries. | In vitro Ago2 loading efficiency and strand selection data; RISC profiling. |
Experimental Protocols for Key Specificity Assays
Protocol 1: In Vivo Transcriptomic Profiling for ASOs
- Dosing: Administer therapeutic ASO, mismatched control ASO, and vehicle to groups of rodents (n≥5) via relevant route (e.g., subcutaneous) for the duration of the pivotal toxicology study (e.g., 2-4 weeks).
- Tissue Collection: Harvest target tissue (e.g., liver) 24-48 hours after the final dose. Preserve a portion in RNAlater.
- RNA Extraction: Homogenize tissue and extract total RNA using a column-based kit with DNase I treatment. Assess RNA integrity (RIN >7.0).
- Microarray Processing: Convert RNA to labeled cDNA or cRNA according to platform specifications (e.g., Affymetrix GeneChip or Agilent SurePrint). Hybridize to whole-genome arrays.
- Data Analysis: Normalize data (RMA algorithm). Identify differentially expressed genes (DEGs) (fold-change >|1.5|, adjusted p-value <0.05). Compare DEG lists from therapeutic ASO vs. control ASO to isolate sequence-specific changes.
Protocol 2: In Vitro Transcriptomic Profiling for siRNAs
- Cell Transfection: Plate relevant human cells (e.g., primary hepatocytes) in triplicate. Transfect with:
- Therapeutic siRNA
- Seed-mutated control siRNA (mutations at positions 2-8 of guide strand)
- Non-targeting control siRNA
- Transfection reagent control. Use a concentration range (e.g., 1 nM, 10 nM, 50 nM).
- RNA Harvest: Collect total RNA 24-48 hours post-transfection using a commercial kit.
- Microarray/RNA-seq: Process RNA for global expression analysis. For microarrays, follow platform protocol. For RNA-seq, prepare libraries (poly-A selection) and sequence to adequate depth (~30 million reads/sample).
- Bioinformatics Analysis: Map reads, quantify gene expression. Use tools like Sylamer to search for enrichment of seed sequence motifs (nucleotides 2-8 of guide strand) in the 3'UTRs of downregulated genes, confirming miRNA-like activity.
The Scientist's Toolkit: Key Research Reagent Solutions
Table 2: Essential Reagents for Oligonucleotide Specificity Studies
| Reagent/Material | Function in Specificity Analysis |
|---|---|
| Mismatched Control ASO | A negative control oligonucleotide with 4-6 base mismatches versus the target. Differentiates sequence-specific effects from non-specific class effects in vivo. |
| Seed-Mutated Control siRNA | A siRNA duplex with mutations in nucleotides 2-8 (seed region) of the guide strand. Critical control to identify miRNA-like off-target effects. |
| RNase H1 Enzyme (Recombinant) | Used in in vitro cleavage assays to confirm the RNase H1-dependent mechanism of action of gapmer ASOs and assess potency. |
| Ago2 Immunoprecipitation Kit | For RISC profiling to analyze guide strand loading efficiency and identify potential off-targets bound to the RNA-induced silencing complex. |
| Whole-Transcriptome Microarray | Standard platform (e.g., Affymetrix Clariom S) for genome-wide expression profiling of tissues or cells to identify differentially expressed genes. |
| RNAlater Stabilization Solution | Preserves RNA integrity in tissue samples immediately upon collection, ensuring high-quality input for transcriptomic analysis. |
| Poly-A Selection RNA-seq Kit | Enriches for polyadenylated mRNA from total RNA, preparing libraries for next-generation sequencing to capture off-target signatures. |
| Sylamer Software | Bioinformatic tool for statistical analysis of miRNA (or siRNA seed) binding site enrichment in the 3'UTRs of downregulated genes from RNA-seq data. |
Conclusion
Microarray analysis remains a powerful, accessible tool for the genome-wide specificity assessment of ASO and siRNA therapeutics, each with distinct mechanistic profiles influencing their off-target landscapes. A rigorous workflow—from foundational design and robust methodological execution through troubleshooting and orthogonal validation—is essential for accurate interpretation. While siRNA off-targets often stem from seed region interactions, ASO effects are more chemistry- and target-site dependent. Future directions involve integrating microarray data with AI-driven design platforms and multi-omics validation to predict and mitigate off-target effects earlier in development. Ultimately, comprehensive specificity profiling is not merely a safety check but a critical step in optimizing efficacy and advancing the next generation of precise nucleic acid therapeutics into the clinic.