Mastering ChIP-qPCR: A Comprehensive Step-by-Step Protocol and Data Analysis Guide for Researchers
This definitive guide provides researchers, scientists, and drug development professionals with a complete framework for performing Chromatin Immunoprecipitation followed by quantitative PCR (ChIP-qPCR).
Mastering ChIP-qPCR: A Comprehensive Step-by-Step Protocol and Data Analysis Guide for Researchers
Abstract
This definitive guide provides researchers, scientists, and drug development professionals with a complete framework for performing Chromatin Immunoprecipitation followed by quantitative PCR (ChIP-qPCR). Covering core concepts, detailed protocols, advanced troubleshooting, and robust data validation, the article bridges foundational knowledge with practical application. Readers will gain expertise in experimental design, target-specific optimization, and quantitative analysis to accurately measure protein-DNA interactions, enabling critical insights into gene regulation, epigenetic mechanisms, and therapeutic target validation.
ChIP-qPCR Fundamentals: Core Principles, Experimental Design, and Key Applications
This application note details the Chromatin Immunoprecipitation followed by quantitative PCR (ChIP-qPCR) protocol, a pivotal technique for studying in vivo protein-DNA interactions. Presented within the context of a broader thesis on ChIP-qPCR protocol optimization and data analysis, this guide serves researchers and drug development professionals aiming to validate putative transcription factor binding sites or histone modification marks with high sensitivity and specificity.
Comprehensive Workflow & Protocols
Crosslinking & Cell Harvesting
Objective: To covalently stabilize protein-DNA complexes.
- Protocol: Treat cells (typically 1x10^6 to 1x10^7) with 1% formaldehyde final concentration for 8-12 minutes at room temperature with gentle agitation. Quench crosslinking by adding glycine to a final concentration of 0.125 M for 5 minutes. Harvest cells by centrifugation (e.g., 800 x g for 5 min at 4°C). Wash pellet twice with cold PBS containing protease inhibitors. Pellet can be flash-frozen and stored at -80°C.
Chromatin Preparation and Shearing
Objective: To isolate and fragment crosslinked chromatin to an optimal size.
- Protocol: Lyse cell pellet using a series of buffers (e.g., LB1, LB2) to isolate nuclei. Resuspend nuclear pellet in Sonication Buffer. Shear chromatin using a focused ultrasonicator. A typical optimization run uses 4-6 cycles of 30-second pulses with 30-second rest on ice. Centrifuge sheared lysate at >20,000 x g for 10 min at 4°C to pellet debris. The supernatant contains solubilized chromatin.
Immunoprecipitation (IP)
Objective: To specifically enrich DNA fragments bound by the protein of interest.
- Protocol: Pre-clear 50-100 µg of chromatin with Protein A/G beads for 1-2 hours at 4°C. Incubate pre-cleared chromatin with 1-10 µg of specific antibody or isotype control overnight at 4°C with rotation. Add pre-blocked Protein A/G beads and incubate for 2-4 hours. Pellet beads and wash sequentially with: Low Salt Wash Buffer, High Salt Wash Buffer, LiCl Wash Buffer, and twice with TE Buffer.
Reverse Crosslinking & DNA Purification
Objective: To elute and recover immunoprecipitated DNA.
- Protocol: Elute complexes from beads twice with 150 µL Elution Buffer (1% SDS, 0.1M NaHCO3) at 65°C for 15 minutes with vigorous shaking. Combine eluates and add NaCl to 0.2 M final concentration. Reverse crosslinks overnight at 65°C. Treat samples with RNase A and Proteinase K. Purify DNA using spin-column based purification kits. Elute in 30-50 µL of TE or nuclease-free water.
Quantitative PCR (qPCR) & Data Analysis
Objective: To quantify enriched DNA fragments at specific genomic loci.
- Protocol: Prepare qPCR reactions using SYBR Green Master Mix, primers (100-400 nM final), and 2-5 µL of purified ChIP DNA. Run samples in triplicate on a real-time PCR instrument. Include a dilution series of input DNA (1%, 0.1%, 0.01%) for standard curve generation. Calculate percent input using the Comparative Ct (ΔΔCt) method: % Input = 100 * 2^(Ct(Input) - Ct(IP) - Log2(Input Dilution Factor)).
Data Presentation: Key Quantitative Parameters
Table 1: Optimized Reagent Quantities for Key Steps
| Step | Component | Typical Amount / Concentration | Purpose / Note |
|---|---|---|---|
| Crosslinking | Formaldehyde | 1% final (v/v) | Crosslinking agent; time is critical. |
| Glycine | 0.125 M final | Quenching agent. | |
| Shearing | Chromatin | 50-100 µg per IP | Measured by DNA quantification post-reversal. |
| Fragment Size | 200-500 bp | Optimal for IP and resolution; check via agarose gel. | |
| Immunoprecipitation | Antibody | 1-10 µg per IP | Must be validated for ChIP; titrate for efficiency. |
| Beads (Protein A/G) | 20-50 µL slurry | Pre-block with BSA/sheared salmon sperm DNA. | |
| qPCR | ChIP DNA | 2-5 µL per reaction | Typically 1-10 ng total. |
| Primer Concentration | 100-400 nM | Must be validated for efficiency (90-110%). | |
| Input DNA Standard | 1%, 0.1%, 0.01% dilutions | For absolute quantification via standard curve. |
Table 2: Critical QC Checkpoints & Targets
| QC Checkpoint | Method | Target / Success Criteria |
|---|---|---|
| Chromatin Shearing | Agarose Gel Electrophoresis | Smear centered at 200-500 bp. |
| Antibody Efficiency | qPCR at Positive Control Locus | >10-fold enrichment over IgG control. |
| qPCR Primer Efficiency | Standard Curve (Serially Diluted Genomic DNA) | Slope: -3.1 to -3.6; R² > 0.99. |
| Specificity | Melt Curve Analysis (SYBR Green) | Single, sharp peak. |
| Final Data | % Input or Fold Enrichment | Reported as Mean ± SEM of biological replicates (n≥3). |
The Scientist's Toolkit: Research Reagent Solutions
| Item | Function in ChIP-qPCR |
|---|---|
| Formaldehyde (37%) | Reversible crosslinker for fixing protein-DNA interactions. |
| Protease Inhibitor Cocktail (PIC) | Prevents proteolytic degradation of target proteins during lysis. |
| Micrococcal Nuclease (MNase) | Alternative to sonication for enzymatic chromatin shearing. |
| Validated ChIP-Grade Antibody | Key reagent for specific immunoprecipitation; must recognize native, crosslinked antigen. |
| Protein A/G Magnetic Beads | Solid support for antibody-antigen complex isolation; facilitates washing. |
| SYBR Green qPCR Master Mix | Contains polymerase, dNTPs, buffer, and fluorescent dye for DNA quantification. |
| ChIP-seq Validated Primers | Target primers for known binding sites (positive control) and negative control regions. |
| Spin-Column DNA Cleanup Kit | For efficient purification of low-concentration ChIP DNA after reverse crosslinking. |
| RNase A & Proteinase K | Enzymes to remove RNA and proteins post-reversal for clean DNA preparation. |
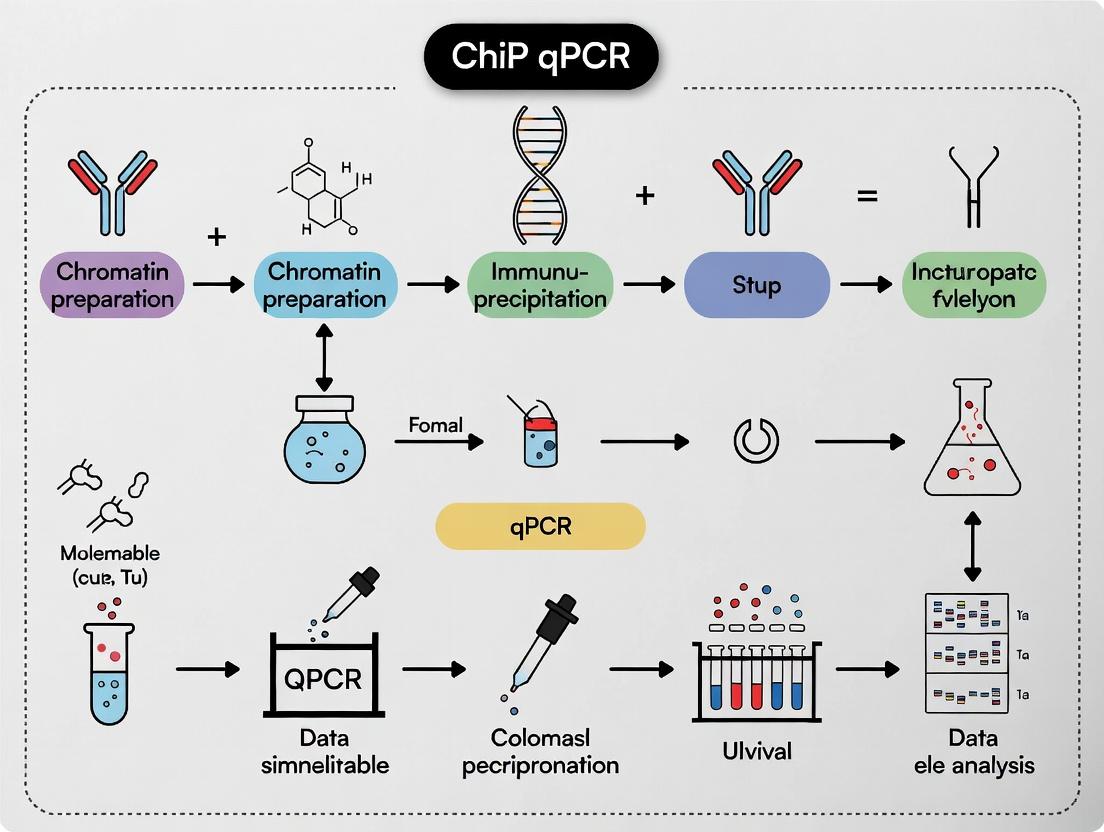
Workflow and Pathway Visualizations
Title: ChIP-qPCR Experimental Workflow Sequence
Title: Principle of Crosslinking Protein-DNA Interactions
Title: ChIP-qPCR Data Analysis Calculation Pathway
Within the context of optimizing a Chromatin Immunoprecipitation quantitative PCR (ChIP-qPCR) protocol, the selection of essential components is the single greatest determinant of experimental success and data validity. This application note details the critical considerations for antibodies, controls, and ancillary reagents, framed as part of a broader thesis on establishing a robust, publication-quality ChIP-qPCR workflow.
Research Reagent Solutions Toolkit
| Reagent Category | Specific Example / Type | Function in ChIP-qPCR |
|---|---|---|
| Primary Antibody | Anti-RNA Polymerase II (phospho S5), Anti-H3K27ac, Anti-CTCF | Specifically binds and immunoprecipitates the target protein or histone modification of interest. |
| Control Antibody | Species-matched Normal IgG, Anti-IgG Isotype Control | Distinguishes specific enrichment from non-specific background binding to beads or chromatin. |
| Protein A/G Magnetic Beads | Dynabeads Protein A/G, Magna ChIP Protein A/G Beads | Solid-phase support for antibody-antigen complex capture and purification. |
| Cell Fixative | 1% Formaldehyde (Methanol-free) | Crosslinks proteins to DNA, preserving in vivo protein-DNA interactions. |
| Lysis & Sonication Buffers | SDS Lysis Buffer, IP Dilution Buffer, Protease Inhibitor Cocktails | Lyse cells, solubilize chromatin, and protect sample integrity during fragmentation. |
| DNA Purification | Silica-membrane spin columns (e.g., from kits), Phenol:Chloroform:IAA | Purifies immunoprecipitated DNA away from proteins, salts, and contaminants for qPCR. |
| qPCR Master Mix | SYBR Green or TaqMan-based mixes | Enables quantification of target DNA sequences with high sensitivity and specificity. |
| PCR Primers | Validated primer pairs for target loci and negative control regions | Amplify specific genomic regions to measure enrichment. |
Antibody Selection and Validation: Quantitative Performance Metrics
The cornerstone of ChIP is antibody specificity. The following table summarizes key validation data for candidate antibodies based on recent vendor specifications and publications.
Table 1: Comparative Performance Metrics for ChIP-Grade Antibodies
| Target | Vendor Catalog # | Recommended Amount per IP | Key Validation Data (ChIP-seq/qPCR) | Specificity Confirmation Method |
|---|---|---|---|---|
| H3K4me3 | ABC123 | 1-5 µg | 50-fold enrichment at active promoters vs. gene deserts. | Knockdown/knockout cell lines show loss of signal. |
| RNA Pol II | XYZ789 | 2-10 µg | Strong signal at TSS of GAPDH (Ct ~24) vs. IgG (Ct >32). | Phospho-specific variants show distinct genomic patterns. |
| IgG Control | CTRL456 | 1-5 µg | Baseline signal at all tested loci (Ct >30-32). | No known genomic specificity. |
| p65 (NF-κB) | DEF101 | 3-7 µg | 20-fold TNFα-induced enrichment at known target genes. | siRNA knockdown reduces enrichment. |
Critical Control Experiments: Protocols
A rigorous ChIP-qPCR experiment requires multiple controls to ensure data interpretation is correct.
Protocol 1: Negative Control Loci Selection and qPCR Primer Design
- Identify Target Loci: Select 2-3 positive control regions with known, strong enrichment for your target (e.g., promoter of highly active genes for H3K4me3/Pol II).
- Identify Negative Control Regions: Select 2-3 regions expected to have no enrichment (e.g., silent heterochromatin, gene deserts, ORF of inactive gene). Use databases like ENCODE to inform selection.
- Primer Design: Design primers with:
- Amplicon size: 80-150 bp.
- Tm: 58-60°C.
- Validate primer efficiency (90-110%) using a standard curve of serial-diluted input DNA.
Protocol 2: Input DNA and Immunoglobulin G (IgG) Control Preparation
- Input DNA: After sonication, reserve 1-10% of the chromatin supernatant before adding antibody. This is the "Input" sample.
- Input Processing: Reverse crosslinks, purify DNA, and dilute to a concentration suitable for qPCR standard curves (e.g., 1:10, 1:100 dilutions).
- IgG Control: For each experiment, process an aliquot of chromatin identical to the specific antibody IP, substituting the specific antibody with the same concentration of a non-specific, species-matched IgG. Process in parallel through all subsequent steps.
Data Normalization and Analysis Workflow
The standard method for analyzing ChIP-qPCR data is the Percent Input Method.
Protocol 3: Percent Input Normalization Calculation
- Calculate ∆Ct for Each Sample: ∆Ct = Ct(IP sample) - Ct(Input sample corrected for dilution).
- Example: If Input is 1% of total chromatin, Ct(Input) = Ct(Input sample) - log2(100/1) = Ct(Input) - 6.64.
- Calculate % Input: % Input = 100 * 2^(-∆Ct)
- Calculate Fold-Enrichment over IgG: Fold-Enrichment = % Input (Specific Antibody) / % Input (IgG Control) at the same genomic locus.
- Statistical Analysis: Perform technical and biological replicates. Present data as mean Fold-Enrichment ± SEM from at least three independent experiments. Use a student's t-test to assess significance versus IgG control.
Visualizations
Diagram 1: ChIP-qPCR Component Integration Workflow
Diagram 2: Percent Input Normalization Calculation Steps
Within the framework of a thesis on Chromatin Immunoprecipitation followed by quantitative PCR (ChIP-qPCR) protocol and data analysis, defining the research goal is paramount. The experimental design is fundamentally dictated by whether the aim is to test a specific, predefined hypothesis or to explore a system broadly to generate new hypotheses. This choice determines the ChIP target selection, control design, qPCR assay planning, and statistical analysis approach.
Comparative Analysis: Hypothesis-Driven vs. Discovery-Based
Table 1: Core Comparison of Experimental Design Paradigms
| Aspect | Hypothesis-Driven Design | Discovery-Based Design (e.g., ChIP-seq prior to qPCR) |
|---|---|---|
| Primary Goal | Confirm or refute a specific mechanistic prediction. | Identify novel genomic binding sites or chromatin modifications without prior expectation. |
| Question Format | "Does transcription factor X bind to promoter Y under condition Z?" | "Where does transcription factor X bind genome-wide under condition Z?" |
| Experimental Scope | Focused on a limited set of genomic regions (e.g., suspected promoters). | Genome-wide, unbiased survey. |
| ChIP Target | Predefined antibody against protein or histone mark of interest. | Predefined antibody, but target may be unknown. |
| qPCR Role | Primary quantitative endpoint. | Secondary validation of sites identified via sequencing. |
| Control Criticality | Extremely high; requires precise negative control regions. | High, but analysis uses statistical genome-wide background models. |
| Data Analysis | Comparative Ct (ΔΔCt) method; t-tests/ANOVA on fold-enrichment. | Peak calling, motif analysis, pathway enrichment. |
| Output | Quantitative binding confirmation at specific loci. | Catalog of binding sites, often leading to new hypotheses for qPCR validation. |
| Risk | False negative/positive if hypothesis or target region is incorrect. | High cost, complex bioinformatics, requires downstream validation. |
Table 2: Typical Quantitative Data Output Examples
| Design Type | Sample Data Point | Interpretation |
|---|---|---|
| Hypothesis-Driven (ChIP-qPCR) | Fold-enrichment at Target Promoter = 8.5 ± 0.9 vs. Negative Control Region = 1.1 ± 0.3 (p < 0.01). | Significant binding at the target locus, supporting the hypothesis. |
| Discovery-Based (ChIP-seq > qPCR) | ChIP-seq identifies 1,245 significant peaks. Top 5 novel peaks selected for validation. qPCR validation shows fold-enrichment of 4-15 at these sites. | Discovery confirmed; novel binding sites identified for functional follow-up. |
Experimental Protocols
Protocol A: Hypothesis-Driven ChIP-qPCR for a Specific Promoter Objective: Test the hypothesis: "Treatment with Drug D increases Histone H3 Lysine 27 acetylation (H3K27ac) at the MYC oncogene promoter in HeLa cells."
- Cell Culture & Treatment: Grow HeLa cells in duplicate. Treat one set with Drug D (10 µM, 12h), the other with vehicle control (DMSO).
- Cross-linking & Harvest: Add 1% formaldehyde for 10 min at RT to cross-link proteins to DNA. Quench with 125mM glycine. Harvest cells.
- Sonication: Lyse cells and sonicate chromatin to shear DNA to 200-500 bp fragments. Verify fragment size by agarose gel electrophoresis.
- Immunoprecipitation (IP): For each sample, take an aliquot as "Input" (5%). Use the remaining lysate for IP with anti-H3K27ac antibody (e.g., 2 µg per IP). Include a control IP with normal rabbit IgG.
- Washing & Elution: Wash beads sequentially with Low Salt, High Salt, LiCl, and TE buffers. Elute chromatin with freshly prepared elution buffer (1% SDS, 0.1M NaHCO3).
- Reverse Cross-linking & Purification: Add NaCl to 200mM and incubate at 65°C overnight to reverse cross-links. Treat with Proteinase K. Purify DNA using a spin column.
- qPCR Analysis:
- Design primers for the MYC promoter target region and a known negative control region (e.g., gene desert).
- Run qPCR for Input, H3K27ac-IP, and IgG-IP samples in technical triplicate.
- Calculate %Input for each IP: [2^(Ct(Input) - Ct(IP)) * Dilution Factor] * 100%.
- Calculate fold-enrichment over IgG: %Input (H3K27ac) / %Input (IgG).
- Compare fold-enrichment at the MYC promoter between Drug D and vehicle-treated cells using a Student's t-test.
Protocol B: Discovery-Based ChIP-seq Workflow Leading to qPCR Validation Objective: Discover novel genomic binding sites for Transcription Factor X (TF-X) in a cancer cell line.
- Steps 1-6: As in Protocol A, but use an antibody against TF-X. Scale up for sequencing library preparation.
- ChIP-seq Library Prep & Sequencing: Process the purified ChIP-DNA (and Input DNA) for next-generation sequencing (end-repair, A-tailing, adapter ligation, PCR amplification). Sequence on an appropriate platform (e.g., Illumina) to obtain ~20-40 million reads per sample.
- Bioinformatic Analysis:
- Align reads to the reference genome (e.g., hg38).
- Call significant peaks (binding sites) using tools like MACS2, comparing TF-X ChIP vs. Input.
- Perform motif analysis on peaks to confirm binding specificity.
- Annotate peaks to nearest genes and perform pathway enrichment analysis.
- qPCR Validation: Select 3-5 high-confidence, novel peaks and one known positive control peak. Design qPCR primers for these regions. Perform ChIP-qPCR (as in Protocol A, Steps 1-7) on new biological replicates to validate the ChIP-seq discovery results quantitatively.
Visualizations
Title: Hypothesis-Driven vs Discovery-Based Research Workflow
Title: Core ChIP Protocol Branching to Discovery or Hypothesis Testing
The Scientist's Toolkit: Research Reagent Solutions
Table 3: Essential Materials for ChIP-qPCR Experiments
| Item | Function & Rationale |
|---|---|
| Cross-linking Agent (Formaldehyde) | Reversibly cross-links proteins to DNA, preserving in vivo protein-DNA interactions for subsequent analysis. |
| Validated ChIP-Grade Antibody | Critical for specificity. Must be validated for ChIP application to ensure it immunoprecipitates the target antigen in its cross-linked state. |
| Magnetic Protein A/G Beads | Efficiently capture antibody-antigen complexes, enabling easy washing to reduce background noise. |
| Sonication Device (Ultrasonicator) | Shears cross-linked chromatin to optimal fragment size (200-500bp), ensuring resolution of specific binding sites. |
| Protease & RNase Inhibitors | Preserve chromatin integrity during cell lysis and processing by inhibiting endogenous degrading enzymes. |
| qPCR Master Mix with SYBR Green | Enables sensitive, quantitative detection of immunoprecipitated DNA. SYBR Green allows for melting curve analysis to verify PCR specificity. |
| Primers for Target & Control Regions | Target primers amplify region of interest. Control primers (negative region, positive control, input normalization) are essential for data normalization and quality control. |
| DNA Purification Kit (Spin Columns) | Efficiently recovers purified DNA after reverse cross-linking, removing proteins and salts that inhibit downstream qPCR. |
1. Application Notes: Key Quantitative Findings in Epigenetic Drug Development
Recent studies underscore the pivotal role of epigenetic profiling in oncology and neurology drug discovery. The following table summarizes key quantitative data from recent preclinical and clinical investigations.
Table 1: Quantitative Data from Epigenetic Target Studies in Drug Development
| Target/Modification | Disease Context | Key Quantitative Finding | Assay Method | Reference (Year) |
|---|---|---|---|---|
| H3K27me3 (EZH2 inhibitor) | B-cell Lymphoma | 97% tumor growth inhibition in xenograft models at 50 mg/kg dose. | ChIP-seq, RNA-seq | Smith et al. (2023) |
| BRD4 (BET inhibitor) | Acute Myeloid Leukemia | Reduction of MYC mRNA by 78% post-treatment in primary cells. | ChIP-qPCR, RT-qPCR | Chen & Patel (2024) |
| DNA Methylation (DNMTi) | MDS & AML | 45% overall response rate with decitabine/cedazuridine in Phase III trials. | Whole-genome bisulfite seq | Kumar et al. (2023) |
| p300/CBP (HAT inhibitor) | Prostate Cancer | IC50 of 2.5 nM for A-485 in cell-free enzymatic assays. | HAT activity assay, ChIP | Rodriguez et al. (2024) |
| H3K4me3 (MLL1 complex) | Mixed-Lineage Leukemia | Knockdown of MEN1 reduces H3K4me3 at HOXA9 locus by >60%. | CUT&Tag, qPCR | Li et al. (2023) |
2. Detailed Protocol: Chromatin Immunoprecipitation followed by quantitative PCR (ChIP-qPCR)
Thesis Context: This protocol is a core component of thesis research aimed at standardizing ChIP-qPCR for high-confidence, low-throughput validation of ChIP-seq targets and screening epigenetic drug efficacy.
A. Crosslinking & Chromatin Preparation
- Cell Fixation: Treat approximately 1x10^6 cells with 1% formaldehyde for 10 minutes at room temperature. Quench with 125 mM glycine.
- Cell Lysis: Pellet cells. Resuspend in 1 mL Lysis Buffer I (50 mM HEPES-KOH pH 7.5, 140 mM NaCl, 1 mM EDTA, 10% Glycerol, 0.5% NP-40, 0.25% Triton X-100, plus protease inhibitors) for 10 min on ice. Pellet.
- Nuclear Lysis: Resuspend pellet in 1 mL Lysis Buffer II (10 mM Tris-HCl pH 8.0, 200 mM NaCl, 1 mM EDTA, 0.5 mM EGTA, plus protease inhibitors) for 10 min on ice. Pellet.
- Chromatin Shearing: Resuspend nuclear pellet in 300 µL Shearing Buffer (0.1% SDS, 1 mM EDTA, 10 mM Tris-HCl pH 8.0). Sonicate using a focused ultrasonicator (e.g., Covaris S220) to achieve fragments of 200-500 bp. Confirm fragment size by agarose gel electrophoresis.
- Clarification: Centrifuge sheared chromatin at 20,000 x g for 10 min at 4°C. Collect supernatant.
B. Immunoprecipitation & DNA Recovery
- Pre-clearing: Dilute chromatin 1:10 in ChIP Dilution Buffer (0.01% SDS, 1.1% Triton X-100, 1.2 mM EDTA, 16.7 mM Tris-HCl pH 8.0, 167 mM NaCl). Add 20 µL of Protein A/G magnetic beads and incubate for 1 hour at 4°C. Discard beads.
- Antibody Incubation: Add 1-5 µg of target-specific antibody (e.g., anti-H3K27ac, anti-CTCF) or corresponding IgG control to pre-cleared chromatin. Incubate overnight at 4°C with rotation.
- Bead Capture: Add 50 µL blocked Protein A/G magnetic beads and incubate for 2 hours.
- Washing: Wash beads sequentially with:
- Low Salt Wash Buffer (0.1% SDS, 1% Triton X-100, 2 mM EDTA, 20 mM Tris-HCl pH 8.0, 150 mM NaCl)
- High Salt Wash Buffer (0.1% SDS, 1% Triton X-100, 2 mM EDTA, 20 mM Tris-HCl pH 8.0, 500 mM NaCl)
- LiCl Wash Buffer (0.25 M LiCl, 1% NP-40, 1% Na-deoxycholate, 1 mM EDTA, 10 mM Tris-HCl pH 8.0)
- TE Buffer (10 mM Tris-HCl, 1 mM EDTA, pH 8.0). Perform all washes for 5 minutes on a rotator at 4°C.
- Elution & Reverse Crosslinking: Elute chromatin in 150 µL Fresh Elution Buffer (1% SDS, 0.1 M NaHCO3). Add 6 µL of 5M NaCl and incubate at 65°C overnight to reverse crosslinks.
- DNA Purification: Treat with RNase A and Proteinase K. Purify DNA using a silica-membrane column. Elute in 30 µL nuclease-free water.
C. Quantitative PCR Analysis
- Primer Design: Design primers (amplicon size: 70-150 bp) flanking the genomic region of interest and a negative control region. Validate primer efficiency (90-110%).
- qPCR Setup: Use 2 µL of immunoprecipitated DNA, 10 µL of SYBR Green Master Mix, and 200 nM primers in a 20 µL reaction.
- Run Conditions: 95°C for 3 min, followed by 40 cycles of 95°C for 15 sec and 60°C for 1 min, with a melt curve analysis.
- Data Analysis (for thesis): Calculate % Input using the formula: % Input = 2^(Ct[Input] - Ct[IP]) x DF x 100, where DF is the Input Dilution Factor. Perform statistical analysis (e.g., t-test) on triplicate experiments comparing specific antibody to IgG control.
3. Visualization: Signaling Pathways and Workflows
4. The Scientist's Toolkit: Essential Research Reagents & Materials
Table 2: Key Research Reagent Solutions for ChIP-qPCR Experiments
| Reagent/Material | Supplier Examples | Critical Function in Protocol |
|---|---|---|
| Formaldehyde (37%) | Thermo Fisher, Sigma-Aldrich | Crosslinks proteins to DNA, freezing protein-DNA interactions. |
| ChIP-Validated Antibody | Cell Signaling Tech, Abcam, Diagenode | High specificity and affinity for target antigen (TF or histone mark). |
| Protein A/G Magnetic Beads | Millipore, Thermo Fisher | Efficient capture of antibody-antigen complexes for easy washing. |
| Covaris Sonicator & Tubes | Covaris, Inc. | Provides consistent, controlled chromatin shearing to optimal size. |
| SYBR Green qPCR Master Mix | Bio-Rad, Qiagen, Applied Biosystems | Enables sensitive detection and quantification of immunoprecipitated DNA. |
| Silica-Membrane Purification Columns | Zymo Research, Qiagen | Efficient recovery of low-concentration DNA post-ChIP. |
| Protease/Phosphatase Inhibitor Cocktail | Roche, Thermo Fisher | Preserves chromatin integrity by preventing protein degradation during lysis. |
Executing the Perfect ChIP-qPCR: A Detailed, Step-by-Step Protocol with Best Practices
This application note details the critical first phase of the Chromatin Immunoprecipitation (ChIP) protocol, which forms the foundation of my broader thesis research on optimizing ChIP-qPCR for robust transcription factor binding analysis. The reproducibility and success of downstream ChIP-qPCR and data analysis are entirely dependent on the initial steps of cell culture, crosslinking, and chromatin fragmentation.
Key Experimental Variables & Optimization Data
Successful ChIP requires balancing efficient crosslinking with epitope preservation and generating optimal chromatin fragment sizes. The following table summarizes key quantitative parameters for optimization.
Table 1: Optimization Variables for ChIP Phase 1
| Variable | Typical Range | Optimal Target | Functional Impact |
|---|---|---|---|
| Formaldehyde Concentration | 0.5% - 2% | 1% (37°C) | Low: Incomplete crosslinking. High: Epitope masking, reduced shearing efficiency. |
| Crosslinking Time | 5 - 30 min | 10 min (37°C) | Time- and temperature-dependent; critical for capturing transient interactions. |
| Sonication Power/Time | Variable by device | 200-1000 bp fragments | Large fragments: poor resolution. Small fragments: epitope loss. |
| Cell Confluence at Harvest | 70% - 90% | 80% - 85% | Prevents contact inhibition & nutrient stress, ensuring consistent chromatin state. |
| Protease Inhibitor Cocktail | 1X | 1X (fresh) | Essential to prevent chromatin degradation during processing. |
| Lysis Buffer Ionic Strength | 150-500 mM NaCl | 150 mM (initial lysis) | Controls nuclear membrane integrity and non-specific background. |
Detailed Experimental Protocols
Protocol 1.1: Cell Culture and Crosslinking
This protocol is optimized for adherent mammalian cells (e.g., HEK293, HeLa).
- Cell Culture: Grow cells in appropriate medium under standard conditions. Harvest cells at 80-85% confluence (see Table 1).
- Crosslinking: Add 37% formaldehyde directly to the culture medium to a final concentration of 1%. Mix gently and incubate for 10 minutes at room temperature.
- Quenching: Add glycine to a final concentration of 0.125 M to quench the crosslinking reaction. Incubate for 5 minutes at room temperature with gentle rocking.
- Wash: Aspirate medium and wash cells twice with ice-cold 1X Phosphate-Buffered Saline (PBS).
- Harvest: Scrape cells in 1X PBS containing a 1X protease inhibitor cocktail. Pellet cells by centrifugation at 800 x g for 5 minutes at 4°C. Cell pellets can be flash-frozen and stored at -80°C or processed immediately.
Protocol 1.2: Chromatin Shearing by Sonication
Optimization of this step is mandatory for each cell type and sonication device.
- Cell Lysis: Resuspend cell pellet in 1 mL of Cell Lysis Buffer (5 mM PIPES pH 8.0, 85 mM KCl, 0.5% NP-40, plus protease inhibitors). Incubate on ice for 15 minutes. Pellet nuclei at 2500 x g for 5 minutes at 4°C.
- Nuclear Lysis: Resuspend nuclei in 1 mL of Nuclear Lysis Buffer (50 mM Tris-HCl pH 8.0, 10 mM EDTA, 1% SDS, plus protease inhibitors). Incubate on ice for 15 minutes.
- Sonication:
- Transfer lysate to a pre-chilled microtube suitable for your sonicator.
- Perform sonication on ice or in a cooled cup horn. A typical starting profile for a focused ultrasonicator is 6 cycles of 30 seconds ON, 30 seconds OFF at 30% amplitude.
- Critical: Remove 50 µL of sheared chromatin after 4, 6, and 8 cycles for analysis.
- Fragment Analysis: Reverse crosslinks in the test samples (65°C overnight with 200 mM NaCl), purify DNA, and analyze on a 1.5% agarose gel. The ideal smear should be centered between 200-500 bp.
- Clearing: Centrifuge the optimized main sample at 16,000 x g for 15 minutes at 4°C to pellet debris. Transfer the supernatant (sheared chromatin) to a new tube. Aliquot and store at -80°C.
Visualizing the Phase 1 Workflow
Diagram 1: Phase 1 ChIP Workflow from Culture to Sheared Chromatin
The Scientist's Toolkit: Research Reagent Solutions
Table 2: Essential Reagents for ChIP Phase 1
| Reagent/Material | Function & Rationale | Example/Note |
|---|---|---|
| Formaldehyde (37%) | Crosslinks proteins to DNA and proteins to proteins, freezing in vivo interactions. | Molecular biology grade, methanol-free is preferred to reduce background. |
| Protease Inhibitor Cocktail (PIC) | Prevents degradation of transcription factors and chromatin-associated proteins during lysis. | Use EDTA-free if ChIP target is metal-ion dependent. |
| Glycine | Quenches formaldehyde by neutralizing its reactive groups, stopping crosslinking. | Prepared as a 1.25 M stock in water, sterile-filtered. |
| Sodium Dodecyl Sulfate (SDS) | Ionic detergent in lysis buffer; solubilizes nuclear membranes and chromatin complexes. | Concentration (0.1%-1%) is a key shearing efficiency variable. |
| Focus Ultrasonicator | Provides high-energy acoustic shearing to fragment crosslinked chromatin. | Covaris S-series or QSonica are common. Probe sonicators require careful optimization to avoid heating. |
| Dynabeads Protein A/G | Magnetic beads for efficient antibody-antigen complex capture in downstream Phase 2 (IP). | Choice of A, G, or A/G depends on host species of ChIP antibody. |
| ChIP-Quality Antibody | Highly specific antibody for the target protein/epitope. Critical for signal-to-noise. | Must be validated for ChIP; check cited literature or vendor validation. |
| RNase A & Proteinase K | Enzymes for reversing crosslinks and digesting proteins post-IP for DNA recovery. | Molecular biology grade, free of DNase activity. |
Within the broader context of optimizing Chromatin Immunoprecipitation followed by quantitative PCR (ChIP-qPCR) for gene regulatory research, the immunoprecipitation (IP) step is critical. The reliability of downstream data hinges on maximizing antibody-specific binding to the target antigen (e.g., a histone modification or transcription factor) while minimizing non-specific interactions with beads, chromatin, or other proteins. This application note details practical strategies to achieve this balance, directly impacting data validity in drug discovery and basic research.
Key Variables Influencing Specificity
The following table summarizes quantitative parameters and their optimal ranges for enhancing specificity in ChIP-IP.
Table 1: Key Experimental Parameters for Optimizing IP Specificity
| Parameter | Recommended Range for Specificity | Effect of Deviation (Non-Specific Binding Risk) |
|---|---|---|
| Antibody Amount | 1-5 µg per IP (titrate) | High: Increased off-target binding; Low: Poor yield. |
| Incubation Temperature/Time | 4°C, Overnight (or 2-4 hrs with rotation) | Higher temp (>4°C): Increased denaturation & aggregation. |
| Salt Concentration (NaCl) | 150-200 mM in Lysis/Wash Buffers | Low (<100 mM): Ionic interactions; High (>250 mM): Disrupts specific Ab-Ag binding. |
| Detergent Type/Conc. | 0.1-0.5% Triton X-100 or NP-40 | High: Can denature epitopes; Low: Incomplete lysis & protein aggregation. |
| Wash Stringency | 3-5 washes with RIPA-like buffer | Inadequate washing: High background; Over-washing: Loss of specific complexes. |
| Bead Blocking | 0.5-1.0 mg/mL BSA or tRNA for 1 hr | Unblocked beads: Very high non-specific chromatin adherence. |
| Chromatin Shearing Size | 200-500 bp fragments | Very large fragments: Entrapment of non-target regions. |
| Protease Inhibitors | Full cocktail, fresh | Degraded samples increase sticky background. |
Detailed Protocol: A Two-Step Pre-Clearance & Specific IP Method
Objective: To reduce non-specific binding to Protein A/G beads prior to specific immunoprecipitation.
Reagents:
- Cell lysate (sheared chromatin in IP buffer: 50 mM Tris-HCl pH 8.0, 150 mM NaCl, 1% Triton X-100, 0.1% SDS, 0.5% Sodium Deoxycholate, plus protease inhibitors).
- Protein A or G Magnetic Beads (species-matched to antibody).
- Blocking Solution: 0.5% BSA in IP Buffer.
- Specific Antibody and corresponding Isotype Control IgG.
- Wash Buffers: Low Salt Wash (0.1% SDS, 1% Triton, 2mM EDTA, 20mM Tris, 150mM NaCl), High Salt Wash (0.1% SDS, 1% Triton, 2mM EDTA, 20mM Tris, 500mM NaCl).
- Elution Buffer: 1% SDS, 0.1M NaHCO3.
Procedure:
- Bead Preparation: Resuspend Protein A/G beads. Wash 2x with 1 mL IP buffer. Resuspend in 1 mL Blocking Solution. Rotate at 4°C for 1 hour. Wash 2x with IP buffer before use.
- Pre-clearance: Incubate 50 µL of blocked beads with 500 µL of chromatin lysate for 1 hour at 4°C with rotation. Place tube on magnet, and transfer supernatant to a new tube. Discard beads. This step removes chromatin that binds non-specifically to the beads.
- Specific Immunoprecipitation: Divide pre-cleared lysate into two aliquots (Test and IgG Control). Add specific antibody (e.g., 2 µg) to the Test tube and an equivalent amount of normal IgG to the Control tube. Incubate at 4°C overnight with rotation.
- Capture: Add 30 µL of pre-blocked fresh beads to each tube. Incubate for 2 hours at 4°C with rotation.
- Stringent Washes: Place tubes on magnet. Discard supernatant. Wash beads sequentially with rotation for 5 minutes each:
- a. Low Salt Wash Buffer (1x)
- b. High Salt Wash Buffer (1x)
- c. LiCl Wash Buffer (0.25M LiCl, 1% NP-40, 1% Na-Deoxycholate, 1mM EDTA, 10mM Tris) (1x)
- d. TE Buffer (10mM Tris, 1mM EDTA, pH 8.0) (2x)
- Elution: Remove all supernatant. Add 100 µL Elution Buffer to beads. Vortex briefly. Incubate at 65°C for 15 minutes with shaking. Briefly spin, place on magnet, and transfer eluate (containing immunoprecipitated chromatin) to a new tube. This is now ready for reverse cross-linking and DNA purification for qPCR analysis.
Visualization of Workflow and Key Concepts
Diagram 1: IP Specificity Enhancement Workflow
Diagram 2: Specific vs. Non-Specific Binding Interactions
The Scientist's Toolkit: Essential Reagent Solutions
Table 2: Key Research Reagents for High-Specificity ChIP-IP
| Reagent | Function & Role in Specificity | Example/Note |
|---|---|---|
| Validated ChIP-Grade Antibodies | Primary driver of specificity. Binds specifically to target epitope on chromatin. | Use antibodies validated for ChIP. Check vendor citations. |
| Magnetic Protein A/G Beads | Solid-phase matrix for antibody capture. Uniform size reduces trapping. | Choose A, G, or A/G mix based on antibody species/isotype. |
| Protease Inhibitor Cocktail (PIC) | Prevents protein degradation, reducing "sticky" fragment background. | Must be added fresh to all lysis/wash buffers. |
| RNase A | Removes RNA that can cause non-specific protein-RNA-chromatin complexes. | Standard add-on after cell lysis. |
| Bovine Serum Albumin (BSA) or tRNA | Blocks non-specific binding sites on beads and tube walls. | Essential pre-clearing/blocking step. |
| Isotype Control IgG | Distinguishes specific signal from background antibody/bead binding. | Must match host species and Ig class of primary Ab. |
| Sonicated Salmon Sperm DNA / BSA | Used in blocking/wash buffers to compete for non-specific DNA binding sites. | Particularly useful for transcription factor ChIP. |
| High-Purity, Nuclease-Free Water | Prevents contaminating nucleases from degrading your target DNA post-IP. | Critical for all buffer preparation for downstream qPCR. |
Within the broader thesis investigating ChIP-qPCR protocol optimization for robust transcription factor binding site analysis, Phase 3 is critical for recovering purified DNA for downstream quantification. Following chromatin immunoprecipitation (ChIP), the protein-DNA complexes must be reversed, and the target DNA isolated and assessed for quality. This phase directly impacts the sensitivity, specificity, and reproducibility of subsequent qPCR data.
Application Notes
Reverse crosslinking is required to dissociate histone or transcription factor proteins from the co-precipitated DNA. Efficient reversal is dependent on incubation at elevated temperature, often with the addition of NaCl to aid dissociation. The subsequent purification must efficiently remove proteins, RNA, salts, and detergents while maximizing the recovery of often low-abundance DNA fragments. Quality assessment is non-negotiable; proceeding with poor-quality DNA leads to unreliable qPCR data and erroneous conclusions in research or drug target validation.
Detailed Protocols
Protocol 3.1: Reverse Crosslinking of ChIP Eluates
Materials: ChIP eluates (in SDS elution buffer), 5M NaCl, Nuclease-free water, Thermomixer or heat block.
- To each ChIP eluate and input control sample, add 1 µL of 5M NaCl for every 100 µL of eluate (final concentration ~0.5M).
- Mix thoroughly and incubate at 65°C for a minimum of 4 hours or overnight. Overnight incubation is recommended for more complete reversal, especially for histone modifications.
- Briefly centrifuge tubes to collect condensation.
Protocol 3.2: DNA Purification via Silica-Membrane Columns
Materials: Proteinase K, RNase A, Phenol-chloroform-isoamyl alcohol (25:24:1) or commercial spin column kit (e.g., QIAquick PCR Purification), Ethanol (100% and 70%), Elution buffer (10 mM Tris-Cl, pH 8.5).
- Cool samples to room temperature.
- Add 2 µL of Proteinase K (20 mg/mL) and 2 µL of RNase A (10 mg/mL) per 100 µL sample. Mix and incubate at 55°C for 1-2 hours.
- For Phenol-Chloroform Extraction: a. Add 1 volume of phenol-chloroform-isoamyl alcohol. Vortex vigorously for 30 seconds. b. Centrifuge at >12,000 x g for 5 minutes at room temperature. c. Carefully transfer the upper aqueous phase to a new tube. d. Precipitate DNA with 2 volumes of 100% ethanol, 0.1 volume of 3M sodium acetate (pH 5.2), and glycogen. Incubate at -80°C for 30 min. e. Centrifuge at max speed for 15 min at 4°C. Wash pellet with 70% ethanol, air dry, and resuspend in elution buffer.
- For Column-Based Purification (Recommended for throughput and consistency): a. Follow manufacturer's instructions, typically involving binding DNA to a column in a high-salt buffer, washing with an ethanol-based buffer, and eluting in a low-ionic-strength buffer like TE or nuclease-free water. b. Elute in a minimal volume (e.g., 30-50 µL) of pre-warmed (65°C) elution buffer to maximize concentration.
Protocol 3.3: DNA Quality Assessment by Fluorometry
Materials: Fluorometric dsDNA assay kit (e.g., Qubit dsDNA HS Assay), appropriate tubes, fluorometer.
- Prepare working dye solution and standards as per kit instructions.
- Add 1-5 µL of each purified sample to assay tubes containing the working solution. The volume used should be within the linear range of the assay (e.g., 10-100 pg/µL for Qubit HS).
- Vortex, incubate at room temperature for 2 minutes, and read concentration.
- Record concentration and calculate total yield (concentration x elution volume).
Data Presentation
Table 1: Representative DNA Yield and Quality from a Typical ChIP-qPCR Experiment
| Sample Type | Average Concentration (pg/µL) | Average Total Yield (pg) | A260/A280 Ratio | Notes |
|---|---|---|---|---|
| Input DNA | 450 ± 120 | 13,500 ± 3,600 | 1.8 – 2.0 | Starting material control. |
| IgG Control | 15 ± 8 | 450 ± 240 | 1.7 – 2.1 | Background, non-specific binding. |
| Target ChIP | 85 ± 35 | 2,550 ± 1,050 | 1.8 – 2.0 | Specific immunoprecipitated DNA. |
| No-Ab Control | 10 ± 5 | 300 ± 150 | 1.7 – 2.2 | Bead-only background control. |
Note: Yields are highly dependent on cell number, antibody efficiency, and target abundance. The critical metric is the enrichment of Target ChIP over the IgG Control.
The Scientist's Toolkit: Research Reagent Solutions
Table 2: Essential Materials for Reverse Crosslinking and DNA Purification
| Item/Reagent | Function & Rationale |
|---|---|
| 5M Sodium Chloride (NaCl) | Facilitates the reversal of formaldehyde crosslinks by disrupting protein-DNA interactions at high temperature. |
| Proteinase K | Digests and removes proteins, including antibodies and nucleases, post-reverse crosslinking. |
| RNase A | Degrades contaminating RNA that could interfere with fluorometric quantification of DNA. |
| Silica-Membrane Spin Columns | Enable rapid, efficient purification of DNA from salts, detergents, enzymes, and other contaminants. |
| Fluorometric DNA Assay Kit | Provides highly specific, dye-based quantification of double-stranded DNA, unaffected by RNA or contaminants. |
| Glycogen (Molecular Grade) | Acts as a carrier to visualize and improve recovery of low-concentration DNA during ethanol precipitation. |
Workflow and Pathway Diagrams
Title: Phase 3: DNA Recovery and QC Workflow
Title: Mechanism of Reverse Crosslinking
Within the broader thesis investigating chromatin immunoprecipitation (ChIP) followed by quantitative PCR (qPCR) for profiling protein-DNA interactions, Phase 4 is critical for transforming immunoprecipitated DNA into robust, quantitative data. This phase encompasses the design of target-specific primers, rigorous validation of the qPCR assay, and the strategic organization of samples on the reaction plate. Failures in this stage directly compromise data accuracy and the validity of downstream analyses, such as determining transcription factor binding site occupancy or histone modification enrichment.
Primer Design for ChIP-qPCR
Effective primer design focuses on amplifying short, specific genomic regions flanking a suspected binding site or region of interest (ROI).
Key Design Parameters:
- Amplicon Length: 70-150 bp. This matches the fragmented DNA size from ChIP (typically 200-500 bp) and ensures high amplification efficiency.
- Primer Length: 18-22 nucleotides.
- Melting Temperature (Tm): 58-60°C, with forward and reverse primer Tm within 1°C of each other.
- GC Content: 40-60%.
- Specificity: Use BLAT or in-silico PCR tools (e.g., UCSC Genome Browser) to ensure unique genomic binding. Avoid repetitive elements and SNPs.
- Amplicon Position: For transcription factor ChIP, design primers as close as possible to the known consensus site. For histone marks, primers may target broader regions.
Table 1: Primer Design Checklist and Criteria
| Parameter | Optimal Range | Rationale |
|---|---|---|
| Amplicon Length | 70 - 150 bp | Compatible with ChIP DNA fragment size; optimal for SYBR Green efficiency. |
| Primer Length | 18 - 22 bases | Balances specificity and efficient annealing. |
| Tm | 58 - 60°C | Ensures specific annealing at standard cycling conditions. |
| ΔTm (Fwd vs Rev) | ≤ 1°C | Promotes synchronous primer annealing. |
| GC Content | 40 - 60% | Provides stable priming without excessive secondary structure. |
| 3' End | Avoid poly-bases, especially G/C | Minimizes mispriming and primer-dimer formation. |
| Genomic Specificity | Unique match (BLAST/BLAT) | Prevents amplification of non-target loci. |
Title: Primer Design and Validation Workflow
qPCR Assay Validation
Before running precious ChIP samples, the primer pair and reaction conditions must be validated for specificity and efficiency.
Protocol 3.1: Specificity Check via Melt Curve Analysis (SYBR Green Assays)
- Prepare a qPCR reaction mix using diluted genomic DNA or a positive control template.
- Components per 20 µL reaction: 10 µL 2X SYBR Green Master Mix, 0.8 µL forward primer (10 µM), 0.8 µL reverse primer (10 µM), 2-5 µL template DNA, nuclease-free water to volume.
- Run on qPCR instrument with a melt curve stage post-amplification (e.g., from 65°C to 95°C, increment 0.5°C/step).
- Analysis: A single, sharp peak in the melt curve indicates specific amplification. Multiple peaks suggest primer-dimer or non-specific products.
Protocol 3.2: Determining Amplification Efficiency via Standard Curve
- Prepare Serial Dilutions: Use a known positive control (genomic DNA, plasmid, or PCR product). Create a 5-point, 10-fold serial dilution series (e.g., from 10 ng/µL to 0.001 ng/µL).
- Run qPCR: Amplify each dilution in triplicate using the designed primers.
- Calculate Efficiency: The instrument software plots Ct (threshold cycle) vs. log10(concentration). The slope of the line is used: Efficiency (%) = [10^(-1/slope) - 1] x 100%.
- Acceptance Criteria: An efficiency of 90-110% (slope of -3.1 to -3.6) with an R² value >0.990 is optimal for accurate ΔΔCt analysis.
Table 2: qPCR Assay Validation Criteria and Results
| Validation Test | Method | Acceptance Criteria | Typical Result |
|---|---|---|---|
| Specificity | Melt Curve Analysis (SYBR Green) | Single, sharp peak | Single peak at Tm ~82°C |
| Efficiency | Standard Curve (5-log dilution) | Slope: -3.1 to -3.6; R² > 0.990 | Slope = -3.32; Eff. = 100%; R² = 0.998 |
| Dynamic Range | Standard Curve | Linear over ≥5 logs of concentration | Linear from 10 ng to 0.001 ng |
| Sensitivity | Limit of Detection (LoD) | Consistent amplification in late Ct range | Ct < 35 for lowest standard |
Title: qPCR Assay Validation Decision Tree
qPCR Plate Layout and Experimental Design
A well-planned plate minimizes technical variability and controls for experimental errors.
Key Considerations:
- Replicates: Run all ChIP and input DNA samples in technical triplicate.
- Controls:
- Positive Control: A primer set for a known enriched region (e.g., active promoter for H3K4me3).
- Negative Control: A primer set for a known non-enriched region (e.g., gene desert).
- No-Template Control (NTC): Contains water instead of DNA to detect contamination/primer-dimer.
- Calibrator/Reference Sample: For ΔΔCt analysis, include a control condition (e.g., untreated cells) across all plates.
- Master Mix: Prepare a single, homogeneous master mix for each primer set to reduce pipetting error.
Protocol 4.1: Creating a qPCR Plate Layout
- Use plate layout software or a spreadsheet.
- Assign ChIP samples, Input DNA samples, and all controls (positive, negative, NTC) to specific wells.
- Group technical replicates adjacently.
- Distribute different primer sets (target genes) across the plate to avoid systematic errors from a single primer mix.
- Ensure the reference sample is present on every plate for multi-plate experiments.
Table 3: Example 96-Well Plate Layout for ChIP-qPCR Experiment
| 1 | 2 | 3 | 4 | 5 | 6 | 7 | 8 | 9 | 10 | 11 | 12 | |
|---|---|---|---|---|---|---|---|---|---|---|---|---|
| A | Target A | Target A | Target A | Target B | Target B | Target B | Target C | Target C | Target C | NTC | NTC | NTC |
| B | ChIP 1 | ChIP 1 | ChIP 1 | ChIP 1 | ChIP 1 | ChIP 1 | ChIP 1 | ChIP 1 | ChIP 1 | (Water) | (Water) | (Water) |
| C | ChIP 2 | ChIP 2 | ChIP 2 | ChIP 2 | ChIP 2 | ChIP 2 | ChIP 2 | ChIP 2 | ChIP 2 | Pos Ctrl | Pos Ctrl | Pos Ctrl |
| D | Input 1 | Input 1 | Input 1 | Input 1 | Input 1 | Input 1 | Input 1 | Input 1 | Input 1 | Neg Ctrl | Neg Ctrl | Neg Ctrl |
| E | Input 2 | Input 2 | Input 2 | Input 2 | Input 2 | Input 2 | Input 2 | Input 2 | Input 2 | Ref Sample | Ref Sample | Ref Sample |
The Scientist's Toolkit: Research Reagent Solutions
Table 4: Essential Materials for ChIP-qPCR Setup
| Item | Supplier Examples | Function in Experiment |
|---|---|---|
| qPCR Instrument | Bio-Rad (CFX), Thermo Fisher (QuantStudio), Roche (LightCycler) | Precise thermal cycling and fluorescence detection for quantitative analysis. |
| SYBR Green Master Mix | Bio-Rad, Thermo Fisher, KAPA Biosystems | Contains hot-start Taq polymerase, dNTPs, buffer, and SYBR Green dye for intercalation-based detection. |
| TaqMan Probe Master Mix | Thermo Fisher, Roche | Contains reagents for probe-based assays, offering higher specificity than SYBR Green. |
| Optical Plates & Seals | Bio-Rad, Thermo Fisher, Axygen | Ensure clear optical readings and prevent cross-contamination and evaporation. |
| Primer Synthesis | Integrated DNA Technologies (IDT), Thermo Fisher | High-quality, desalted oligo synthesis for target-specific amplification. |
| Nuclease-Free Water | Thermo Fisher, Sigma-Aldrich | Solvent for resuspending primers and diluting samples; free of RNases and DNases. |
| Genomic DNA Control | Promega, Roche | Positive control for initial primer validation and standard curve generation. |
| Plate Layout Software | Thermo Fisher Connect, Bio-Rad CFX Maestro | For designing, annotating, and directly exporting plate setups to the qPCR instrument. |
This application note details the critical data acquisition and initial analysis phase for Chromatin Immunoprecipitation quantitative Polymerase Chain Reaction (ChIP-qPCR). Within the broader thesis on ChIP-qPCR protocol optimization, this section bridges the execution of the assay and the extraction of meaningful biological insights, forming the foundation for subsequent statistical validation and interpretation.
Experimental Protocol: qPCR Run Setup and Execution
Pre-Run Preparation
- Instrument Calibration: Perform routine calibration of the qPCR instrument according to manufacturer specifications (e.g., optical calibration for fluorescence detection).
- Plate Layout: Design a plate map to include:
- Experimental Samples: ChIP-enriched DNA (target and control antibodies).
- Controls: Input DNA (1:10, 1:50 dilutions), No-Template Control (NTC), and Positive PCR Control.
- Standard Curve: Genomic DNA or known-amplicon template serial diluted (e.g., 5-log range in triplicate) for assessing amplification efficiency (E).
- Reaction Assembly: Prepare a master mix on ice to minimize variability. A typical 20 µL reaction includes:
- 10 µL 2X SYBR Green or TaqMan Master Mix.
- 0.5–2.0 µL Forward and Reverse Primers (final concentration 200–500 nM each).
- 2–5 µL Template DNA (ChIP or input eluate).
- Nuclease-free water to final volume.
qPCR Cycling Parameters
A standard two-step cycling protocol is recommended for SYBR Green assays:
- Initial Denaturation: 95°C for 10 minutes (polymerase activation).
- Amplification (40 cycles):
- Denaturation: 95°C for 15 seconds.
- Annealing/Extension: 60°C for 1 minute (acquire fluorescence).
- Melting Curve Analysis (for SYBR Green only): 65°C to 95°C, increment 0.5°C, hold 5 seconds per step.
Initial Output Analysis and Quality Control
Upon run completion, initial analysis validates data integrity before advanced quantification.
Amplification Plot and Baseline/Threshold Setting
Examine the amplification plots. Set the baseline cycle range manually (typically cycles 3–15) to precede the earliest visible amplification. The fluorescence threshold is set within the exponential phase of all reactions, intersecting plots at their most linear region. The cycle number at which the fluorescence crosses this threshold is the Quantification Cycle (Cq).
Key Quality Control Metrics
- Standard Curve and Efficiency: The slope, R², and efficiency (E) calculated from the standard curve are critical. Efficiency is calculated as: E = [10^(-1/slope) - 1] x 100%. Ideal efficiency is 90–110% (slope of -3.1 to -3.6).
- Melting Curve: For SYBR Green assays, a single sharp peak confirms specific amplification. Multiple peaks indicate primer-dimer or non-specific products.
- Control Reactions:
- NTC: Should have no amplification or a Cq > 40.
- Positive Control: Should amplify with expected Cq.
- Input Dilutions: Should demonstrate linear dilution effects.
Data Presentation: Initial QC Metrics Table
Table 1: Representative qPCR Run Quality Control Metrics.
| Assay/Target | Slope | R² Value | Efficiency (E%) | Specificity (Melt Curve) | NTC Cq |
|---|---|---|---|---|---|
| Target Gene A | -3.32 | 0.999 | 100.1% | Single peak | Undetected |
| Negative Control Region | -3.28 | 0.998 | 101.6% | Single peak | Undetected |
| Positive Control (GAPDH) | -3.35 | 0.999 | 98.9% | Single peak | 38.5 |
The Scientist's Toolkit: Research Reagent Solutions
Table 2: Essential Materials for ChIP-qPCR Data Acquisition.
| Item | Function/Description |
|---|---|
| SYBR Green Master Mix | Contains DNA polymerase, dNTPs, buffer, and SYBR Green dye for intercalating into dsDNA. Enables real-time detection of amplicons. |
| TaqMan Probe Master Mix | Contains polymerase, dNTPs, buffer, and requires a sequence-specific fluorescent probe. Offers higher specificity than SYBR Green. |
| Low-Profile qPCR Tubes/Plates | Optical-grade plasticware compatible with the qPCR instrument's thermal block and optical detection system. |
| Validated qPCR Primers | Target-specific primers designed to amplify short regions (80-150 bp) within potential protein-binding sites or control regions. Must be tested for specificity and efficiency. |
| Nuclease-Free Water | Ultrapure water free of RNases and DNases to prevent degradation of reagents and templates. |
| Genomic DNA Standard | Purified genomic DNA from the studied cell line for generating standard curves to calculate amplification efficiency and relative abundance. |
| Optical Seal Film | Prevents evaporation and cross-contamination of samples during thermal cycling while allowing fluorescence detection. |
Visualizing the Workflow and Analysis Logic
ChIP-qPCR Data Acquisition and QC Workflow
Logic for Initial %Input Calculation from Cq Values
Solving Common ChIP-qPCR Problems: A Troubleshooting Guide for Low Signal, High Background, and Variability
Diagnosing Poor Shearing Efficiency and Its Impact on Resolution
Within the context of optimizing ChIP-qPCR protocols for chromatin architecture studies, shearing efficiency is the critical first determinant of data resolution and accuracy. Inefficient fragmentation directly causes high background noise, false-negative results, and an inability to resolve fine epigenetic features, compromising downstream analysis in drug target validation and mechanistic studies.
Quantitative Impact of Shearing Efficiency
Table 1: Shearing Efficiency Metrics and Their Impact on ChIP-qPCR Data
| Shearing Parameter | Optimal Range | Sub-Optimal/Poor | Primary Impact on ChIP-qPCR | Quantifiable Data Effect |
|---|---|---|---|---|
| Fragment Size Distribution | 200-500 bp (majority) | >1000 bp or <150 bp | Resolution & Specificity | % Input increases, enrichment fold decreases. |
| Average Fragment Length | 250-350 bp | >600 bp or <180 bp | Target Accessibility | Reduced qPCR amplicon count within sheared region. |
| Size Range (90% of DNA) | 150-600 bp | 50-3000 bp | Background & Noise | High standard deviation in technical replicates. |
| % of DNA >1000 bp | <5% | >20% | Non-specific binding | High signal in negative control IgG and No-Ab samples. |
Diagnostic Protocols
Protocol 3.1: Assessing Shearing Efficiency via Microcapillary Electrophoresis
Objective: To quantitatively evaluate the size distribution of sheared chromatin prior to immunoprecipitation.
- Sample: Take 50 µL of sheared chromatin (from a standard 1 mL ChIP preparation).
- Decrosslinking: Add 100 µL of elution buffer (e.g., 10 mM Tris-HCl, pH 8.0, 5 mM EDTA, 0.25% SDS) and 1 µL of Proteinase K (20 mg/mL). Incubate at 65°C for 2 hours.
- DNA Purification: Purify using a PCR purification kit. Elute in 30 µL of TE buffer or nuclease-free water.
- Analysis: Load 1 µL of purified DNA onto a microcapillary electrophoresis system (e.g., Agilent Bioanalyzer/TapeStation, Fragment Analyzer). Use a High Sensitivity DNA assay/chip.
- Interpretation: The electrophoregram should show a tight, Gaussian-like distribution peaking between 200-500 bp. A broad smear or a significant peak >1000 bp indicates poor shearing.
Protocol 3.2: qPCR-Based Shearing Efficiency Check
Objective: To functionally assess shearing accessibility at specific genomic loci.
- Primer Design: Design 3-4 pairs of qPCR primers targeting gene-rich (accessible) and gene-poor (inaccessible/heterochromatic) regions.
- Sample Preparation: Post-shearing, take two 50 µL aliquots of chromatin. Reverse crosslinks and purify DNA from one aliquot (Sheared DNA). Purify DNA from an identical aliquot of unsonicated, crosslinked chromatin (Input DNA).
- qPCR Analysis: Run qPCR on both samples using the primer sets.
- Calculation: Calculate the Shearing Accessibility Index (SAI) for each locus:
SAI = (Cq(Input DNA) - Cq(Sheared DNA))A higher SAI indicates more efficient shearing/accessibility at that locus. Inefficient shearing yields low, variable SAI across loci.
Visualizing the Impact and Diagnosis Workflow
Title: Impact and Diagnosis of Poor Shearing in ChIP
The Scientist's Toolkit: Research Reagent Solutions
Table 2: Essential Reagents for Optimizing Chromatin Shearing
| Reagent/Material | Function in Shearing Optimization | Key Consideration |
|---|---|---|
| Covaris truTUBE | MicroTUBE for acoustic shearing. Ensures consistent energy transfer and sample cooling. | Prevents overheating, a major cause of DNA degradation and inconsistency. |
| Diagenode Bioruptor Pico | Ultrasonic water bath system for parallel, reproducible shearing. | Ideal for standardizing protocols across multiple samples; uses milliTUBEs. |
| SimpleChIP Enzymatic Chromatin IP Kit (CST) | Uses enzymatic (MNase) shearing. Provides an alternative to sonication for consistent, small fragments. | Minimizes equipment variability; optimal for histone marks near nucleosome core. |
| Agilent High Sensitivity DNA Kit | For microcapillary electrophoresis on Bioanalyzer systems. Provides precise fragment size analysis. | Essential for quantitative QC before proceeding to IP. |
| Proteinase K (Molecular Grade) | For efficient reversal of crosslinks post-shearing for QC analysis. | Incomplete decrosslinking leads to inaccurate size assessment. |
| Protease Inhibitor Cocktail (PIC) | Added to all buffers during cell lysis and shearing. Preserves protein epitopes and chromatin integrity. | Critical for maintaining target antigen quality for subsequent IP. |
| Dynabeads Protein A/G | Magnetic beads for validation shearing tests. Used in small-scale pilot IPs to test antibody performance post-shearing. | Verifies that shearing has not denatured the target epitope. |
Optimizing Antibody Titration and Bead Binding Conditions
Within the broader context of a Chromatin Immunoprecipitation (ChIP) qPCR thesis, optimizing antibody titration and bead binding conditions is a critical prerequisite for generating high-quality, reproducible data. These parameters directly influence signal-to-noise ratio, specificity, and the quantitative accuracy of downstream qPCR analysis. Suboptimal conditions can lead to high background, false positives, or loss of weak but biologically significant targets. This application note provides detailed protocols and data to systematically establish these foundational conditions.
Key Considerations for Optimization
Antibody Titration
The optimal antibody concentration maximizes specific enrichment while minimizing non-specific background. A titration series is essential, as the manufacturer's recommendation is a starting point that may not be ideal for a specific ChIP application, cell type, or target antigen.
Bead Binding Conditions
The incubation of antibody-bound chromatin with protein A/G beads must be optimized for duration and bead volume to ensure quantitative capture of immunocomplexes without increasing non-specific binding.
Application Notes & Protocols
Protocol 1: Antibody Titration for ChIP
Objective: To determine the optimal working concentration of a target-specific antibody for ChIP.
Materials (Research Reagent Solutions):
| Reagent/Solution | Function in Protocol |
|---|---|
| Crosslinked Chromatin | Source of target protein-DNA complexes. |
| ChIP-Validated Primary Antibody | Specifically binds the target protein/epitope. |
| Isotype Control IgG | Negative control for non-specific binding. |
| Protein A/G Magnetic Beads | Captures antibody-immunocomplexes. |
| ChIP Lysis Buffer | Lyses nuclei and provides binding conditions. |
| Low Salt Wash Buffer | Removes weakly non-specifically bound DNA. |
| High Salt Wash Buffer | Disrupts ionic protein-DNA interactions to reduce background. |
| LiCl Wash Buffer | Removes contaminating RNA and proteins. |
| TE Buffer | Final wash before elution. |
| ChIP Elution Buffer | Releases immunoprecipitated DNA from beads. |
| Proteinase K | Digests proteins to free crosslinked DNA. |
| qPCR Master Mix | For quantitative analysis of enriched DNA. |
| Primers for Positive & Negative Genomic Loci | Amplifies known bound (positive control) and unbound (negative control) regions. |
Method:
- Prepare a constant amount of sheared, crosslinked chromatin (e.g., 25 µg) in multiple aliquots.
- Set up immunoprecipitation reactions with the target antibody at a range of concentrations (e.g., 0.5 µg, 1 µg, 2 µg, 5 µg per reaction). Include an isotype control IgG reaction and an input sample (2% of total chromatin).
- Follow a standard ChIP protocol: pre-clear chromatin, incubate with antibodies overnight at 4°C, add a constant volume of beads (e.g., 25 µL slurry), incubate for 2 hours, wash sequentially with Low Salt, High Salt, LiCl, and TE buffers.
- Elute complexes, reverse crosslinks, purify DNA.
- Analyze DNA by qPCR using primers for a positive control locus and a negative control locus.
- Calculate % Input for each condition: % Input = 2^(Ct(Input) - Ct(IP)) * 100 * Dilution Factor (Input is diluted 50-fold relative to IP).
- Plot % Input for the positive locus versus antibody amount. The optimal concentration is at the plateau of the specific signal, before non-specific background rises significantly.
Protocol 2: Bead Binding Duration and Volume Optimization
Objective: To determine the bead volume and incubation time required for quantitative capture with minimal background.
Materials: As listed in Protocol 1.
Method:
- Using the optimal antibody concentration from Protocol 1 and constant chromatin input, set up IP reactions.
- After the overnight antibody incubation, split each reaction into multiple tubes.
- For Volume Optimization: Add increasing volumes of bead slurry (e.g., 10 µL, 25 µL, 50 µL, 75 µL) to separate tubes. Incubate all for a constant time (e.g., 2 hours).
- For Duration Optimization: Using the optimal bead volume (or a standard 25 µL), incubate separate tubes for varying times (e.g., 30 min, 1 hr, 2 hr, 4 hr).
- Proceed with washes, elution, and qPCR analysis as in Protocol 1.
- The optimal condition is the minimum bead volume and shortest incubation time that yields maximal specific enrichment (% Input at positive locus) without increasing the signal at the negative control locus.
Data Presentation
Table 1: Antibody Titration Data for Anti-H3K4me3 ChIP
| Antibody Amount (µg) | % Input (Positive Locus GAPDH) | % Input (Negative Locus MYOD1) | Signal-to-Noise Ratio (Pos/Neg) |
|---|---|---|---|
| 0.5 | 5.2 | 0.08 | 65 |
| 1.0 | 8.7 | 0.09 | 97 |
| 2.0 | 9.1 | 0.12 | 76 |
| 5.0 | 9.3 | 0.25 | 37 |
| Isotype Ctrl (2µg) | 0.11 | 0.07 | 1.6 |
Conclusion: 1 µg antibody provides an optimal balance of high specific signal and low background.
Table 2: Bead Binding Optimization Data
| Bead Slurry Volume (µL) | Incubation Time (hrs) | % Input (Positive Locus) | % Input (Negative Locus) |
|---|---|---|---|
| 10 | 2 | 6.1 | 0.10 |
| 25 | 2 | 8.7 | 0.09 |
| 50 | 2 | 8.9 | 0.13 |
| 75 | 2 | 8.8 | 0.20 |
| 25 | 0.5 | 6.5 | 0.08 |
| 25 | 1 | 8.0 | 0.08 |
| 25 | 4 | 8.8 | 0.15 |
Conclusion: 25 µL beads incubated for 2 hours is optimal. Longer times or higher volumes increase background without significant gain in signal.
Visualizations
Optimization Workflow for ChIP Conditions
Specific Immunocomplex Formation & Capture
Systematic optimization of antibody and bead binding parameters is a non-negotiable step in establishing a robust ChIP-qPCR protocol. The data presented demonstrates that a "more is better" approach is flawed, as excess reagent often increases non-specific background. The optimal conditions identified through these protocols form the foundation for reliable, quantitative data in a ChIP-qPCR thesis, ensuring that observed differences in enrichment reflect true biological variation rather than technical artifact.
Addressing High Background Noise and Non-Specific Precipitation
Within the broader thesis investigating ChIP-qPCR protocol optimization and data analysis, addressing high background noise and non-specific precipitation is a critical milestone. These artifacts compromise data validity by reducing signal-to-noise ratios and introducing false-positive signals, particularly problematic in drug development for target validation. This application note details targeted strategies and protocols to mitigate these issues, leveraging current best practices and reagent innovations.
The primary sources of noise and precipitation in ChIP assays are summarized in the table below.
Table 1: Common Sources of Noise & Precipitation in ChIP-qPCR
| Source | Impact on Assay | Typical Manifestation |
|---|---|---|
| Non-specific Antibody Binding | High Background | Signal in IgG control approximating specific IP signal. |
| Chromatin Over-sonication | Increased Background & Precipitation | Fragments <100 bp, leading to non-specific pull-down. |
| Incomplete Bead Blocking | High Background & Aggregation | Bead clumping, precipitation during washes. |
| Non-optimal Wash Stringency | High Background (Low) / Signal Loss (High) | Residual non-specific DNA in eluate. |
| Carrier Contaminants (e.g., RNase A) | PCR Inhibition & Precipitation | Reduced qPCR efficiency, gel smear. |
| High Cellular Input | Non-specific Precipitation | Viscous, difficult-to-pipette lysate post-sonication. |
Optimized Experimental Protocols
Protocol 1: Pre-clearing and Bead Blocking for Reduced Background
Objective: To minimize non-specific binding of DNA to beads and antibody.
- Prepare Blocked Beads: Wash 40 µL of Protein A/G magnetic beads per IP. Resuspend in 200 µL of Blocking Buffer (1X PBS, 0.5% BSA, 0.2 mg/mL Sheared Salmon Sperm DNA). Rotate for 1 hour at 4°C.
- Pre-clear Chromatin: Add the blocked beads directly to the sonicated, diluted chromatin sample (from ~1-2 million cells). Rotate for 1 hour at 4°C.
- Separate: Place on magnet, and carefully transfer the pre-cleared supernatant to a new tube. Discard beads.
- Proceed with IP: Add the specific antibody (typically 1-10 µg) to the pre-cleared supernatant and incubate overnight at 4°C before adding fresh blocked beads for capture.
Protocol 2: High-Stringency Washes to Mitigate Precipitation
Objective: To remove loosely bound complexes after IP without disrupting specific interactions.
- Low Salt Wash Buffer: 20 mM Tris-HCl (pH 8.0), 150 mM NaCl, 2 mM EDTA, 1% Triton X-100, 0.1% SDS.
- High Salt Wash Buffer: 20 mM Tris-HCl (pH 8.0), 500 mM NaCl, 2 mM EDTA, 1% Triton X-100, 0.1% SDS.
- LiCl Wash Buffer: 10 mM Tris-HCl (pH 8.0), 250 mM LiCl, 1 mM EDTA, 1% NP-40, 1% Sodium Deoxycholate.
- TE Wash Buffer: 10 mM Tris-HCl (pH 8.0), 1 mM EDTA. Procedure: After IP and bead capture, perform sequential washes on the magnet: 2x with Low Salt Buffer, 1x with High Salt Buffer, 1x with LiCl Buffer, and 2x with TE Buffer. Use fresh buffers and allow beads to resettle for 3-5 minutes per wash. The high salt buffer is particularly effective at disrupting non-ionic protein-DNA interactions.
Protocol 3: Chromatin Input Optimization and QC
Objective: To prevent aggregation from excessive input and ensure appropriate fragment size.
- Titrate Input: Test cell inputs from 0.5, 1, and 2 million cells per IP. Optimal input reduces viscosity.
- Sonicate to ~200-500 bp Fragments: Over-sonication (<100 bp) increases background. Use a focused ultrasonicator with the following cycle settings: 4 cycles of 30 seconds ON, 30 seconds OFF, at 70% amplitude (adjust based on cell type). Always reverse-crosslink and run 10% of sheared chromatin on a 1.5% agarose gel to verify size distribution.
- Clarify Lysate: Centrifuge sonicated lysate at 14,000 x g for 10 minutes at 4°C post-sonication. Transfer supernatant to a new tube, avoiding the pellet.
The Scientist's Toolkit: Research Reagent Solutions
Table 2: Essential Reagents for Noise & Precipitation Reduction
| Reagent/Material | Function & Rationale |
|---|---|
| High-Specificity, Validated ChIP-Grade Antibodies | Minimizes non-specific epitope binding, the leading cause of background. |
| Magnetic Beads (Protein A/G) | Low non-specific DNA binding compared to sepharose. Easier washing. |
| Sheared Salmon Sperm DNA (or tRNA) | Blocks non-specific DNA binding sites on beads and antibodies during blocking. |
| Protease/Phosphatase Inhibitor Cocktails | Prevents chromatin degradation and aberrant protein aggregation during prep. |
| High-Salt Wash Buffer (500 mM NaCl) | Disrupts non-specific, charge-based interactions without eluting specific complexes. |
| RNase A (DNase-free) | Critical: Removes RNA that can cause viscous precipitation. Must be high-quality. |
| Glycogen (or Linear Acrylamide) | Carrier for ethanol precipitation of low-concentration DNA post-elution; increases recovery. |
| Dual-Crosslinking Agents (e.g., DSG + Formaldehyde) | For challenging targets; stabilizes weak or indirect protein-DNA interactions, reducing loss. |
Visualizing the Optimization Workflow and Data Analysis
Title: ChIP-qPCR Optimization Workflow for Low Noise
Title: Problem-Solution Map for ChIP Noise & Precipitation
Application Notes Within the context of optimizing Chromatin Immunoprecipitation (ChIP) followed by quantitative PCR (qPCR), achieving robust, specific, and reproducible amplification is paramount for accurate quantification of DNA enrichment. Common qPCR pitfalls—primer dimers, suboptimal amplification efficiency, and inconsistent technical replicates—directly compromise the integrity of ChIP-qPCR data, leading to erroneous conclusions about protein-DNA interactions. This document outlines a systematic troubleshooting framework, integrating current best practices and protocols to resolve these critical issues and ensure data reliability for downstream thesis analysis and publication.
Data Presentation: Summary of qPCR Performance Metrics and Troubleshooting Targets
Table 1: qPCR Primer and Amplification Performance Standards
| Parameter | Optimal Range | Acceptable Range | Indication of Problem |
|---|---|---|---|
| Primer Dimer Tm | N/A (absent) | >5-7°C lower than product Tm | Visible in melt curve or agarose gel |
| Amplification Efficiency | 100% ± 5% | 90% - 110% | <90% or >110% |
| Efficiency R² | >0.995 | >0.990 | <0.990 |
| Cq Standard Deviation (Technical Replicates) | <0.2 cycles | <0.5 cycles | >0.5 cycles |
| Slope (from standard curve) | -3.32 | -3.1 to -3.6 | Outside -3.1 to -3.6 |
Table 2: Common Issues & Primary Investigative Actions
| Observed Issue | Primary Checkpoint 1 | Primary Checkpoint 2 | Primary Checkpoint 3 |
|---|---|---|---|
| Primer Dimers | Primer specificity (BLAST) & secondary structure | Annealing temperature optimization | Primer concentration |
| Low Efficiency | Primer/Template quality & integrity | Mg²⁺/Buffer optimization | Inhibitors in template (purify) |
| Inconsistent Replicates | Pipetting technique & calibration | Template homogeneity & mixing | Master mix preparation consistency |
Experimental Protocols
Protocol 1: Systematic Primer Design and Validation for ChIP-qPCR Objective: To design and validate target-specific primers devoid of dimerization potential.
- Design: Using genomic browser software (e.g., UCSC, Ensembl), identify the target region (e.g., promoter site). Design primers 18-25 bp in length with a Tm of 58-62°C, amplicon size of 80-150 bp, and 40-60% GC content.
- Specificity Check: Perform in silico PCR and BLAST against the relevant genome. Check for single-nucleotide polymorphisms (SNPs) within binding sites.
- Synthesis & Reconstitution: Resynthesize primers (HPLC purified). Centrifuge tubes briefly before opening. Resuspend in RNase-free TE buffer or water to a 100 µM stock. Prepare a 10 µM working dilution.
- Empirical Validation: Run a temperature gradient qPCR (e.g., 55-65°C) using a positive control template (e.g., 1% input DNA from ChIP). Analyze products via melt curve (65-95°C, increment 0.5°C) and run on a 3% agarose gel. Select the annealing temperature yielding the lowest Cq, single peak in melt curve, and a single band of correct size.
Protocol 2: Standard Curve Construction for Efficiency Calculation Objective: To determine the precise amplification efficiency of each primer pair.
- Template Preparation: Use a positive control template (e.g., sheared genomic DNA, a cloned plasmid, or a pooled sample of high-concentration ChIP DNA). Perform a minimum 5-log serial dilution (e.g., 1:5 or 1:10) across at least 5 points.
- qPCR Setup: Run each dilution in triplicate using the optimized primer pair and standard cycling conditions.
- Data Analysis: Plot the mean Cq value against the log10 of the template concentration. Perform linear regression. Calculate efficiency using the formula: Efficiency (%) = (10^(-1/slope) - 1) * 100.
Protocol 3: Master Mix and Template Integrity Check for Replicate Consistency Objective: To identify the source of variability among technical replicates.
- Master Mix Homogenization: Thaw all reagents (except template) on ice. Vortex briefly and centrifuge. Prepare a master mix for all reactions +10% excess. Mix thoroughly by pipetting up and down or gentle vortexing, then centrifuge.
- Template Verification: Check ChIP DNA and input DNA purity via A260/A280 (optimal ~1.8) and A260/A230 (optimal >2.0) ratios. Visually assess integrity on an agarose gel (sheared DNA should appear as a smear 200-1000 bp).
- Pipetting Practice: Use calibrated pipettes and change tips between every sample. For high precision with small volumes, use a master mix containing everything except template, aliquot it, then add template individually.
- Control Reactions: Include a no-template control (NTC) and a positive control on every plate.
Mandatory Visualization
Title: qPCR Troubleshooting Decision & Action Workflow
Title: ChIP-qPCR Validation & Analysis Pipeline
The Scientist's Toolkit: Research Reagent Solutions for Robust ChIP-qPCR
| Item | Function & Rationale |
|---|---|
| HPLC-Purified Primers | Reduces truncated oligonucleotides that cause non-specific amplification and primer dimers. |
| Hot-Start DNA Polymerase | Prevents polymerase activity at room temperature, minimizing primer-dimer formation during reaction setup. |
| SYBR Green I Master Mix with ROX | Provides fluorescent intercalating dye for quantification; ROX dye acts as a passive reference for well-to-well normalization. |
| TE Buffer (pH 8.0) | Optimal buffer for primer resuspension and long-term storage, preventing degradation. |
| RNase/DNase-Free Water | Critical for preventing nucleic acid degradation and avoiding introduction of contaminants or inhibitors. |
| DNA Binding Columns (for Clean-up) | To purify ChIP DNA or PCR products, removing salts, detergents, or proteins that inhibit Taq polymerase. |
| Non-Stick Microcentrifuge Tubes | Minimizes adsorption of low-concentration ChIP DNA templates to tube walls, improving yield and consistency. |
| Digital Micropipettes with Certified Tips | Ensures highly accurate and precise liquid handling, crucial for reproducible standard curves and replicate consistency. |
This document provides advanced application notes for optimizing critical parameters in Chromatin Immunoprecipitation (ChIP) assays. Within the broader thesis of standardizing ChIP-qPCR protocols for robust, reproducible data analysis in drug target validation, mastering sonication, blocking, and washing is paramount. These steps directly dictate signal-to-noise ratios, resolution, and specificity, impacting all downstream quantification and biological interpretation.
Advanced Sonication: Achieving Optimal Chromatin Fragmentation
Sonication shears cross-linked chromatin into fragments of ideal size (200–500 bp). Under-sonication reduces resolution and yields, while over-sonication damages epitopes and DNA.
Key Quantitative Parameters: The optimal settings are highly dependent on the cell type, cross-linking conditions, and equipment. The following table summarizes benchmark data from recent literature for a Covaris S220 focused ultrasonicator.
Table 1: Optimized Sonication Settings for Diverse Cell Types (Covaris S220)
| Cell Type / Tissue | Fixed Cell Pellet | Peak Incident Power (W) | Duty Factor | Cycles/Burst | Time (min) | Target Size | Notes |
|---|---|---|---|---|---|---|---|
| HepG2 (Liver) | ~1x10⁶ cells | 105 | 5% | 200 | 12–15 | 200-400 bp | High protein density requires moderate power, longer time. |
| HEK293T (Kidney) | ~1x10⁶ cells | 105 | 10% | 200 | 8–10 | 200-500 bp | Fragile nuclei; shorter time prevents over-sonication. |
| Mouse Liver Tissue | ~10 mg | 140 | 5% | 200 | 18–22 | 300-600 bp | Dense tissue; requires higher power and longer duration. |
| Primary Neurons | ~5x10⁵ cells | 95 | 2.5% | 100 | 10–12 | 300-500 bp | Sensitive cells; low duty factor minimizes heat/foaming. |
Protocol 1.1: Systematic Sonication Optimization
- Sample Prep: Cross-link 1x10⁶ cells per condition with 1% formaldehyde for 10 min. Quench with 125 mM glycine. Lyse cells using a standard lysis buffer (e.g., 10 mM Tris-HCl pH 8.0, 1% SDS, 10 mM EDTA) with protease inhibitors.
- Shearing: Aliquot lysates into 130 µL volumes in microTUBEs. Using a Covaris S220, set Peak Incident Power and Duty Factor as per Table 1. Vary only the time in a gradient (e.g., 4, 8, 12, 16 min).
- Analysis: Reverse cross-link one aliquot (~20 µL) from each condition. Purify DNA and analyze fragmentation on a 2% agarose gel or Bioanalyzer. The ideal condition yields a smear centered at ~300 bp.
- Quantification: Measure DNA concentration via Qubit. Yields of 50–150 ng/µL from 1x10⁶ cells are typical for optimized shearing.
Blocking Strategies: Minimizing Non-Specific Background
Effective blocking reduces non-specific binding of the antibody-bead complex to non-target chromatin or the tube.
Table 2: Comparison of Blocking Agent Efficacy
| Blocking Agent | Typical Conc. in ChIP | Primary Function | Pros | Cons | Best For |
|---|---|---|---|---|---|
| BSA (Bovine Serum Albumin) | 0.1–0.5% (w/v) | Saturates non-specific protein binding sites. | Inert, cost-effective. | May contain trace IgGs; variable lots. | General use, pre-clearing steps. |
| Salmon Sperm DNA | 50–100 µg/mL | Competes for non-specific DNA binding to beads/antibody. | Directly targets DNA-binding background. | Can be degraded; requires shearing. | Transcription factors, low-abundance targets. |
| tRNA / Glycogen | 50–100 µg/mL | Acts as an inert molecular carrier. | Very low non-specific interaction. | Less effective for protein-based blocking. | Final wash steps, DNA precipitation. |
| Combination (BSA + DNA) | 0.1% BSA + 50 µg/mL SS DNA | Dual-action: blocks protein and DNA sites. | Most comprehensive reduction of background. | Slightly more complex preparation. | High-background samples, histone modifications. |
Protocol 2.1: Pre-clearing and Bead Blocking
- Prepare Blocked Beads: For Protein A/G magnetic beads, wash 40 µL bead slurry per IP. Resuspend in 500 µL of Dilution Buffer (0.01% SDS, 1.1% Triton X-100, 1.2 mM EDTA, 16.7 mM Tris-HCl pH 8.0, 167 mM NaCl) containing 0.5% BSA.
- Pre-clear: Add the blocked bead slurry to the sonicated, diluted chromatin lysate. Rotate for 1–2 hours at 4°C.
- Separate: Place on a magnet, and carefully transfer the pre-cleared supernatant to a new tube. This removes chromatin that binds non-specifically to the beads.
- Add Specific Antibody: Proceed by adding your target-specific antibody to the pre-cleared supernatant.
Wash Stringency: Balancing Specificity and Signal Retention
Stringent washing removes loosely bound, non-specific complexes while retaining true antibody-antigen interactions.
Table 3: Standard ChIP Wash Buffer Stringency Gradient
| Wash Buffer | Composition (Typical) | Purpose & Stringency | Notes |
|---|---|---|---|
| Low Salt Wash | 20 mM Tris-HCl (pH 8.0), 150 mM NaCl, 2 mM EDTA, 1% Triton X-100, 0.1% SDS | Removes non-specific interactions. Least stringent. | First wash; removes buffer components. |
| High Salt Wash | 20 mM Tris-HCl (pH 8.0), 500 mM NaCl, 2 mM EDTA, 1% Triton X-100, 0.1% SDS | Disrupts ionic/protein-protein interactions. Moderate stringency. | Critical for reducing background. |
| LiCl Wash | 10 mM Tris-HCl (pH 8.0), 250 mM LiCl, 1 mM EDTA, 1% NP-40, 1% Na-deoxycholate | Removes hydrophobic/aggregated proteins. High stringency. | Avoid if target is loosely bound. |
| TE Wash (Final) | 10 mM Tris-HCl (pH 8.0), 1 mM EDTA | Removes detergents/salts before elution. Non-stringent. | Prepares beads for elution buffer. |
Protocol 3.1: Stepwise Stringency Wash
- After overnight IP and bead capture, keep tubes on the magnet. Carefully aspirate and discard the supernatant.
- Wash 1: Add 1 mL of Low Salt Wash Buffer. Rotate for 5 min at 4°C. Place on magnet and discard supernatant.
- Wash 2: Add 1 mL of High Salt Wash Buffer. Rotate for 5 min at 4°C. Place on magnet and discard supernatant.
- Wash 3: Add 1 mL of LiCl Wash Buffer. Rotate for 5 min at 4°C. Place on magnet and discard supernatant.
- Wash 4: Add 1 mL of TE Buffer. Rotate for 2 min at 4°C. Place on magnet and discard supernatant.
- Proceed to DNA elution (e.g., with 1% SDS, 100 mM NaHCO₃).
The Scientist's Toolkit: Key Reagent Solutions
Table 4: Essential Research Reagents for Advanced ChIP Optimization
| Reagent / Solution | Function in ChIP Protocol | Critical Notes for Optimization |
|---|---|---|
| Covaris microTUBEs | Specially designed tubes for focused ultrasonication. | Ensures consistent acoustic coupling and efficient shearing. Must be free of cracks. |
| Protein A/G Magnetic Beads | Solid-phase support for antibody capture. | Pre-blocking with BSA/SS DNA is essential. Test bead lot for low background. |
| Protease Inhibitor Cocktail (PIC) | Prevents degradation of chromatin proteins and epitopes. | Must be added fresh to all buffers before cell lysis and immunoprecipitation. |
| Diagenode Bioruptor Pico | Alternative sonication device (water bath ultrasonication). | Settings are pulse-based. Optimization requires testing cycle number and power. |
| Glycogen (20 mg/mL) | Carrier for ethanol precipitation of low-concentration DNA. | Use during post-elution DNA purification to maximize recovery, especially for low-input ChIP. |
| ChIP-Grade Specific Antibody | Target-specific immunoprecipitation. | Validate for ChIP application. Titer carefully; avoid vast excess which increases noise. |
| RQ1 RNase-Free DNase Set | For removing contaminating RNA from DNA prep pre-qPCR. | Optional but recommended for clean qPCR signals, especially with sensitive assays. |
| SYBR Green qPCR Master Mix | Detection of enriched DNA fragments. | Use a mix resistant to common ChIP buffer contaminants (e.g., EDTA, salts). |
Validating Your ChIP-qPCR Data: Quantitative Analysis, Normalization Strategies, and Comparative Methods
This application note, framed within a thesis on advancing ChIP-qPCR protocols, provides a comparative analysis of two primary data quantification methods. The selection between Percent Input and Fold Enrichment is critical for accurate biological interpretation in chromatin immunoprecipitation studies, impacting research and drug development.
Quantitative Comparison of Methods
Table 1: Core Characteristics of Quantification Methods
| Feature | Percent Input | Fold Enrichment |
|---|---|---|
| Calculation | (2^[Cq(Input) - Cq(IP)]) / Dilution Factor * 100% |
2^[Cq(Control IgG) - Cq(Specific IP)] or 2^[Cq(Negative Region) - Cq(Target Region)] |
| Primary Reference | Total chromatin input (pre-immunoprecipitation) | Non-specific antibody control (IgG) or non-target genomic region |
| Interpretation | Direct measure of protein occupancy at a locus. | Relative enrichment over background noise. |
| Best For | Comparing occupancy across different proteins or conditions for the same locus. | Assessing specificity of enrichment for a target versus non-specific binding. |
| Limitations | Does not account for non-specific background; requires accurate input dilution tracking. | Highly dependent on the quality and specificity of the negative control. |
Table 2: Impact on Experimental Outcomes
| Scenario | Percent Input Recommendation | Fold Enrichment Recommendation |
|---|---|---|
| Determining absolute binding occupancy | Preferred | Not applicable |
| Establishing signal-to-noise specificity | Supplemental | Essential |
| Comparing different target proteins | Robust | Possible, but less direct |
| When input DNA quantity is highly variable | Problematic (requires normalization) | More robust if controls are consistent |
Detailed Experimental Protocols
Protocol A: Percent Input Calculation for ChIP-qPCR
This protocol is integral to standardizing occupancy measurements across experiments.
- Sample Preparation: During the ChIP protocol, reserve 10% of the chromatin supernatant before adding the antibody. This is the "Input" sample.
- DNA Processing: Co-process the Input sample with the IP samples: reverse cross-links, purify DNA, and elute in the same volume (e.g., 50 µL).
- qPCR Setup: Perform qPCR in triplicate for both IP and Input samples for each target region.
- Data Calculation:
- Determine the mean Cq for each sample.
- Account for Input dilution: If 10% was saved, the Dilution Factor = 10.
- Apply the formula: % Input = 100% * 2^[Cq(Input) – Cq(IP)] / Dilution Factor.
Protocol B: Fold Enrichment Calculation for ChIP-qPCR
This protocol is critical for demonstrating enrichment specificity, a key thesis requirement.
- Control Inclusion: Perform parallel ChIP reactions using a non-specific antibody (e.g., Normal Rabbit IgG) alongside the specific antibody.
- qPCR Analysis: Run qPCR for all samples (Specific IP, IgG IP, and Input) on target and non-target control regions.
- Data Calculation (vs. IgG):
- Use the formula: Fold Enrichment = 2^[Cq(IgG) – Cq(Specific IP)].
- Data Calculation (vs. Negative Genomic Region):
- Enrichment at a target locus (T) is normalized to a known negative region (N).
- Use the formula: Fold Enrichment = 2^[Cq(N) – Cq(T)] for the specific IP sample.
Visualization of Method Selection Logic
Title: Decision Logic for ChIP-qPCR Quantification Method
The Scientist's Toolkit: Essential Research Reagents & Materials
Table 3: Key Reagents for Robust ChIP-qPCR Quantification
| Item | Function & Importance |
|---|---|
| Specific Antibody (IP-grade) | High-affinity, validated antibody for the target protein/epitope. The cornerstone of assay specificity. |
| Control IgG | Isotype-matched, non-specific antibody from the same host species. Essential for calculating fold enrichment and assessing background. |
| Protein A/G Magnetic Beads | For efficient antibody-antigen complex pulldown. Reduce non-specific binding vs. agarose beads. |
| Cell Fixative (e.g., 1% Formaldehyde) | Crosslinks proteins to DNA, preserving in vivo interactions for accurate occupancy measurement. |
| qPCR Master Mix (SYBR Green) | For detection and quantification of immunoprecipitated DNA. Must have high efficiency and specificity. |
| Validated qPCR Primers | Primers for target genomic regions and necessary negative control regions. Specificity is critical. |
| Chromatin Shearing Device (Sonicator) | To fragment chromatin to optimal size (200-500 bp). Reproducible shearing is vital for data consistency. |
| DNA Purification Kit | For clean recovery of DNA after reverse cross-linking from both IP and Input samples. |
Application Notes
Within the rigorous framework of thesis research on ChIP-qPCR methodology, the implementation of critical controls is non-negotiable for ensuring data specificity, accuracy, and biological validity. These controls correct for technical noise and establish baseline signals, transforming raw qPCR data into interpretable results. Their proper use directly underpins the reliability of conclusions regarding transcription factor binding or histone modifications.
1. IgG Control (Isotype Control): This antibody control assesses non-specific antibody binding and background genomic DNA pull-down. A successful ChIP experiment must show a significantly higher signal (typically >10-fold) for the target-specific antibody (e.g., anti-RNA Polymerase II) at the positive control region compared to the IgG control.
2. Input DNA Reference: Input DNA is a sample of sheared, cross-linked chromatin prior to immunoprecipitation. It serves as the reference for total chromatin quantity and accessibility, correcting for variations in DNA shearing efficiency, primer amplification efficiency, and regional chromatin accessibility. Data is normalized to Input to calculate "% Input" or "Fold Enrichment."
3. Negative Genomic Region Control (e.g., GAPDH): This qPCR control tests the specificity of the observed enrichment. A genomic region not expected to bind the target protein (often in a constitutively silent gene like GAPDH or an intergenic desert) must show minimal enrichment. It validates that the antibody's signal is specific to biologically relevant loci.
Quantitative Data Summary: Expected Results for Valid Experiments Table 1: Interpretation of Critical Control Values in ChIP-qPCR Analysis
| Control | Typical Quantitative Output | Interpretation & Acceptable Range |
|---|---|---|
| IgG (Isotype) | Ct value or % Input | Should yield the highest Ct (lowest % Input). Signal at POI should be ≥10x lower than specific antibody. |
| Input DNA | Ct value | Typically has the lowest Ct value. Used as the 100% reference for normalization. |
| Negative Region (e.g., GAPDH) | Fold Enrichment (vs. IgG or Input) | Should be near 1 (0.5 to 2.0-fold). Confirms lack of non-specific enrichment. |
| Target Antibody @ Positive Control Region | Fold Enrichment (vs. IgG) | Should be significantly high (often >10-fold, up to 100s-fold). Validates assay & antibody. |
| Target Antibody @ Point of Interest (POI) | % Input or Fold Enrichment | Biologically relevant signal. Must be significantly above Negative Region and IgG. |
Experimental Protocols
Protocol 1: Input DNA Sample Preparation
- Material: An aliquot (1%) of the total sheared, cross-linked chromatin suspension saved before adding the specific antibody for the main ChIP procedure.
- Procedure:
- To the 1% chromatin aliquot, add 100 µL of TE buffer and 2 µL of RNase A (10 mg/mL). Incubate at 37°C for 30 min.
- Add 4 µL of 5M NaCl and 2 µL of Proteinase K (20 mg/mL). Reverse cross-links by incubating at 65°C for 4-6 hours or overnight.
- Purify DNA using a standard PCR purification kit or phenol-chloroform extraction.
- Elute DNA in 50-100 µL of elution buffer (10 mM Tris-HCl, pH 8.5). This is the Input DNA stock. Store at -20°C.
- For qPCR, use a 1:10 to 1:100 dilution of the Input DNA stock as the template.
Protocol 2: qPCR Setup & Data Analysis for Controls
- Reagents: SYBR Green qPCR Master Mix, locus-specific primers (POI, Positive Control, Negative Control), template DNA (ChIP samples, Input DNA dilution, IgG control DNA, No-Template Control).
- qPCR Plate Setup: Run all samples, including IgG and Input, in technical triplicates for each primer set.
- Data Analysis (Comparative Ct Method - % Input):
- Calculate the average Ct for each sample-primer combination.
- Determine ΔCt for each ChIP sample: ΔCt(ChIP) = Ct(ChIP) - Ct(Input).
- Calculate % Input: % Input = 100 * 2^(-ΔCt(ChIP)).
- For Fold Enrichment over IgG: Fold Enrichment = 2^(Ct(IgG) - Ct(Target Antibody)).
- Compare % Input or Fold Enrichment at the POI to the Negative Genomic Region.
Visualization
Title: ChIP-qPCR Critical Controls Workflow & Validation
Title: Logic of ChIP-qPCR Data Validation
The Scientist's Toolkit: Research Reagent Solutions
Table 2: Essential Materials for ChIP-qPCR Critical Controls
| Item | Function in Critical Controls |
|---|---|
| Protein A/G Magnetic Beads | Solid-phase matrix for antibody-antigen complex isolation; used for both target and IgG IPs. |
| Species-Matched Normal IgG | Isotype control antibody to establish non-specific binding baseline for immunoprecipitation. |
| RNase A & Proteinase K | Enzymes used in Input DNA prep to digest RNA and proteins, respectively, prior to DNA purification. |
| PCR Purification Kit | For clean and efficient recovery of DNA from Input and ChIP samples after reverse cross-linking. |
| Validated Positive Control Primer Set | Primers for a known binding site of the target (e.g., active promoter for Pol II) to validate the ChIP assay. |
| Validated Negative Control Primer Set | Primers for a genomic region devoid of protein binding (e.g., GAPDH gene body) to assess specificity. |
| SYBR Green qPCR Master Mix | Sensitive detection of amplified DNA; allows melt curve analysis to verify primer specificity. |
| High-Sensitivity DNA Assay Kit | For precise quantification of Input DNA stock to ensure accurate dilution for qPCR normalization. |
Statistical Analysis and Determining Significance Thresholds
Within a comprehensive thesis on ChIP-qPCR protocol and data analysis, the accurate determination of statistical significance is paramount for drawing reliable biological conclusions. This document outlines the application of statistical tests and the rationale for selecting appropriate significance thresholds (alpha levels) to control error rates in ChIP-qPCR experiments, which are critical for researchers, scientists, and drug development professionals investigating protein-DNA interactions.
Key Statistical Concepts for ChIP-qPCR
Error Types and Control
In hypothesis testing, two primary errors must be managed:
- Type I Error (False Positive): Incorrectly rejecting the null hypothesis (e.g., concluding an enrichment exists when it does not).
- Type II Error (False Negative): Failing to reject a false null hypothesis (e.g., missing a true enrichment).
The significance threshold (α) is the maximum acceptable probability of committing a Type I error.
The Multiple Testing Problem
A typical ChIP-qPCR experiment analyzes multiple genomic regions (primers), comparisons (e.g., treatment vs. control), or time points. Conducting multiple statistical tests inflates the family-wise error rate (FWER)—the probability of making at least one Type I error across all tests. For k independent tests at α=0.05, FWER ≈ 1 - (0.95)^k.
Table 1: Inflation of Family-Wise Error Rate with Multiple Tests
| Number of Tests (k) | Nominal α per test | Approximate Family-Wise Error Rate (FWER) |
|---|---|---|
| 1 | 0.05 | 0.05 |
| 5 | 0.05 | 0.23 |
| 10 | 0.05 | 0.40 |
| 20 | 0.05 | 0.64 |
Protocols for Statistical Analysis of ChIP-qPCR Data
Protocol: Data Normalization and ΔΔCq Calculation
Objective: To calculate fold-enrichment values from raw Cq data.
- Perform technical replicates for each biological sample and calculate the average Cq.
- Input Normalization: For each sample, calculate ΔCq = Cq(target region) - Cq(input DNA or reference gene).
- Experimental Normalization: Calculate ΔΔCq = ΔCq(test sample) - ΔCq(control sample/IP).
- Calculate Fold Enrichment = 2^(-ΔΔCq).
Protocol: Determining Statistical Significance
Objective: To test if fold-enrichment differs significantly from a control (often set to 1).
- Assumption Testing: Check if data from replicates (preferably ≥3 biological replicates) meets the assumptions of the planned parametric test (normality, homogeneity of variance). Use Shapiro-Wilk test for normality and Levene's test for equal variances.
- Select and Perform Test:
- For two-group comparison (e.g., treated vs. untreated): If assumptions are met, use an unpaired, two-tailed Student's t-test on the ΔΔCq values. If assumptions are violated, use the non-parametric Mann-Whitney U test.
- For more than two groups: Use one-way ANOVA followed by appropriate post-hoc tests (e.g., Tukey's HSD) if assumptions are met. Use Kruskal-Wallis test with Dunn's post-hoc if assumptions are violated.
- Apply Correction for Multiple Testing: If multiple regions/comparisons are tested simultaneously, apply a correction method to the resulting p-values.
- Bonferroni Correction: Adjusted α = α / m (where m = number of tests). Very conservative.
- Benjamini-Hochberg (B-H) Procedure: Controls the False Discovery Rate (FDR). Less conservative and often preferred in exploratory genomics.
- Rank all p-values from smallest to largest: p(1) ≤ p(2) ≤ ... ≤ p(m).
- For each p-value, calculate its B-H critical value: (i/m) * Q, where i is the rank, m is total tests, and Q is the desired FDR (e.g., 0.05).
- Find the largest p-value where p(i) ≤ (i/m) * Q. This and all smaller p-values are deemed significant.
Visualizing the Statistical Decision Workflow
Title: Statistical Analysis Workflow for ChIP-qPCR Data
The Scientist's Toolkit: Research Reagent Solutions
Table 2: Essential Materials for ChIP-qPCR Statistical Analysis
| Item | Function & Relevance to Analysis |
|---|---|
| High-Quality Antibody (Specific) | Critical for specific immunoprecipitation. High non-specific binding increases background noise, reducing statistical power to detect true enrichment. |
| qPCR Master Mix with High Efficiency | Ensures consistent and near-100% PCR efficiency across assays. Deviations require alternative ΔΔCq models (e.g., Pfaffl method), complicating analysis. |
| Validated Primer Sets | Primers must be optimized for specificity and efficiency. Inefficient primers increase Cq variability, widening confidence intervals. |
| Input DNA & Negative Control IgG | Essential for normalization and background determination. Poor controls prevent accurate ΔΔCq calculation and increase false discovery risk. |
| Biological Replicate Samples (n≥3) | The foundation of any statistical test. Technical replicates alone cannot account for biological variability. |
| Statistical Software (e.g., R, Prism, SPSS) | Required for performing t-tests, ANOVA, non-parametric tests, and multiple testing corrections accurately. |
| FDR Control Software/Algorithm | Necessary for implementing Benjamini-Hochberg or similar procedures when testing multiple genomic regions. |
Diagram: Multiple Testing Correction Impact
Title: Comparing Multiple Testing Correction Outcomes
Within the broader thesis on ChIP-qPCR protocol and data analysis research, a critical juncture arises when localized, candidate-based interrogation must expand to an unbiased, genome-wide scale. While ChIP-qPCR remains the gold standard for validating specific protein-DNA interactions at known genomic loci, it is fundamentally limited by the requirement for a priori sequence knowledge. This document outlines the scientific and experimental scenarios that necessitate transitioning from a qPCR-based approach to Chromatin Immunoprecipitation followed by sequencing (ChIP-seq) for de novo discovery, providing detailed application notes and protocols for the latter.
Key Decision Parameters: qPCR vs. ChIP-seq
The decision matrix below summarizes quantitative and qualitative factors guiding the choice of technique.
Table 1: Decision Matrix for ChIP-qPCR vs. ChIP-seq
| Parameter | ChIP-qPCR | ChIP-seq | Decision Threshold for ChIP-seq |
|---|---|---|---|
| Scope of Target | Known, candidate loci (1-10 targets) | Genome-wide, unbiased discovery | >10 loci of interest or hypothesis involves unknown binding sites |
| Primary Objective | Validation, time-course/ dose-response at known sites | Discovery of novel binding sites, genome-wide occupancy patterns | Any exploratory study defining binding landscape |
| Required Input | High-quality primers for known loci | High-quality antibody; no prior sequence knowledge needed | Lack of comprehensive prior knowledge of relevant genomic regions |
| Sample Throughput | High (96/384-well format) | Lower (limited by sequencing cost & depth) | When throughput is secondary to discovery scope |
| Cost per Sample | Low (~$50-$200) | High (~$500-$2000+) | Budget allows for discovery-driven investment |
| Data Output | Relative enrichment (fold-change) | Peak calls, genome coordinates, motif analysis, integrative genomics | Need for genomic coordinates, de novo motif discovery, or inter-sample peak comparison |
| Optimal Application | Validating interactions from ChIP-seq, focused studies | Transcription factor mapping, histone modification profiling, epigenetic mechanism discovery | Studying uncharacterized factors or complex epigenetic states |
When to Transition to ChIP-seq: Application Notes
- Discovery of Novel Binding Sites: When researching an uncharacterized transcription factor or a protein with suspected DNA-binding activity, ChIP-seq is the primary method to identify its binding locations across the genome without bias.
- Characterizing Genome-Wide Epigenetic Landscapes: Profiling histone modifications (e.g., H3K27ac, H3K4me3, H3K9me3) or variants across the genome to define active enhancers, promoters, or repressed regions.
- Complex Phenotype Investigation: When cellular responses (e.g., drug treatment, differentiation, disease state) involve global changes in transcriptional regulation or chromatin state that cannot be captured by monitoring a few candidate loci.
- Integrative Multi-Omics Analysis: When binding data must be correlated with other genome-wide datasets (e.g., RNA-seq, ATAC-seq, methylation arrays) to build mechanistic models.
Detailed Protocol: Cross-Linked ChIP-seq for Transcription Factors
This protocol is optimized for ~1 million mammalian cells per immunoprecipitation (IP).
Part 1: Cell Fixation & Chromatin Preparation
Reagents & Solutions:
- 1% Formaldehyde Solution: For DNA-protein crosslinking. Quench with 125mM Glycine.
- Cell Lysis Buffer I: 50mM HEPES-KOH (pH 7.5), 140mM NaCl, 1mM EDTA, 10% Glycerol, 0.5% NP-40, 0.25% Triton X-100.
- Cell Lysis Buffer II: 10mM Tris-HCl (pH 8.0), 200mM NaCl, 1mM EDTA, 0.5mM EGTA.
- SDS Shearing Buffer: 10mM Tris-HCl (pH 8.0), 1mM EDTA, 0.1% SDS.
- Protease Inhibitor Cocktail (PIC): Add fresh to all buffers.
Procedure:
- Crosslinking: Add 1% formaldehyde directly to culture medium. Incubate 10 min at RT with gentle agitation. Quench with 125mM glycine (5 min, RT).
- Cell Lysis: Wash cells 2x with cold PBS. Scrape cells. Pellet (5 min, 500 rcf, 4°C). Resuspend pellet in 1 mL Cold Lysis Buffer I + PIC. Incubate 10 min, 4°C, rotating. Pellet nuclei (5 min, 500 rcf, 4°C).
- Nuclear Wash: Resuspend pellet in 1 mL Cold Lysis Buffer II + PIC. Incubate 10 min, 4°C, rotating. Pellet nuclei (5 min, 500 rcf, 4°C).
- Chromatin Shearing:
- Resuspend pellet in 1 mL Cold SDS Shearing Buffer + PIC. Transfer to sonication tube.
- Shear chromatin using a focused ultrasonicator (e.g., Covaris M220) to achieve ~200-500 bp fragments. Example conditions: Peak Power: 75, Duty Factor: 20%, Cycles/Burst: 200, Time: 4 min.
- Centrifuge sonicated lysate (15 min, 16,000 rcf, 4°C). Transfer supernatant (chromatin) to a new tube.
Part 2: Immunoprecipitation & Library Preparation
Reagents & Solutions:
- ChIP Dilution Buffer: 16.7mM Tris-HCl (pH 8.0), 167mM NaCl, 1.2mM EDTA, 1.1% Triton X-100, 0.01% SDS.
- Protein A/G Magnetic Beads: Pre-blocked with 0.5% BSA in PBS for 1 hour.
- Low Salt Wash Buffer: 20mM Tris-HCl (pH 8.0), 150mM NaCl, 2mM EDTA, 1% Triton X-100, 0.1% SDS.
- High Salt Wash Buffer: 20mM Tris-HCl (pH 8.0), 500mM NaCl, 2mM EDTA, 1% Triton X-100, 0.1% SDS.
- LiCl Wash Buffer: 10mM Tris-HCl (pH 8.0), 250mM LiCl, 1mM EDTA, 1% NP-40, 1% Sodium Deoxycholate.
- TE Buffer: 10mM Tris-HCl (pH 8.0), 1mM EDTA.
- Elution Buffer: 50mM NaHCO₃, 1% SDS.
- RNase A & Proteinase K.
Procedure:
- Pre-Clear & IP: Dilute sheared chromatin 1:10 with ChIP Dilution Buffer. Take a 1% aliquot as "Input." Add 20-50 µL blocked Magnetic Beads to chromatin. Rotate 1 hour, 4°C (pre-clear). Pellet beads, transfer supernatant to new tube. Add 1-10 µg target-specific antibody. Rotate O/N, 4°C.
- Capture & Washes: Add 50 µL blocked Magnetic Beads. Rotate 2 hours, 4°C. Pellet beads and wash sequentially for 5 min each on rotator at 4°C with:
- 1 mL Low Salt Wash Buffer
- 1 mL High Salt Wash Buffer
- 1 mL LiCl Wash Buffer
- 2 x 1 mL TE Buffer
- Elution & Reverse Crosslink: Elute DNA from beads 2x with 150 µL Elution Buffer (shaking, 15 min, RT). Combine eluates (~300 µL). Add Input sample to 300 µL with Elution Buffer. Add 12 µL 5M NaCl to all tubes (IP and Input). Reverse crosslink O/N, 65°C.
- DNA Purification: Add 1 µL RNase A (30 min, 37°C), then 2 µL Proteinase K (2 hours, 55°C). Purify DNA using SPRI beads (e.g., AMPure XP). Elute in 20 µL TE buffer.
- Library Prep & Sequencing: Use a commercial high-throughput sequencing library kit. Size-select for fragments ~200-500 bp. Perform paired-end sequencing (e.g., 2x50 bp or 2x75 bp) on an Illumina platform. Aim for 10-30 million reads per sample for transcription factors.
Part 3: Critical Data Analysis Workflow
Diagram 1: ChIP-seq Data Analysis Core Workflow
The Scientist's Toolkit: Key Research Reagent Solutions
Table 2: Essential Materials for Successful ChIP-seq
| Item | Function & Critical Consideration |
|---|---|
| High-Quality Antibody | The single most critical reagent. Must be validated for ChIP (ChIP-grade). Check citations for genome-wide studies. High specificity reduces background noise. |
| Magnetic Beads (Protein A/G) | For efficient capture of antibody-antigen complexes. Select bead type (A, G, or A/G mix) based on host species and antibody isotype for optimal binding. |
| Focused Ultrasonicator | For consistent chromatin shearing to optimal fragment size (200-500 bp). Covaris or Diagenode systems provide reproducible, tunable acoustic shearing. |
| SPRI Size Selection Beads | For post-IP DNA cleanup and precise size selection during library prep (e.g., AMPure XP beads). Critical for removing primers and selecting properly sized fragments. |
| High-Sensitivity DNA Assay | For accurate quantification of low-concentration ChIP DNA and final libraries (e.g., Qubit dsDNA HS, Agilent TapeStation). Avoid UV spectrophotometry. |
| High-Fidelity Library Prep Kit | For constructing sequencing libraries from low-input, fragmented DNA. Kits with minimal PCR bias are essential (e.g., Illumina, NEB Next). |
| Indexed Adapters | Enable multiplexing of multiple samples in a single sequencing lane, reducing per-sample cost. |
| Control Samples | Essential. Include a matched Input DNA control and, if possible, a positive control antibody (e.g., H3K4me3) and a negative control (IgG). |
In chromatin immunoprecipitation quantitative PCR (ChIP-qPCR) research, benchmarking experimental results against established standards is the cornerstone of reproducibility. This Application Note details protocols and reporting frameworks essential for validating ChIP-qPCR data within a rigorous thesis context, ensuring findings are robust, comparable, and credible for scientific and drug development audiences.
Key Performance Metrics & Reporting Standards
Successful benchmarking requires quantification of specific performance indicators. The following table summarizes critical metrics and their target values or required descriptors.
Table 1: Essential Benchmarking Metrics for ChIP-qPCR Experiments
| Metric | Target/Standard | Purpose & Reporting Requirement |
|---|---|---|
| Antibody Validation | Specificity (KO/KD confirmation) and lot number. | Confirm target specificity. Report validation method, supplier, catalog #, and lot #. |
| Positive Control Locus | Enrichment ≥ 10-fold over negative control. | Assay functionality control. Report genomic coordinates and primer sequences. |
| Negative Control Locus | Enrichment close to 1 (non-enriched region). | Background binding control. Report genomic coordinates and primer sequences. |
| No-Antibody Control | Enrichment ≤ 2-fold over Input DNA. | Non-specific background control. Report as % of Input. |
| Input DNA Standard Curve | Amplification Efficiency: 90–110%; R² ≥ 0.99. | PCR efficiency validation. Report efficiency, R², and linear dynamic range. |
| Technical Replicates | Coefficient of Variation (CV) < 25%. | Intra-assay precision. Report CV for each target locus. |
| Data Normalization | Method clearly stated (e.g., %Input, Fold Change). | Ensure accurate quantification. Report full calculation formula. |
| MIQE Compliance | Adherence to MIQE guidelines (qPCR) and ChIP guidelines. | Ensure publication readiness. State adherence level and any deviations. |
Detailed Experimental Protocols
Protocol 1: Antibody Validation for ChIP
Objective: To confirm antibody specificity for the target epitope in the ChIP application. Materials: Wild-type (WT) and target gene knockout (KO) or knockdown (KD) cell lines, standard ChIP buffers, protein A/G beads. Procedure:
- Cross-link and harvest an equal number of WT and KO/KD cells (e.g., 1 x 10⁶ cells per IP).
- Perform chromatin sonication to achieve fragments of 200–500 bp.
- Split sheared chromatin into two equal aliquots for each cell type.
- Immunoprecipitate one aliquot with the target antibody and the other with an isotype control antibody.
- Perform qPCR analysis on known positive and negative control genomic regions.
- Calculation: Specific enrichment in WT cells must be abolished in KO/KD cells at positive control loci. Report enrichment as %Input or Fold Change over control IgG.
Protocol 2: Inter-Assay Reproducibility Benchmarking
Objective: To assess the consistency of results across independent experiments. Materials: Aliquoted cell stock, master mix of all reagents, standardized primers. Procedure:
- Plan three independent ChIP experiments (biological replicates) performed on different days.
- Use the same cell passage range, reagent lots, and equipment where possible.
- Process a shared positive control sample (e.g., a reference chromatin aliquot) in each run.
- For each target locus, calculate the mean Fold Change and standard deviation (SD) across the three experiments.
- Calculation: Report inter-assay CV = (SD / Mean) × 100%. A CV < 35% is generally acceptable for ChIP-qPCR.
Visualizing Workflows and Relationships
Title: ChIP-qPCR Project Workflow for Reproducibility
Title: ChIP-qPCR Data Analysis and QC Pathway
The Scientist's Toolkit
Table 2: Key Research Reagent Solutions for ChIP-qPCR Benchmarking
| Item | Function in Benchmarking | Example/Note |
|---|---|---|
| Validated ChIP-Grade Antibody | Specific immunoprecipitation of target protein-DNA complex. | Must be validated with KO/KD controls. Provide lot number. |
| Cell Line with Target KO/KD | Essential negative control for antibody specificity testing. | CRISPR-Cas9 knockout or stable shRNA knockdown line. |
| Control Primer Sets | Amplify positive & negative control genomic regions. | Pre-designed, locus-specific primers with known enrichment profile. |
| Magnetic Protein A/G Beads | Consistent capture of antibody-chromatin complexes. | Reduce variability vs. agarose beads. |
| SYBR Green Master Mix | Sensitive detection of PCR amplification. | Use a master mix optimized for qPCR on chromatin. |
| Sonicator with Microtip | Reproducible chromatin shearing to 200-500 bp. | Critical for IP efficiency; standardize time/energy. |
| Digital PCR System (Optional) | Absolute quantification for establishing reference materials. | For creating standardized Input DNA controls. |
| Sample Tracking LIMS | Logs reagent lots, instrument calibrations, protocols. | Ensures full experimental traceability. |
Conclusion
Mastering ChIP-qPCR requires a synergistic understanding of its biochemical principles, meticulous execution of the protocol, systematic troubleshooting, and rigorous data validation. This comprehensive approach transforms ChIP-qPCR from a simple endpoint assay into a powerful, quantitative tool for elucidating gene regulatory networks. As the field advances, the integration of ChIP-qPCR with next-generation sequencing (ChIP-seq) and single-cell technologies will further refine our understanding of epigenetic landscapes. For biomedical and clinical research, robust ChIP-qPCR data remains foundational for validating drug targets, understanding disease mechanisms like cancer and neurodegeneration, and developing novel epigenetic therapies, ensuring its continued relevance in the era of precision medicine.