EMSA Explained: A Step-by-Step Guide to Detecting Protein-Nucleic Acid Interactions for Biomedical Research
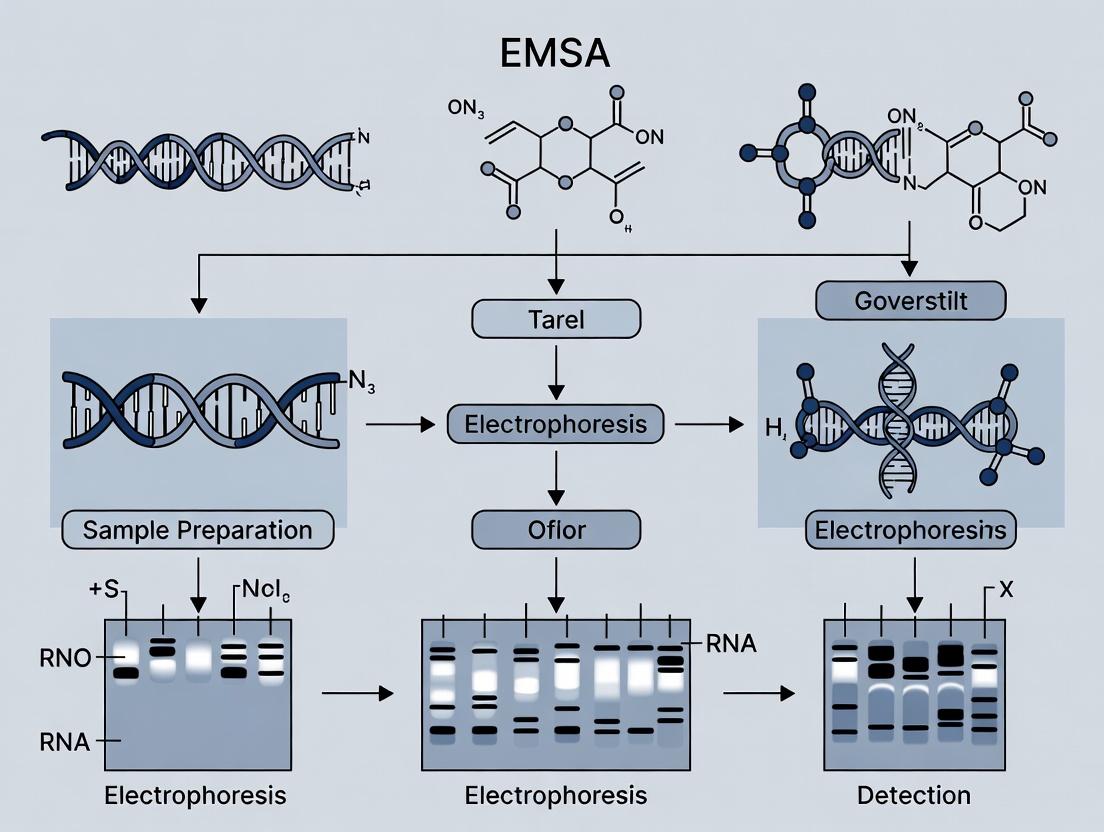
This comprehensive guide provides researchers, scientists, and drug development professionals with an in-depth exploration of the Electrophoretic Mobility Shift Assay (EMSA).
EMSA Explained: A Step-by-Step Guide to Detecting Protein-Nucleic Acid Interactions for Biomedical Research
Abstract
This comprehensive guide provides researchers, scientists, and drug development professionals with an in-depth exploration of the Electrophoretic Mobility Shift Assay (EMSA). Covering the core principles and history of EMSA, the detailed methodology and applications in drug discovery, expert troubleshooting tips for optimization, and comparisons with modern techniques like SPR and FP, this article serves as an essential resource. The content bridges foundational knowledge with advanced validation strategies, enabling readers to effectively apply EMSA to study transcription factors, DNA repair mechanisms, and therapeutic compound screening.
The Core Principles of EMSA: Understanding the Science Behind the Shift
The Electrophoretic Mobility Shift Assay (EMSA), also known as the Gel Shift Assay, is a foundational, non-denaturing gel electrophoresis technique used to detect and analyze protein-nucleic acid interactions. Within the broader thesis on How does EMSA detect protein-nucleic acid interactions research, this overview provides the historical context, conceptual principles, and technical execution that have made EMSA a cornerstone method in molecular biology, biochemistry, and drug development for over five decades.
Historical Development
The EMSA was first described in 1981 by Michael M. Garner and Arnold Revzin, and independently by David S. Fried and Donald M. Crothers. It emerged from the need to study sequence-specific DNA-binding proteins, such as transcription factors, in a relatively simple and accessible format. Prior methods were cumbersome or lacked specificity. The advent of EMSA allowed researchers to visualize the direct binding of a protein to a labeled nucleic acid probe via a detectable decrease in electrophoretic mobility through a native gel matrix. This innovation catalyzed research into gene regulation, leading to its ubiquitous adoption.
Conceptual Core and Thesis Context
The core principle of EMSA is that a protein-nucleic acid complex migrates more slowly through a porous gel under an electric field than the free nucleic acid alone. This "shift" in mobility is the assay's readout. The technique directly addresses the thesis question by providing a physical demonstration of interaction, allowing the study of binding specificity, affinity, stoichiometry, and the impact of mutations or competing molecules (e.g., potential drugs).
The assay's simplicity belies its quantitative power. Under controlled conditions, the fraction of probe shifted correlates with protein concentration and binding affinity, enabling comparative analysis.
Table 1: Typical EMSA Experimental Parameters and Outcomes
| Parameter | Typical Range/Description | Impact on Result |
|---|---|---|
| Gel Type | Non-denaturing Polyacrylamide (4-8%) | Higher % for smaller probes/complexes. |
| Electrophoresis | 0.5x TBE, 4-10°C, 80-150 V | Cold temp stabilizes weak complexes; voltage affects resolution. |
| Probe Length (DNA) | 20-50 bp | Optimal for resolution; longer sequences may have non-specific binding. |
| Protein Amount | 0.1-10 µg of crude extract or 1-100 nM purified | Titration for affinity estimation. |
| Incubation Time | 20-30 minutes at 20-25°C | Ensures equilibrium binding. |
| Competitor DNA | 50-200-fold molar excess poly(dI:dC) | Suppresses non-specific protein interactions. |
| Detection Limit | ~10 fmol of complex | Depends on label sensitivity (radioactive > chemiluminescent > fluorescent). |
Table 2: Controls for a Robust EMSA Experiment
| Control Type | Purpose | Expected Outcome |
|---|---|---|
| Probe Only | Baseline mobility of unbound nucleic acid. | Single fast-migrating band. |
| Protein + Probe | Test for complex formation. | Additional slower-migrating band(s). |
| Specific Competitor (unlabeled identical probe) | Confirm binding specificity. | Shifted band intensity decreases. |
| Non-specific Competitor (unlabeled unrelated sequence) | Confirm sequence specificity. | Shifted band intensity unaffected. |
| Antibody Supershift | Identify protein in complex. | Further retardation or loss of band (supershift or disruption). |
| Mutant Probe | Map specific binding sequence. | Reduced or absent shifted band. |
Detailed Experimental Protocol
Protocol: Basic EMSA for a DNA-Binding Protein
I. Labeling of Nucleic Acid Probe
- End-labeling (Kinase Reaction):
- Combine: 1 µL probe DNA (10 pmol/µL), 2 µL 10x T4 PNK buffer, 13.5 µL nuclease-free water, 2 µL [γ-³²P]ATP (or ATP for non-radioactive labeling), 1.5 µL T4 Polynucleotide Kinase (10 U/µL).
- Incubate at 37°C for 30 minutes.
- Purify labeled probe using a spin column (e.g., Sephadex G-25) to remove unincorporated nucleotides.
II. Binding Reaction
- Prepare a master binding buffer (final 1x: 10 mM Tris, 50 mM KCl, 1 mM DTT, 2.5% glycerol, 0.05% NP-40, pH 7.5).
- In a low-adhesion tube, set up a 20 µL reaction:
- 4 µL 5x Binding Buffer
- 1 µL Poly(dI-dC) (1 µg/µL) [Carrier DNA]
- 1 µL BSA (10 µg/µL) [Stabilizer]
- 2 µL Purified Protein or Nuclear Extract (amount titrated)
- X µL Nuclease-free water
- 1 µL Labeled Probe (~20 fmol)
- Optional: Add specific competitor (unlabeled probe) or antibody for supershift.
- Mix gently and incubate at room temperature for 20-30 minutes.
III. Non-Denaturing Gel Electrophoresis
- Gel Preparation: Prepare a 6% polyacrylamide gel (29:1 acrylamide:bis) in 0.5x TBE buffer. Pre-run gel at 100 V for 30-60 minutes in a cold room (4-10°C).
- Loading: Add 2 µL of 10x native loading dye (without SDS or denaturants) to each reaction. Load samples onto the pre-run gel.
- Electrophoresis: Run at 100-150 V in 0.5x TBE at 4-10°C until the bromophenol blue dye migrates ~2/3 of the gel length.
- Transfer & Detection: For radioactive probes, transfer gel to blotting paper, dry, and expose to a phosphorimager screen. For chemiluminescent/fluorescent probes, follow specific transfer and detection protocols.
Visualizing the EMSA Workflow and Analysis
Title: EMSA Core Experimental Workflow
Title: Interpreting EMSA Gel Lane Results
The Scientist's Toolkit: Key Research Reagent Solutions
Table 3: Essential Materials for an EMSA Experiment
| Item | Function & Rationale |
|---|---|
| Purified Protein / Nuclear Extract | The protein source containing the DNA/RNA-binding factor of interest. |
| Synthetic Oligonucleotide Probe | Defined nucleic acid sequence containing the suspected protein-binding site. Critical for specificity studies. |
| [γ-³²P]ATP or Biotin/Flurophore-labeled ATP | Provides the detectable tag for the probe. Radioactive labels offer highest sensitivity; non-radioactive alternatives are safer. |
| T4 Polynucleotide Kinase (PNK) | Enzyme that catalyzes the transfer of a phosphate group to the 5' end of the DNA probe, enabling labeling. |
| Non-denaturing Polyacrylamide Gel Mix | Matrix for separation. Must be non-denaturing (no SDS) to preserve protein-nucleic acid interactions. |
| Poly(dI-dC) or similar Carrier DNA | A non-specific, repetitive DNA polymer added in excess to bind and sequester non-sequence-specific nucleic acid-binding proteins, reducing background. |
| Specific & Non-specific Competitor DNAs | Unlabeled oligonucleotides used in control reactions to demonstrate binding specificity. |
| Binding Buffer Components (Tris, KCl, DTT, Glycerol, NP-40) | Provides optimal ionic strength, pH, and reducing environment to promote specific binding and complex stability during electrophoresis. |
| Antibody for Target Protein | Used in "supershift" experiments to confirm the identity of the protein in the shifted complex, providing a further retardation. |
| Phosphorimager Screen & Scanner or Chemiluminescence/Fluorescence Detector | Essential equipment for visualizing and quantifying the shifted bands. |
This document elucidates the biophysical principles underlying the Electrophoretic Mobility Shift Assay (EMSA), a cornerstone technique in the study of protein-nucleic acid interactions. The broader thesis question—How does EMSA detect protein-nucleic acid interactions?—hinges on the core phenomenon that a protein-nucleic acid complex migrates more slowly than the free nucleic acid during non-denaturing gel electrophoresis. This slowdown is not an artifact but a direct consequence of fundamental physical and chemical changes upon binding.
Core Mechanism: A Multi-Factor Analysis
The retardation observed in EMSA is attributed to a combination of interrelated factors. Quantitative data from key studies are summarized below.
Table 1: Factors Contributing to Migration Retardation in EMSA
| Factor | Physical Basis | Approximate Impact on Relative Mobility* | Key Supporting Evidence |
|---|---|---|---|
| Increased Mass | Direct addition of protein mass to the complex. | Low (~1-2% per 10 kDa protein on a 20-30 bp DNA). | Linear correlation between log(molecular weight) and mobility in sieving matrices. |
| Increased Frictional Drag | Change in hydrodynamic radius (Stokes radius) and shape. | High. Primary contributor. | Ferguson plot analysis; comparison of globular vs. elongated complexes. |
| Reduced Net Negative Charge | Neutralization of nucleic acid phosphate backbone by basic protein residues. | Moderate to High. | Altered mobility with salt/pH changes; comparisons with neutral polymers. |
| Conformational Change | Protein-induced bending or looping of the nucleic acid. | Variable (can be significant). | Comparison with known bending mutants; circular permutation assays. |
| Gel Sieving Effect | Increased interaction with the polyacrylamide or agarose matrix. | Consequence of all above factors. | Differential effects in varying gel % (pore size). |
*Relative Mobility: Defined as migration distance of complex / migration distance of free probe. Impact is qualitative based on consensus literature.
Detailed Experimental Protocols
Protocol 1: Standard EMSA for Demonstrating the Core Mechanism
- Objective: To visualize the retardation of a nucleic acid probe upon binding to a specific protein.
- Materials: Purified protein (e.g., transcription factor), (^{32})P or fluorescently end-labeled DNA/RNA probe containing the binding site, non-specific competitor DNA (e.g., poly(dI-dC)), EMSA buffer (10 mM HEPES, pH 7.5, 50 mM KCl, 1 mM DTT, 2.5% glycerol, 0.05% NP-40), 6% non-denaturing polyacrylamide gel (29:1 acrylamide:bis), 0.5X TBE running buffer.
- Procedure:
- Binding Reaction: Combine in a 20 µL volume: 1 µL labeled probe (~10 fmol), 2 µg non-specific competitor DNA, varying amounts of protein (0-100 nM), and EMSA buffer. Incubate at room temperature for 20-30 minutes.
- Gel Loading: Pre-run the polyacrylamide gel in 0.5X TBE at 100V for 30-60 min at 4°C. Load binding reactions directly (do not add loading dye containing SDS or EDTA, which disrupt complexes). Include a well with probe alone (free probe control).
- Electrophoresis: Run the gel at constant voltage (100-150V) for 60-90 minutes, maintaining temperature at 4°C to stabilize weak interactions.
- Detection: For radioactive probes, dry the gel and expose to a phosphorimager screen. For fluorescent probes, image directly using a suitable scanner.
Protocol 2: Ferguson Plot Analysis to Decouple Size/Shape and Charge Effects
- Objective: To determine whether retardation is primarily due to increased size or reduced charge.
- Principle: The relationship between electrophoretic mobility (µ) and gel concentration (%T) is described by: log(µ) = log(µ₀) - Kᵣ * %T, where µ₀ is the free mobility (related to charge/mass ratio) and Kᵣ is the retardation coefficient (related to molecular size).
- Procedure:
- Prepare identical binding reactions with protein and free probe.
- Run reactions on a series of non-denaturing polyacrylamide gels of different percentages (e.g., 4%, 6%, 8%, 10%).
- Measure the migration distance for the free probe and the protein-bound complex in each gel.
- Plot log(µ) versus gel percentage (%T) for each species. The slope (Kᵣ) indicates the size/shape-dependent sieving effect. A steeper slope for the complex confirms a larger effective size. The y-intercept (log(µ₀)) reflects the charge-to-mass ratio.
Mandatory Visualizations
Diagram 1: EMSA Retardation Mechanism Factors
Diagram 2: EMSA Experimental Workflow
The Scientist's Toolkit: Research Reagent Solutions
Table 2: Essential Reagents for EMSA and Mechanism Analysis
| Item | Function & Rationale |
|---|---|
| Non-denaturing Polyacrylamide | Forms a sieving matrix that separates molecules based on size, shape, and charge. Critical for preserving native complexes. |
| TBE or TAE Buffer | Running buffer provides ions for conductivity and maintains pH stability during electrophoresis. Low ionic strength can enhance complex stability. |
| Chemiluminescent/Fluorescent Nucleic Acid Label (e.g., IRDye, Cy5, Biotin) | Enables sensitive, non-radioactive detection of the probe and its shifted complexes. |
| Non-specific Competitor DNA (e.g., poly(dI-dC), salmon sperm DNA) | Binds to and blocks non-specific interactions of the protein with the probe or tube, reducing background and emphasizing specific shifts. |
| Purified Recombinant Protein | Essential for defining specific interactions. Purity minimizes confounding shifts from other proteins. |
| Antibody for Supershift | Binds to the protein in the complex, creating an even larger "supershifted" band, confirming protein identity. |
| Charge-Modifying Reagents (e.g., Heparin, DEAE-Dextran) | Used in competition or perturbation studies to probe the electrostatic component of binding and retardation. |
| Crosslinkers (e.g., Glutaraldehyde, Formaldehyde) | Can stabilize weak complexes prior to electrophoresis to prevent dissociation during the run ("crosslinking EMSA"). |
Within the broader thesis on How does EMSA detect protein-nucleic acid interactions, understanding the core reaction components is fundamental. The Electrophoretic Mobility Shift Assay (EMSA), or gel shift assay, is a cornerstone technique for detecting and analyzing sequence-specific interactions between proteins and nucleic acids (DNA or RNA). Its utility spans fundamental research in gene regulation, virology, and drug discovery targeting transcription factors. The specificity, sensitivity, and quantitative potential of an EMSA are entirely dictated by the precise formulation and optimization of its four key components: the protein, the probe, the binding buffer, and competitors.
The Four Pillars of the EMSA Reaction
Protein
The protein component is the target of study, typically a purified transcription factor, recombinant protein, or a protein complex from a nuclear extract.
- Source: Recombinant (purified), in vitro translated, or crude cellular/nuclear extracts.
- Critical Parameters: Concentration, purity, and activity. The protein must be in its native, folded state to recognize its specific binding sequence.
- Optimization: A titration series (e.g., 0, 1, 2, 5, 10 µg of nuclear extract or 0-100 nM purified protein) is essential to identify the linear range of binding and avoid nonspecific interactions at high concentrations.
Probe
The probe is the nucleic acid fragment that contains the suspected protein-binding site. It is radioactively or fluorescently labeled for detection.
- Design: Typically a short, double-stranded DNA oligonucleotide (20-50 bp) or an in vitro transcribed RNA fragment.
- Labeling: Common labels include ³²P (gamma-ATP for 5' end-labeling or fill-in of overhangs), DIG (Digoxigenin), Fluorescein, or Cy dyes.
- Specific Activity: Critical for sensitivity. Probes must be purified (e.g., via PAGE or spin column) to remove unincorporated nucleotides.
Table 1: Common EMSA Probe Labeling Methods
| Method | Label Type | Sensitivity | Stability | Required Equipment |
|---|---|---|---|---|
| End-labeling (T4 PNK) | ³²P, Fluorescein | Very High (³²P) | Short (³²P) | Phosphorimager, Gel dryer |
| Klenow Fill-in | ³²P, DIG-, Fluorescein-dNTPs | High | Short/Long | Phosphorimager/Scanner |
| PCR Incorporation | Biotin-, DIG-, Fluorescein-dNTPs | Moderate | Long | Gel Documentation System |
| Chemical Modification | Cy3, Cy5, ATTO dyes | Moderate-High | Long | Fluorescence Scanner |
Binding Buffer
The binding buffer provides the chemical environment that promotes specific, high-affinity interaction while maintaining protein stability.
- Core Components: A buffering agent (HEPES or Tris), monovalent (KCl, NaCl) and divalent (MgCl₂, ZnCl₂) cations, reducing agents (DTT), non-ionic detergent (NP-40), and carrier protein (BSA).
- pH & Salt: Optimized to match the protein's natural milieu; incorrect ionic strength can disrupt binding.
- Polymer Addition: Inert polymers like poly(dI•dC) are crucial to sequester non-specific DNA/RNA-binding proteins, especially when using crude extracts.
Table 2: Standard EMSA Binding Buffer Composition
| Component | Typical Concentration | Function | Notes |
|---|---|---|---|
| HEPES-KOH (pH 7.9) | 10-20 mM | Maintains physiological pH | More stable than Tris in some cases. |
| KCl | 50-100 mM | Controls ionic strength | Optimize to balance specificity & affinity. |
| MgCl₂ | 1-5 mM | Essential cofactor for many proteins | Can be replaced/omitted based on protein. |
| DTT | 0.5-1 mM | Maintains reducing environment | Prevents oxidation of protein cysteines. |
| Glycerol | 5-10% (v/v) | Stabilizes protein | Adds density for easy gel loading. |
| NP-40 / Triton X-100 | 0.01-0.1% | Reduces non-specific adsorption | |
| Poly(dI•dC) | 0.05-0.1 µg/µL | Competes for non-specific binding | Critical for nuclear extract experiments. |
| BSA | 0.1 µg/µL | Stabilizes dilute proteins | Not always required. |
Competitors
Competitor nucleic acids are unlabeled molecules added to the reaction to assess binding specificity and affinity.
- Specific Competitor: An unlabeled excess of the identical probe sequence. Successfully competes for binding, causing the shifted band to disappear.
- Non-specific Competitor: An unlabeled nucleic acid with a scrambled/mutated sequence. Does not (or minimally) competes for binding, confirming sequence specificity.
- Applications: Determine dissociation constants (Kd), map binding sites via mutation analysis, and identify specific protein-DNA complexes in multi-band shifts.
Detailed Experimental Protocol: A Standard EMSA
A. Probe Preparation (³²P End-labeling)
- Anneal Oligonucleotides: Mix 1 µL of each 100 µM complementary single-stranded DNA oligo in 10 µL annealing buffer (10 mM Tris, 50 mM NaCl, 1 mM EDTA). Heat to 95°C for 5 min, cool slowly to room temperature.
- Labeling Reaction: In a tube, combine:
- 1 µL annealed dsDNA probe (10 pmol)
- 2 µL 10X T4 PNK Buffer
- 1 µL T4 Polynucleotide Kinase (10 U)
- 5 µL [γ-³²P]ATP (50 µCi)
- 11 µL nuclease-free water. Incubate at 37°C for 30 min.
- Purification: Remove unincorporated nucleotides using a microspin G-25 or G-50 column. Quantify specific activity by scintillation counting.
B. Binding Reaction Assembly
- Pre-mix the Binding Buffer (without probe/protein) and Competitors (if any).
- In a low-protein-binding microtube, assemble a 20 µL reaction on ice:
- 2 µL 10X Binding Buffer
- 1 µL poly(dI•dC) (1 µg/µL stock)
- x µL specific/non-specific competitor DNA (e.g., 10-100x molar excess)
- y µL Nuclease-free water
- 1-2 µL Purified Protein or Nuclear Extract (amount determined by titration)
- 1 µL Labeled Probe (~20 fmol, ~20,000 cpm).
- Incubate: Mix gently and incubate at room temperature or 30°C for 20-30 min.
C. Electrophoresis & Detection
- Prepare Gel: Pre-run a 4-6% non-denaturing polyacrylamide gel (29:1 acrylamide:bis) in 0.5X TBE at 100 V for 30-60 min in a cold room.
- Load Samples: Add 2-5 µL of loading dye (without SDS) to each reaction. Load entire sample onto the pre-run gel.
- Run Gel: Electrophorese at constant voltage (100-150 V) in 0.5X TBE until the dye front migrates 2/3 down the gel (approx. 1.5-2 hours). Maintain temperature (4-10°C) via cold room or cooling apparatus.
- Visualize: Transfer gel to Whatman paper, dry under vacuum, and expose to a Phosphorimager screen or X-ray film. For non-radioactive probes, follow manufacturer's detection protocols (e.g., chemiluminescence).
Logical Framework of EMSA Experimental Design
Title: EMSA Experimental Design and Control Logic Flow
The Scientist's Toolkit: Essential EMSA Reagent Solutions
| Item | Function & Importance | Example Vendors/Products |
|---|---|---|
| T4 Polynucleotide Kinase (PNK) | Catalyzes transfer of ³²P from [γ-³²P]ATP to 5' ends of DNA/RNA for probe labeling. Essential for radioactive EMSA. | NEB, Thermo Fisher, Roche |
| [γ-³²P]ATP | Radioactive phosphate donor for 5' end-labeling of nucleic acid probes. Provides high sensitivity. | PerkinElmer, Hartmann Analytic |
| Poly(dI•dC) | Synthetic, nonspecific double-stranded DNA polymer. Critical competitor to suppress non-specific protein-nucleic acid binding in crude extracts. | Sigma-Aldrich, Invitrogen |
| Non-denaturing Acrylamide/Bis | For casting native polyacrylamide gels. Ratio (e.g., 29:1, 37.5:1) affects gel pore size and resolution of protein-nucleic acid complexes. | Bio-Rad, Sigma-Aldrich |
| 10X TBE Buffer | (Tris-Borate-EDTA) Standard electrophoresis buffer for native EMSA gels. Provides conductivity and buffering capacity. | Any molecular biology supplier |
| HEPES Buffer (1M, pH 7.9) | Common buffering agent for EMSA binding reactions, preferred for maintaining pH near physiological range. | Any molecular biology supplier |
| Dithiothreitol (DTT) | Reducing agent added to binding buffer to prevent oxidation and maintain cysteine residues in the protein's functional state. | Gold Biotechnology, Sigma-Aldrich |
| Protease Inhibitor Cocktails | Essential when working with cell extracts to prevent proteolytic degradation of the DNA/RNA-binding protein of interest during isolation and incubation. | Roche (cOmplete), Sigma (PIC) |
| Phosphorimager Screen & Scanner | For high-sensitivity, quantitative detection of radioactively labeled EMSA gels. Superior to X-ray film for dynamic range and speed. | GE Healthcare (Cyclone), Bio-Rad |
| Chemiluminescent Nucleic Acid Detection Module | For non-radioactive detection of DIG- or Biotin-labeled probes. Includes blocking reagent, conjugate antibody, and detection substrate. | Thermo Fisher (LightShift), Roche |
Within the broader thesis on How does EMSA detect protein-nucleic acid interactions, the choice of nucleic acid probe labeling and detection method is fundamental. The Electrophoretic Mobility Shift Assay (EMSA) relies on visualizing the migration shift of a probe upon protein binding. This technical guide details the core probe types—radiolabeled and non-radiochemical (chemiluminescent, fluorescent)—comparing their principles, protocols, and applications in modern molecular biology and drug discovery research.
Core Principles and Comparison
Radiolabeled Probes (Traditional Method)
Radiolabeled probes are typically prepared by incorporating phosphorus-32 (³²P) or phosphorus-33 (³³P) labeled nucleotides via enzymatic reactions (e.g., kinase or polymerase). Detection involves exposing the gel or membrane to X-ray film or a phosphorimager screen. The high-energy beta particles from decay create a latent image, which is then developed.
Non-Radiochemical Probes
- Chemiluminescent Detection: Probes are labeled with haptens (e.g., biotin, digoxigenin). After EMSA, the nucleic acid is transferred to a membrane and detected using a streptavidin- or antibody-conjugated enzyme (e.g., Horseradish Peroxidase, HRP). Addition of a chemiluminescent substrate (e.g., Luminol) produces light emission captured by a CCD camera.
- Fluorescent Detection: Probes are directly labeled with fluorophores (e.g., Cy3, Cy5, FAM). Post-electrophoresis, the gel is directly imaged using a fluorescence gel scanner or imager with appropriate excitation/emission filters. This method is truly "gel-shift" without needing transfer.
Quantitative Data Comparison:
Table 1: Comparison of Key Probe Detection Methods
| Parameter | Radiolabeled (³²P) | Chemiluminescent (Biotin/HRP) | Fluorescent (Direct) |
|---|---|---|---|
| Typical Sensitivity | 0.1–1 fmol | 1–10 fmol | 1–50 fmol |
| Signal Stability | Decays with isotope half-life (³²P: ~14.3 days) | Transient (hours), but substrate can be re-added | Stable (months if protected from light) |
| Exposure/Detection Time | Minutes to days (phosphorimager) | Seconds to minutes (CCD camera) | Seconds (laser scanner) |
| Spatial Resolution | High | Very High (membrane-based) | High (gel-based) |
| Hazard & Regulation | High; Radioactive waste, strict licensing | Low; Standard chemical safety | Low; Standard chemical safety |
| Quantitation Dynamic Range | >10⁴ | >10³ | >10³ |
| Primary Instrumentation | Phosphorimager, Geiger counter | Chemiluminescence imager (CCD-based) | Fluorescence gel scanner/imager |
| Key Advantage | Unmatched sensitivity, gold standard | Excellent sensitivity, no radioactivity | Fast, safe, in-gel detection |
| Key Limitation | Safety hazards, waste disposal, short probe shelf-life | Multiple steps (transfer, blocking, incubation), optimization required | Potential protein-fluorophore interference, scanner required |
Detailed Experimental Protocols
Protocol A: EMSA with Radiolabeled Probe (³²P)
Key Reagents: [γ-³²P]ATP, T4 Polynucleotide Kinase (PNK), Purified DNA/RNA oligo, Micro Bio-Spin P-30 Columns. Methodology:
- End-Labeling: In a 20 µL reaction, mix 1–10 pmol of oligonucleotide, 1X T4 PNK buffer, 20–50 µCi [γ-³²P]ATP, and 10 U T4 PNK. Incubate at 37°C for 30–60 min.
- Purification: Terminate reaction by heating to 65°C for 5 min. Remove unincorporated nucleotides using a spin column per manufacturer's instructions.
- EMSA Binding Reaction: Assemble 20 µL reaction with appropriate binding buffer, 1–5 µg nuclear extract/protein, 1 µg poly(dI-dC) as non-specific competitor, and ~20,000 cpm of labeled probe. Incubate 20–30 min at room temperature.
- Gel Electrophoresis: Load samples onto a pre-run 4–6% native polyacrylamide gel in 0.5X TBE. Run at 100V at 4°C until dye migrates appropriately.
- Detection: Transfer gel to Whatman paper, dry under vacuum, and expose to a phosphorimager screen overnight. Alternatively, expose to X-ray film at -80°C with an intensifying screen.
Protocol B: EMSA with Chemiluminescent Detection (Biotinylated Probe)
Key Reagents: Biotin-3’- or 5’-end labeled oligonucleotide, LightShift Chemiluminescent EMSA Kit components (e.g., from Thermo Fisher). Methodology:
- Binding Reaction: Assemble as in Protocol A, using 5–20 fmol of biotinylated probe.
- Electrophoresis & Transfer: Run native PAGE. Electrophoretically transfer nucleic acids to a positively charged nylon membrane in 0.5X TBE at 100V for 1 hr at 4°C.
- Crosslinking: UV crosslink the nucleic acid to the membrane (1200 J/m², 1 min).
- Detection (Sequential Incubations): a. Block: Incubate membrane in blocking buffer for 15 min. b. HRP-Conjugate Binding: Incubate with Streptavidin-HRP conjugate (1:300 dilution) for 15 min. c. Wash: Perform 4 x 5 min washes with wash buffer. d. Substrate Equilibration: Incubate with stable chemiluminescent substrate (e.g., Luminol/Enhancer) for 5 min.
- Imaging: Drain excess substrate, wrap membrane in plastic, and image immediately with a CCD-based imager (1 sec to 30 min exposures).
Protocol C: EMSA with Fluorescent Detection (Fluorophore-Labeled Probe)
Key Reagents: 5’-Fluorophore-labeled oligonucleotide (e.g., Cy5, FAM), Non-fluorescent competitor DNA. Methodology:
- Binding Reaction: Assemble as in previous protocols using 5–50 fmol of fluorescent probe. Note: Perform reactions in low-light or foil-wrapped tubes to minimize photobleaching.
- Gel Electrophoresis: Use pre-cast native polyacrylamide gels. Run in 0.5X TBE buffer. It is critical to use non-fluorescent plasticware (e.g., specific tinted tubes) if using certain far-red dyes like Cy5.
- In-Gel Imaging: Post-electrophoresis, carefully remove gel from plates. Directly image on a fluorescence gel scanner/imager using appropriate laser/excitation and emission filters for the fluorophore (e.g., 635 nm ex / 670 nm em for Cy5). No drying, transfer, or further processing is required.
Diagrams of Signaling Pathways and Workflows
Diagram 1: Radiolabeled EMSA workflow
Diagram 2: Chemiluminescent EMSA detection pathway
Diagram 3: Direct fluorescent EMSA workflow
The Scientist's Toolkit: Essential Research Reagents & Materials
Table 2: Key Reagent Solutions for EMSA Probe Detection
| Item | Function | Example/Catalog Context |
|---|---|---|
| [γ-³²P]ATP or Biotin/FL-dNTPs | Radiolabel or hapten/fluorophore source for probe synthesis. | PerkinElmer NEG502A (³²P), Roche 11093070910 (DIG-dUTP), Jena Bioscience NU-803-CY5 (Cy5-dCTP) |
| T4 Polynucleotide Kinase (PNK) | Catalyzes transfer of ³²P from [γ-³²P]ATP to 5’ terminus of DNA/RNA. | Thermo Fisher EK0031 |
| Biotin/FL End-Labeled Oligos | Custom-synthesized probes for non-radioactive EMSA. | IDT, Sigma-Aldrich custom synthesis services |
| Streptavidin-HRP Conjugate | High-affinity binding to biotin for chemiluminescent signal generation. | Thermo Fisher 21126 |
| Chemiluminescent Substrate | HRP substrate (Luminol/H2O2) yielding sustained light emission. | Thermo Fisher 32106 (SuperSignal) |
| Positively Charged Nylon Membrane | Binds nucleic acids for post-blot chemiluminescent detection. | Roche 11209299001, Cytiva RPN303B |
| Poly(dI-dC) or non-specific DNA | Competes for non-specific protein binding, reducing background. | Sigma-Aldrich P4929 |
| Native PAGE Gels (Pre-cast) | Provides matrix for separation of protein-nucleic acid complexes. | Thermo Fisher EC6365BOX (6% DNA Retardation Gel) |
| Phosphorimager Screen/Film | Captures and stores radioactive emission for imaging. | Cytiva 28906838 (Storage Phosphor Screen) |
| Fluorescence Gel Scanner | Instrument for direct excitation and emission capture of fluorescent probes. | Typhoon FLA, Azure Sapphire |
Thesis Context: EMSA in Protein-Nucleic Acid Interaction Research
Within the broader thesis investigating "How does EMSA detect protein-nucleic acid interactions?", this guide focuses on the critical interpretive step: analyzing the electrophoretic mobility shift. The Electrophoretic Mobility Shift Assay (EMSA) is a cornerstone technique for detecting and quantifying sequence-specific protein-nucleic acid interactions. The core principle relies on the visualization of a reduction in the electrophoretic mobility of a nucleic acid probe upon binding to a protein, forming a distinct "shifted" band compared to the free probe.
Table 1: Common EMSA Output Metrics and Interpretations
| Parameter | Free Probe Band | Protein-Bound Complex Band | Quantitative Implication |
|---|---|---|---|
| Relative Mobility (Rf) | 1.0 (Reference) | 0.2 - 0.8 | Decrease indicates complex formation; magnitude depends on protein size & complex stoichiometry. |
| Band Intensity | Decreases with increasing protein concentration. | Increases with increasing protein concentration. | Used for binding affinity (Kd) calculations via densitometry. |
| Band Appearance | Sharp, well-defined. | Often broader or as multiple discrete bands. | Broadening suggests dynamic complexes; multiple bands indicate multiple stoichiometries or conformations. |
| % Probe Bound | (Free band intensity / Total intensity) * 100 | (Bound band intensity / Total intensity) * 100 | Direct measure of binding extent at given protein concentration. |
Table 2: Troubleshooting Common Band Patterns
| Observed Pattern | Potential Cause | Experimental Validation |
|---|---|---|
| No shifted band | No binding; non-functional protein; incorrect buffer conditions. | Check protein activity with a positive control probe. |
| Smearing, not discrete shift | Non-specific binding; protein aggregation; degraded probe. | Increase competitor (e.g., poly(dI-dC)) concentration; use clean components. |
| Multiple shifted bands | Multiple protein complexes; oligomerization; multiple binding sites. | Perform supershift with specific antibody; use mutant probes. |
| Free probe disappears, no shift | Probe degradation or trapping in well. | Run probe-only control; check gel integrity and running conditions. |
Detailed Experimental Protocol: A Standard EMSA
Objective: To detect the binding of a purified transcription factor (TF) to its cognate DNA sequence.
1. Probe Preparation:
- Labeling: End-label 1-10 fmol of a 20-30 bp double-stranded DNA oligonucleotide containing the target sequence with [γ-³²P] ATP using T4 Polynucleotide Kinase. Purify using a spin column (e.g., G-25 Sephadex) to remove unincorporated nucleotides.
- Annealing: If using single-stranded oligonucleotides, anneal complementary strands in TE buffer by heating to 95°C for 5 min and slowly cooling to room temperature.
2. Binding Reaction:
- Set up a 20 µL reaction mix in a low-protein-binding tube:
- 1X Binding Buffer (10 mM HEPES pH 7.9, 50 mM KCl, 1 mM DTT, 2.5 mM MgCl₂, 10% Glycerol, 0.1% NP-40).
- 1 µg Poly(dI-dC) or other non-specific competitor DNA.
- Purified TF protein (0-100 nM final concentration, serially diluted).
- Nuclease-free water to volume.
- Pre-incubate at room temperature for 10 minutes.
- Add 0.1-0.5 ng (≈10,000 cpm) of labeled probe.
- Incubate at room temperature or 4°C for 20-30 minutes.
3. Electrophoresis:
- Pre-run a native polyacrylamide gel (4-6% acrylamide:bis, 29:1, 0.5X TBE buffer) at 100 V for 30-60 min at 4°C.
- Load samples (optional: add non-denaturing loading dye) directly onto the gel.
- Run at 100 V (constant voltage) in 0.5X TBE at 4°C until the bromophenol blue dye migrates ~2/3 down the gel.
4. Visualization:
- Transfer gel to blotting paper, dry under vacuum.
- Expose to a phosphorimager screen for 1-12 hours.
- Scan the screen and analyze band intensities using software (e.g., ImageQuant, ImageJ).
EMSA Workflow and Interpretation Logic
Title: EMSA Workflow from Experiment to Band Interpretation
Title: Core EMSA Principle: Binding Causes Gel Shift
The Scientist's Toolkit: Key Research Reagent Solutions
Table 3: Essential Reagents for EMSA
| Reagent/Material | Function & Purpose | Key Considerations |
|---|---|---|
| Purified Protein | The protein of interest for binding. | Must be active and in a compatible buffer (low salt, no denaturants). Can be full-length, domain, or tagged. |
| Labeled Nucleic Acid Probe | The target DNA or RNA sequence for binding detection. | Typically 20-40 bp, end-labeled with ³²P, biotin, or fluorophore. Must contain the putative binding site. |
| Non-Specific Competitor DNA (e.g., poly(dI-dC), salmon sperm DNA) | Binds and titrates out non-sequence-specific nucleic acid-binding proteins to reduce background. | Type and amount must be optimized. Critical for clean, specific shifts. |
| EMSA Binding Buffer (10X Stock) | Provides optimal ionic strength, pH, and stabilizing agents (DTT, glycerol) for the interaction. | Often includes Mg²⁺ or Zn²⁺ for metalloproteins. NP-40 reduces non-specific adsorption. |
| Native Gel Matrix (Polyacrylamide, 4-8%) | Separates complexes based on size/charge in a non-denaturing environment. | Acrylamide percentage determines resolution. Must be pre-run and run at 4°C to maintain complexes. |
| Electrophoresis Buffer (0.5X TBE or 0.5X TAE) | Conducts current and maintains pH during separation. | Low ionic strength (0.5X) is standard. Must be kept cold. |
| Specific Competitor/Oligo (Unlabeled 'Cold' Probe) | Competes with labeled probe for binding; confirms sequence specificity. | An excess of unlabeled identical probe should abolish the shift. Mutant probe should not. |
| Antibody for Supershift | Binds to the protein in the complex, causing a further mobility reduction or loss. | Confirms protein identity in the complex. Must be specific and not disrupt the protein-DNA interaction. |
A Detailed EMSA Protocol: From Probe Design to Image Analysis in Modern Applications
The Electrophoretic Mobility Shift Assay (EMSA) is a cornerstone technique for detecting sequence-specific protein-nucleic acid interactions, crucial for studying transcription factors, viral proteins, and RNA-binding proteins in drug discovery. The assay's specificity and sensitivity are fundamentally dependent on the initial step: the design and labeling of a high-quality probe. A poorly designed probe can lead to false positives from non-specific binding or false negatives from weak signal, compromising the entire thesis on interaction mechanisms. This guide details best practices to ensure probe specificity, forming the critical foundation for reliable EMSA data.
Core Principles of Probe Design for Specificity
Sequence Selection and Bioinformatics
- Target Site Identification: Use databases like JASPAR or TRANSFAC to confirm consensus sequences. Verify with published chromatin immunoprecipitation (ChIP) or SELEX data.
- Length Optimization: Probes are typically 20-40 bp for DNA and 15-50 nt for RNA. Longer probes increase risk of non-specific protein binding; shorter probes may lack necessary structural context.
- Specificity Verification:
- Perform a BLAST search against the host genome to ensure uniqueness.
- Avoid regions of high internal symmetry or repetitive sequences to prevent secondary structure that impedes protein access.
- Controls: Always design a mutant probe with 3-5 base substitutions in the core binding site as a negative control for specificity competition assays.
Thermodynamic Considerations
Stability and secondary structure prediction are vital. Use software like mFold or NUPACK.
Table 1: Optimal Thermodynamic Parameters for Probe Design
| Parameter | DNA Probe Target | RNA Probe Target | Rationale |
|---|---|---|---|
| ΔG (37°C) | > -9 kcal/mol | > -8 kcal/mol | Prevents stable intramolecular structures that hide protein-binding sites. |
| Tm (Duplex) | 55-70°C | 60-75°C | Ensures probe is double-stranded under assay conditions (typically 4-25°C). |
| GC Content | 40-60% | 40-60% | Balances specificity (higher GC) and ease of denaturation/annealing. |
Labeling Strategy for Optimal Detection
Labeling choice impacts sensitivity and experimental workflow.
Table 2: Comparison of Common Probe Labeling Methods
| Method | Typical Label | Specific Activity | Stability | Cost & Complexity | Best For |
|---|---|---|---|---|---|
| End-Labeling (T4 PNK) | γ-³²P or γ-³³P ATP | Very High (~10⁹ cpm/µg) | 2-4 weeks (³²P decay) | Moderate/Radioactive | Max sensitivity, competition EMSA, quantitative kinetics. |
| 3'-End Tail Labeling (TdT) | Digoxigenin-ddUTP, Biotin-ddUTP | High | Years (stable isotope) | Low/Non-radioactive | Routine lab use, high-resolution supershift assays. |
| PCR Incorporation | Digoxigenin-dUTP, Biotin-dUTP, Fluorescent dNTPs | High | Years | Low/Non-radioactive | Generating large amounts of double-stranded DNA probe. |
| Chemical Modification (RNA) | Cy3, Cy5, ATTO-dyes | Moderate | Years | High/Non-radioactive | Direct fluorescence detection, multiplexing. |
Detailed Experimental Protocols
Protocol A: End-Labeling of DNA Oligonucleotide with [γ-³²P]ATP
Materials: Single-stranded oligonucleotide, [γ-³²P]ATP, T4 Polynucleotide Kinase (PNK), 10X PNK Buffer, Nuclease-free water.
- Annealing: Mix complementary oligonucleotides (1 µM each) in 10 mM Tris, 50 mM NaCl, 1 mM EDTA. Heat to 95°C for 5 min, slow-cool to 25°C.
- Labeling Reaction:
- 1-10 pmol dsDNA probe
- 2 µL 10X T4 PNK Buffer
- 20-50 µCi [γ-³²P]ATP
- 10 U T4 PNK
- Nuclease-free water to 20 µL.
- Incubate at 37°C for 30 min.
- Purification: Remove unincorporated nucleotides using a micro spin G-25 column. Elute in TE buffer.
- Quantification: Measure radioactivity by scintillation counter. Aim for specific activity > 5 x 10⁷ cpm/µg.
Protocol B: PCR Incorporation of Digoxigenin for dsDNA Probe
Materials: DNA template with target sequence, specific primers, PCR mix, Digoxigenin-11-dUTP.
- Set up a standard 50 µL PCR reaction, but replace 25% of the dTTP in the dNTP mix with Digoxigenin-11-dUTP.
- Run PCR with optimized cycle number to avoid plateau phase.
- Purify the PCR product using a PCR purification kit.
- Verify incorporation and yield by running 5% of the product on an agarose gel alongside a known mass standard, followed by blotting and anti-digoxigenin immunodetection.
The Scientist's Toolkit: Essential Reagents & Materials
Table 3: Key Research Reagent Solutions for Probe Design & EMSA
| Item | Function in Probe Design/EMSA | Example Product/Catalog |
|---|---|---|
| T4 Polynucleotide Kinase (PNK) | Catalyzes transfer of phosphate from [γ-³²P]ATP to 5'-OH of DNA/RNA for radiolabeling. | Thermo Scientific #EK0031 |
| Terminal Deoxynucleotidyl Transferase (TdT) | Adds labeled dNTPs to 3'-ends of DNA for tail-labeling. | NEB #M0315 |
| Digoxigenin-11-dUTP | Non-radioactive label incorporated via PCR or tailing; detected by anti-DIG antibodies. | Sigma-Aldrich #11093088910 |
| Biotin-16-dUTP | Non-radioactive label for streptavidin-based detection. Useful for chemiluminescence. | Roche #11093070910 |
| G-25 Sephadex Micro Columns | Rapid spin-column purification to remove unincorporated nucleotides from labeling reactions. | Cytiva #27532501 |
| Poly(dI-dC) | Non-specific competitor DNA added in excess to binding reaction to quench non-specific protein binding. | Sigma-Aldrich #P4929 |
| Non-radiolabeled Competitor DNA | Unlabeled wild-type or mutant DNA used in competition assays to demonstrate binding specificity. | Custom synthesized oligos. |
| EMSA Gel Shift Binding Buffer (5X) | Commercial optimized buffer containing salts, carrier, and stabilizers for consistent binding reactions. | Thermo Scientific #20148 |
Visualizing the Probe Design & EMSA Workflow
Probe Design & EMSA Workflow
Factors Ensuring Specific EMSA Results
Within the context of research employing Electrophoretic Mobility Shift Assays (EMSA) to detect protein-nucleic acid interactions, the preparation of the protein sample is a critical, foundational step. The choice between using purified recombinant proteins or complex nuclear extracts dictates the biological relevance, specificity, and interpretability of the assay. This guide provides an in-depth technical comparison and protocols for both approaches.
Core Comparison: Recombinant vs. Nuclear Extract Proteins
The selection of protein source involves a fundamental trade-off between purity and physiological context.
| Parameter | Recombinant Protein | Nuclear Extract |
|---|---|---|
| Definition | Protein expressed & purified from heterologous systems (e.g., E. coli, insect cells). | Crude mixture of proteins extracted from the nuclei of cultured cells or tissues. |
| Complexity | Single protein or defined multimeric complex. | Complex mixture of thousands of proteins, nucleic acids, and other macromolecules. |
| Primary Advantage | High purity, known concentration and identity, absence of confounding factors. | Contains native protein complexes, post-translational modifications (PTMs), and physiological interactors. |
| Primary Disadvantage | May lack necessary PTMs or partner proteins for functional activity. | High background potential; specific protein of interest is dilute among many others. |
| Best Suited For | Confirming direct binding, mapping precise DNA-binding domains, kinetic studies. | Studying binding in a native context, identifying unknown binding proteins, analyzing differential PTM states. |
| Typical Yield | 0.1 - 10 mg per liter of culture (highly variable). | 1 - 5 mg total protein from 10^7 mammalian cells. |
| Key EMSA Consideration | Clean, specific shifts; may require addition of carrier proteins (e.g., BSA) to stabilize dilute protein. | Non-specific competition critical; supershift/antibody inhibition essential for specificity. |
Detailed Methodologies
Protocol 1: Preparation of Recombinant Protein (E. coli expression example)
This protocol outlines the expression and purification of a His-tagged transcription factor for EMSA.
1. Expression:
- Transform expression plasmid into appropriate E. coli strain (e.g., BL21(DE3)).
- Grow culture in LB + antibiotic to OD600 ~0.6-0.8.
- Induce protein expression with 0.1-1.0 mM Isopropyl β-d-1-thiogalactopyranoside (IPTG). Incubate at appropriate temperature (often 16-30°C) for 4-18 hours.
- Harvest cells by centrifugation (4,000 x g, 20 min, 4°C).
2. Lysis & Purification (IMAC):
- Resuspend pellet in Lysis Buffer (e.g., 50 mM Tris-HCl pH 8.0, 300 mM NaCl, 10 mM imidazole, protease inhibitors, 1 mg/mL lysozyme).
- Lyse cells by sonication or homogenization on ice.
- Clarify lysate by centrifugation (15,000 x g, 30 min, 4°C).
- Incubate supernatant with Ni-NTA resin for 1 hour at 4°C.
- Wash resin with 10-20 column volumes of Wash Buffer (Lysis Buffer with 20-50 mM imidazole).
- Elute protein with Elution Buffer (Lysis Buffer with 250-500 mM imidazole).
3. EMSA Preparation:
- Dialyze or desalt eluted protein into EMSA Storage/Binding Buffer (e.g., 20 mM HEPES pH 7.9, 100 mM KCl, 0.2 mM EDTA, 10% glycerol, 0.5 mM DTT).
- Determine concentration via Bradford or absorbance (A280).
- Aliquot, flash-freeze in liquid nitrogen, and store at -80°C. Avoid repeated freeze-thaw cycles.
Protocol 2: Preparation of Nuclear Extracts (Adapted from Dignam et al.)
This standard protocol is used to extract native proteins from mammalian cell nuclei.
1. Cell Harvest & Hypotonic Lysis:
- Harvest adherent cells (≈10^7) by scraping or trypsinization. Pellet (500 x g, 5 min).
- Wash cells with cold PBS. Repellet.
- Resuspend cell pellet thoroughly in 5x pellet volume of Hypotonic Buffer A (10 mM HEPES-KOH pH 7.9, 1.5 mM MgCl2, 10 mM KCl, 0.5 mM DTT, 0.2 mM PMSF).
- Incubate on ice for 10-15 minutes to swell cells.
- Centrifuge (500 x g, 5 min, 4°C). Discard supernatant.
2. Nuclear Lysis:
- Resuspend swollen cell pellet in 2x original pellet volume of Buffer A.
- Lyse cells with 10-20 strokes in a Dounce homogenizer (tight pestle). Check lysis (>90%) under a microscope.
- Centrifuge (1,000 x g, 10 min, 4°C) to pellet nuclei.
- Carefully aspirate supernatant (cytoplasmic fraction).
3. Nuclear Protein Extraction:
- Resuspend nuclear pellet in High-Salt Extraction Buffer C (20 mM HEPES-KOH pH 7.9, 25% glycerol, 0.42 M NaCl, 1.5 mM MgCl2, 0.2 mM EDTA, 0.5 mM DTT, 0.2 mM PMSF). Use ≈3 mL per 10^7 cells.
- Stir gently on a rocking platform at 4°C for 30-60 minutes.
- Centrifuge (20,000 x g, 30 min, 4°C) to remove debris.
4. Dialysis & Storage:
- Dialyze supernatant against Dialysis Buffer D (20 mM HEPES-KOH pH 7.9, 20% glycerol, 0.1 M KCl, 0.2 mM EDTA, 0.5 mM DTT, 0.2 mM PMSF) for 4-6 hours.
- Clarify dialysate by centrifugation (20,000 x g, 20 min, 4°C).
- Aliquot supernatant, flash-freeze, and store at -80°C. Determine total protein concentration.
Visualizing the Workflow
Title: Decision Workflow for EMSA Protein Sample Preparation
The Scientist's Toolkit: Key Research Reagent Solutions
| Reagent/Material | Function in Preparation | Key Consideration |
|---|---|---|
| Expression Vectors (pET, pFastBac) | Carry gene of interest with tags (His, GST, MBP) for expression & purification. | Choose promoter/host system matching protein size, need for PTMs, and solubility. |
| Affinity Resins (Ni-NTA, Glutathione Sepharose) | Immobilized ligands for capturing tagged recombinant proteins via IMAC or affinity. | High binding capacity is key; monitor for metal ion leaching (IMAC) which can affect EMSA. |
| Protease Inhibitor Cocktails | Prevent proteolytic degradation of proteins during extraction/purification. | Essential for nuclear extracts; use broad-spectrum, EDTA-free if needed for metal-binding proteins. |
| Hypotonic Lysis Buffer | Causes cell swelling and weakens membrane for gentle mechanical disruption. | Osmolarity is critical; must be optimized for specific cell type (mammalian, yeast, plant). |
| High-Salt Extraction Buffer (≈400 mM NaCl) | Disrupts ionic interactions between nuclear proteins and DNA/histones. | Salt concentration is a balance between yield and specificity; too high can co-extract non-nuclear contaminants. |
| Dialysis Membrane/Tubing | Removes high salt from nuclear extracts post-extraction to restore physiological conditions. | Correct molecular weight cut-off (MWCO) is vital to retain protein of interest while removing salts. |
| Glycerol | Stabilizes protein activity, prevents aggregation, and allows storage at -20°C/-80°C. | Standard in storage buffers (10-20% v/v); increases density of sample for EMSA loading. |
| Dithiothreitol (DTT) | Reducing agent that maintains cysteine residues in reduced state, preserving activity. | Must be added fresh to buffers; degrades over time. Can interfere with some fluorescent EMSA probes. |
Within the broader investigation of how Electrophoretic Mobility Shift Assay (EMSA) detects protein-nucleic acid interactions, the establishment and optimization of the binding reaction are critical. This step determines the formation of specific complexes that will be resolved and detected in subsequent stages. Proper optimization of incubation conditions is essential to maximize signal-to-noise ratio, ensure complex stability, and provide biologically relevant data on binding affinity and specificity.
Core Components of the Binding Reaction
Essential Reagents and Their Functions
The binding reaction is a carefully balanced mixture of components, each playing a specific role in promoting and stabilizing the interaction between the protein and the nucleic acid probe.
Table 1: Core Components of a Standard EMSA Binding Reaction
| Component | Typical Concentration Range | Primary Function | Critical Notes |
|---|---|---|---|
| Labeled Nucleic Acid Probe | 0.1-10 nM (for radiolabel); 1-20 nM (for chemiluminescence) | Target for protein binding; provides detection signal. | Must be in excess over protein to ensure quantitation; specific activity is key. |
| Protein Extract / Purified Protein | Variable; often 0.5-20 µg of nuclear extract, or 1-100 nM purified protein. | The binding partner of interest. | Concentration must be titrated; purity affects specificity. |
| Binding Buffer / Incubation Buffer | 1X final concentration. | Provides optimal ionic strength, pH, and cofactors for binding. | Often contains Tris/HCl, KCl/NaCl, Mg²⁺, DTT, glycerol. |
| Non-Specific Competitor DNA | 0.05-2 µg/µL (e.g., poly(dI-dC), salmon sperm DNA). | Binds non-specific nucleic acid-binding proteins to reduce background. | Type and amount require optimization; critical for clean shifts. |
| Carrier Protein (e.g., BSA) | 0.1-0.5 µg/µL. | Stabilizes dilute protein solutions; reduces non-specific adsorption to tubes. | Use nuclease-free, acetylated BSA. |
| Divalent Cations (e.g., MgCl₂) | 0.5-5 mM. | Often required for structural integrity of nucleic acid or protein-DNA interface. | Can be omitted or chelated for metal-dependency studies. |
| Reducing Agent (e.g., DTT) | 0.5-2 mM. | Maintains sulfhydryl groups of proteins in reduced state. | Fresh preparation is crucial. |
| Detergent (e.g., NP-40) | 0.01-0.1%. | Reduces non-specific aggregation. | Use non-ionic types. |
Optimization of Incubation Conditions
The stability and yield of the protein-nucleic acid complex are highly sensitive to physical and chemical incubation parameters.
Incubation Time and Temperature
- Time Course: Binding reactions are typically allowed to reach equilibrium. For many transcription factors, this occurs within 20-30 minutes at room temperature (20-25°C). Longer incubations (up to 60 minutes) may be needed for weak interactions or low protein concentrations. Extended times (>60 minutes) risk protein degradation or complex dissociation.
- Temperature: Room temperature is standard. Binding at 4°C (on ice) can slow kinetics but may stabilize some complexes. Optimization is required to find the condition yielding the sharpest, most intense shifted band with minimal smearing.
Table 2: Optimization Matrix for Incubation Time/Temperature
| Condition | Pros | Cons | Recommended Use Case |
|---|---|---|---|
| 20-25°C for 20 min | Fast; reaches equilibrium for many interactions. | Potential for protease/nuclease activity. | Standard first attempt for most nuclear extracts. |
| 4°C for 30-60 min | Stabilizes labile complexes; reduces enzyme activity. | Slower kinetics; may not reach equilibrium. | For known cold-sensitive or very stable complexes. |
| 30-37°C for 15 min | Physiological relevance for some systems. | Increases risk of degradation; may destabilize some complexes. | For thermophilic proteins or studies of temperature dependence. |
Ionic Strength and pH
- Salt Concentration (KCl/NaCl): Typically optimized between 0 and 150 mM. Low salt (<50 mM) can promote non-specific electrostatic interactions. High salt (>100 mM) can disrupt specific complexes. A "salt titration" experiment identifies the optimal stringency.
- pH: Most protocols use pH 7.5-8.0 (Tris-HCl or HEPES buffers). Shifts outside this range can drastically alter binding affinity and specificity.
Competitor DNA Optimization
This is arguably the most critical optimization for a clean assay. The goal is to suppress non-specific shifting without affecting the specific complex.
Detailed Protocol: Competitor DNA Titration
- Set up a series of 20 µL binding reactions with constant amounts of labeled probe and protein extract.
- Prepare a 2X stock solution of the chosen non-specific competitor (e.g., poly(dI-dC)).
- Add varying volumes of the 2X competitor stock to the reactions to achieve a final concentration series (e.g., 0, 0.25, 0.5, 1.0, 2.0 µg/µL).
- Incubate and run EMSA as standard.
- Analysis: Identify the concentration that maximizes the intensity of the specific shifted band while minimizing non-specific smearing or super-shifted bands at the well. Graph the intensity of the specific band vs. competitor concentration.
Table 3: Types of Non-Specific Competitors
| Competitor Type | Composition | Best For | Mechanism |
|---|---|---|---|
| Poly(dI-dC) | Synthetic alternating polymer. | Most common; general purpose for DNA-binding proteins. | Mimics backbone charge; minimal sequence specificity. |
| Sheared Salmon Sperm DNA | Heterogeneous natural DNA. | When poly(dI-dC) is ineffective; for some RNA-binding proteins. | Provides a vast array of sequences to absorb non-specific binders. |
| tRNA | Yeast or E. coli tRNA. | Primarily for RNA-binding protein assays (REMSA). | Competes for non-specific RNA-binding proteins. |
| Specific Unlabeled Probe | Identical sequence to labeled probe. | For competition experiments to prove binding specificity. | Competes for the specific protein of interest. |
Experimental Protocol: Standard EMSA Binding Reaction Setup
Materials:
- Purified protein or cell nuclear extract.
- End-labeled, double-stranded DNA or RNA probe.
- 5X or 10X Binding Buffer (e.g., 100 mM Tris pH 7.5, 500 mM KCl, 25 mM MgCl₂, 50% glycerol, 10 mM DTT).
- Non-specific competitor DNA (e.g., 1 µg/µL poly(dI-dC)).
- Nuclease-free water.
- Acetylated BSA (10 mg/mL).
- 0.5 mL thin-walled PCR tubes or LoBind microcentrifuge tubes.
Procedure:
- Prepare Master Mix (for n reactions + 10% extra): Calculate volumes for all common components: nuclease-free water, 5X binding buffer, acetylated BSA, competitor DNA, and any cofactors (e.g., Mg²⁺). Mix thoroughly by gentle pipetting. Do not add protein or probe at this stage.
- Aliquot Master Mix: Dispense the appropriate volume of Master Mix into each reaction tube.
- Add Protein: Add the variable component—the protein extract or purified protein—to each tube. Include a "no-protein" control.
- Pre-incubate: Incubate the protein + master mix for 5-10 minutes on ice. This allows the competitor DNA to pre-block non-specific sites.
- Initiate Binding: Add the labeled nucleic acid probe to each tube. Mix gently by pipetting. Do not vortex.
- Incubate: Place tubes in a pre-set thermal cycler or water bath at the optimized temperature (e.g., 25°C) for the optimized time (e.g., 20 minutes).
- Load Gel: After incubation, optionally add 1-2 µL of 10X non-denaturing loading dye (containing glycerol but no SDS). Load the entire reaction onto a pre-run native polyacrylamide gel immediately to prevent complex dissociation.
The Scientist's Toolkit: Research Reagent Solutions
Table 4: Essential Materials for EMSA Binding Reactions
| Item | Example Product/Catalog # | Function in Experiment |
|---|---|---|
| High-Purity Nucleotides | [γ-³²P]ATP or Biotin/Flurophore labeling kits (e.g., Thermo Fisher, #89818) | For generating high-specific-activity labeled probes. |
| Non-Specific Competitor DNA | Poly(dI-dC), (e.g., Sigma, #P4929) | Critical reagent to suppress non-specific protein-nucleic acid interactions. |
| Recombinant Protein or High-Quality Extract | Purified protein (e.g., Abcam, recombinant) or nuclear extract kits (e.g., Active Motif, #40010) | The binding partner of interest; purity is paramount. |
| Nuclease-Free Buffers & Reagents | Molecular biology grade Tris, DTT, glycerol, BSA (e.g., NEB, nuclease-free reagents) | Prevents degradation of the nucleic acid probe. |
| Low-Binding Microcentrifuge Tubes | Protein LoBind Tubes (e.g., Eppendorf, #022431081) | Minimizes adsorption of precious protein and probe to tube walls. |
Visualizing the EMSA Workflow and Reaction Optimization Logic
Title: EMSA Experimental Workflow with Key Optimization Steps
Title: Logic of Optimizing Key EMSA Binding Reaction Parameters
Within the framework of Electrophoretic Mobility Shift Assay (EMSA) research for detecting protein-nucleic acid interactions, the selection of an appropriate non-denaturing gel matrix is a critical experimental parameter. This choice directly influences complex resolution, detection sensitivity, and the validity of conclusions regarding binding affinity and specificity.
Core Principles and Matrix Comparison
Non-denaturing (native) gel electrophoresis preserves the tertiary and quaternary structure of proteins and protein-nucleic acid complexes during separation. The gel matrix acts as a molecular sieve; its pore size determines which species can migrate and how effectively they are resolved.
Quantitative Comparison of Gel Matrices for EMSA
| Parameter | Polyacrylamide Gel | Agarose Gel |
|---|---|---|
| Typical Concentration Range | 4-10% (bis-acrylamide 3.3% of total monomer) | 0.5-3.0% |
| Effective Pore Size | Small, tunable via %T | Large, tunable via % |
| Optimal Separation Range | Low MW complexes (<500 kDa) | High MW complexes (>500 kDa) |
| Typical Thickness | 0.5-1.5 mm | 3-10 mm |
| Loading Capacity | Low (10-20 µL/well) | High (up to 50 µL/well) |
| Resolution Power | High | Moderate to Low |
| Best Suited For | High-resolution analysis of small complexes, precise Kd estimation, supershift assays. | Large complexes (e.g., nucleoprotein assemblies), quick screening, complexes with rapid off-rates. |
| Key Advantages | Superior resolution, sensitive detection of minor species, stable covalent matrix. | Non-toxic casting, faster runs, handles large complexes, better for low-affinity binders. |
| Primary Limitations | Acrylamide toxicity, oxygen inhibition during polymerization, smaller pore size can trap large complexes. | Lower resolution, potential electroendosmosis (EEO), gel fragility at low percentages. |
Detailed Experimental Protocols
Protocol 1: Casting and Running a Non-Denaturing Polyacrylamide Gel for EMSA
Objective: To resolve a protein-DNA complex of approximately 100-200 kDa.
Research Reagent Solutions & Materials:
- Acrylamide/Bis-Acrylamide (29:1 or 37.5:1 stock): Forms the cross-linked polymer network.
- Tris-Glycine or Tris-Borate (TB) 10X Buffer: Provides conducting ions and maintains pH during electrophoresis.
- Ammonium Persulfate (APS) 10% (w/v): Free-radical initiator for polymerization.
- Tetramethylethylenediamine (TEMED): Catalyst for free-radical polymerization.
- Non-denaturing Loading Dye (5X): Contains glycerol (for dense loading) and tracking dyes (e.g., bromophenol blue, xylene cyanol).
- Gel Casting System: Includes glass plates, spacers (0.75-1.0 mm), combs, and clamps.
- Vertical Electrophoresis Unit & Power Supply.
Methodology:
- Gel Solution Preparation: For a 6% gel, mix 2.0 mL of 30% acrylamide/bis (29:1), 5.0 mL of 10X TB buffer, and 13.0 mL of deionized water in a flask. Degas for 5-10 minutes to remove oxygen, which inhibits polymerization.
- Polymerization: Add 100 µL of 10% APS and 20 µL of TEMED. Swirl gently to mix.
- Casting: Immediately pour the solution between the assembled glass plates. Insert a comb and allow polymerization to complete for 30-45 minutes at room temperature.
- Electrophoresis Setup: Place the polymerized gel in the vertical unit. Fill the upper and lower chambers with 0.5X or 1X TB running buffer (pre-chilled to 4°C for stability of labile complexes).
- Sample Loading: Mix the binding reaction (protein + labeled probe + buffer/poly dI:dC) with 1/5 volume of non-denaturing loading dye. Load carefully into wells.
- Run Conditions: Run the gel at constant voltage (80-150 V) in a cold room (4°C) until the tracking dye migrates an appropriate distance. Higher voltages generate heat that can disrupt complexes.
Protocol 2: Casting and Running a Non-Denaturing Agarose Gel for EMSA
Objective: To analyze a large nucleoprotein complex or perform a rapid binding screen.
Research Reagent Solutions & Materials:
- Molecular Biology Grade Agarose: High purity, low EEO grade is essential.
- Tris-Acetate-EDTA (TAE) or Tris-Borate-EDTA (TBE) 50X Buffer: Standard buffers for agarose electrophoresis.
- Gel Casting Tray & Combs: Horizontal system.
- Horizontal Electrophoresis Unit & Power Supply.
- Ethidium Bromide or SYBR Safe (Post-staining): For visualization of nucleic acids if using unlabeled probes.
Methodology:
- Gel Solution Preparation: Weigh 0.45 g of agarose (for a 1.5% gel) into a flask. Add 30 mL of 0.5X TBE buffer.
- Melting: Heat in a microwave until the agarose is completely dissolved. Swirl intermittently. Let the solution cool to ~50-60°C (lukewarm to touch).
- Casting: Pour the agarose into a horizontal casting tray with a comb in place. Allow to solidify for 20-30 minutes at room temperature.
- Electrophoresis Setup: Place the gel in the horizontal tank. Submerge it completely in 0.5X TBE running buffer (pre-chilled to 4°C).
- Sample Loading: Mix binding reactions with loading dye. Load into submerged wells.
- Run Conditions: Run at low constant voltage (5-10 V/cm of gel length) in a cold room (4°C) to minimize complex dissociation due to Joule heating.
Visualizing the Decision Pathway
Title: EMSA Gel Matrix Selection Decision Tree
The Scientist's Toolkit: Essential Reagents for Native EMSA Gels
| Item | Function in EMSA | Key Consideration |
|---|---|---|
| High-Purity Acrylamide/Bis | Forms the polyacrylamide matrix. Pore size controlled by total monomer (%T) and crosslinker ratio (%C). | Use electrophoresis-grade. 29:1 (acrylamide:bis) is common for native gels. Handle as a neurotoxin. |
| TEMED & APS | Catalytic system for free-radical polymerization of acrylamide. | Fresh APS solution (<1 week old) ensures reliable polymerization. |
| Low-EEO Agarose | Forms the agarose gel matrix. Low ElectroEndoOsmosis (EEO) minimizes buffer ion flow for sharper bands. | Essential for high-resolution native gels. Standard agarose has high EEO. |
| Tris-Based Running Buffers (TB, TBE, TAE) | Maintain pH, provide conducting ions. Low ionic strength (0.5X) often used to stabilize complexes. | Must be compatible with downstream detection (e.g., salt interferes with phosphorimaging). |
| Non-denaturing Loading Dye | Increases sample density for well loading, contains inert tracking dyes to monitor migration. | Must not contain SDS or other denaturants. Glycerol or Ficoll is used. |
| Poly(dI:dC) / Carrier DNA | Non-specific competitor DNA added to binding reactions to reduce non-specific protein-probe interactions. | Titration is crucial. Too little causes smearing; too much can compete for specific binding. |
| Cold Room & Recirculating Chiller | Maintains electrophoresis apparatus at 4°C during the run. | Critical for stabilizing weak or labile protein-nucleic acid complexes during separation. |
Within the broader thesis investigating How does EMSA detect protein-nucleic acid interactions?, Step 5 is the critical analytical phase where the electrophoretically separated complexes are immobilized, visualized, and measured. This step translates the physical separation achieved in the gel into quantitative and qualitative data on binding affinity, specificity, and stoichiometry. The efficiency and accuracy of transfer, detection, and quantification directly determine the validity of the conclusions drawn about the interaction under study.
Technical Guide
Transfer: Capillary Blotting vs. Electrophoretic Transfer
The separated complexes must be transferred from the fragile native polyacrylamide gel onto a robust membrane for subsequent handling and detection.
Detailed Protocol: Capillary Blotting (for low-throughput analysis)
- Materials: Stack of blotting paper, nylon or nitrocellulose membrane, glass plate, weight (~500g), 20x SSC transfer buffer (3 M NaCl, 0.3 M sodium citrate, pH 7.0).
- Procedure:
- Disassemble the EMSA gel apparatus and carefully remove the gel.
- Pre-wet the membrane in deionized water, then equilibrate in 20x SSC.
- Construct a transfer stack: Place a wick (blotting paper soaked in 20x SSC) on a glass plate. Place the gel on the wick, ensuring no air bubbles.
- Place the pre-wetted membrane precisely on top of the gel.
- Layer 5-10 sheets of dry blotting paper, then a stack of paper towels (~5 cm), a glass plate, and the weight.
- Allow capillary transfer to proceed for 4-16 hours.
- Principle: Buffer moves from the reservoir through the gel by capillary action, carrying nucleic acids (and bound proteins) onto the membrane, where they bind.
Detailed Protocol: Semi-Dry Electrophoretic Transfer (recommended for efficiency)
- Materials: Semi-dry blotter, transfer buffer (e.g., 0.5x TBE or Tris-glycine), Whatman paper.
- Procedure:
- Pre-soak the gel, membrane, and Whatman papers in transfer buffer.
- Assemble the "transfer sandwich" on the anode plate: anode → 3 sheets of buffer-soaked Whatman paper → membrane → gel → 3 sheets of buffer-soaked Whatman paper → cathode.
- Exclude all air bubbles by rolling a glass pipette over each layer.
- Transfer at a constant current of 1-2 mA per cm² of membrane area for 30-60 minutes.
- Principle: An electric field drives negatively charged nucleic acid-protein complexes from the gel onto the positively charged nylon membrane (for native northern blotting) or provides efficient contact transfer.
Table 1: Comparison of Transfer Methods
| Method | Time | Efficiency | Complexity | Best For |
|---|---|---|---|---|
| Capillary Blotting | 4-16 hours | Moderate to High | Low, passive | Low-throughput, delicate complexes |
| Semi-Dry Electrophoretic | 0.5-1.5 hours | High | Moderate | High efficiency, routine use |
| Tank Electrophoretic | 1-2 hours | Very High | High | Large format gels, high protein retention |
Detection of Shifted Complexes
Detection depends on the label incorporated into the nucleic acid probe.
Detailed Protocol: Chemiluminescence Detection (for biotinylated probes)
- Crosslinking: After transfer, UV-crosslink the nucleic acid to the membrane (1200 J/m²).
- Blocking: Incubate membrane in blocking buffer (e.g., 5% non-fat dry milk in TBST) for 1 hour.
- Probe Incubation: Incubate with Streptavidin-Horseradish Peroxidase (SA-HRP) conjugate (1:10,000 to 1:20,000 in blocking buffer) for 1 hour at room temperature.
- Washing: Wash membrane 4 x 5 minutes with TBST.
- Substrate Incubation: Incubate with enhanced chemiluminescence (ECL) substrate for 5 minutes.
- Imaging: Expose to a digital CCD imager or X-ray film. Signal intensity is proportional to probe amount in the complex.
Detailed Protocol: Radioisotopic Detection (for ³²P-labeled probes)
- Drying: The wet membrane (post-transfer) is blotted dry and sealed in a plastic wrap.
- Direct Exposure: Place the membrane in a phosphorimager cassette with a storage phosphor screen.
- Acquisition: Expose for 15 minutes to several hours, then scan the screen with a phosphorimager laser scanner. This method offers a wide linear dynamic range for quantification.
Table 2: Detection Modalities Comparison
| Label | Sensitivity | Resolution | Safety & Waste | Linear Dynamic Range |
|---|---|---|---|---|
| ³²P (Radioisotope) | Very High (zeptomoles) | Excellent | Requires strict regulation | >10⁵ |
| Biotin/Chemilum. | High (attomoles) | Very Good | Safe, non-radioactive | ~10⁴ |
| Fluorophores | Moderate | Good | Safe | ~10³ |
| Digoxigenin | High | Very Good | Safe | ~10⁴ |
Quantification of Binding
Quantification involves measuring the signal intensity of shifted bands to derive binding parameters.
Detailed Protocol: Digital Quantification via Phosphor/CCD Imaging
- Image Acquisition: Capture a digital image (TIFF format) with a phosphorimager or CCD camera, ensuring no pixel saturation.
- Background Subtraction: Use analysis software (ImageJ, ImageQuant, AIDA) to define and subtract local background from each band.
- Band Volume Analysis: Define regions of interest (ROIs) around each band (free probe and shifted complexes). Measure the integrated intensity (volume) of each ROI.
- Data Normalization: Correct for differences in probe labeling efficiency by expressing the intensity of the shifted complex as a fraction of the total lane intensity (complex + free probe).
- Fraction Bound = I_complex / (I_complex + I_free probe)
- Binding Curve & K_d Apparent: For titration experiments (constant probe, increasing protein), plot Fraction Bound vs. protein concentration. Fit the data to a non-linear regression one-site specific binding model to determine the apparent equilibrium dissociation constant (K_d).
Table 3: Key Quantitative Outputs from EMSA
| Parameter | Description | How it's Derived | Biological Significance |
|---|---|---|---|
| Fraction Bound | Proportion of probe in complex | I_complex / I_total | Measures binding extent under given conditions. |
| Apparent K_d | Concentration of protein at half-maximal binding | Non-linear fit of binding isotherm | Affinity of the interaction. Lower K_d = tighter binding. |
| Stoichiometry | Number of protein molecules per nucleic acid | Supershift or multi-band analysis; or protein titration. | Reveals oligomeric state of the binding complex. |
| Specificity (IC₅₀) | Competitor concentration for 50% inhibition | Competition EMSA with unlabeled specific/nonspecific oligos. | Measures binding specificity and relative affinities. |
Experimental Workflow Diagram
Title: EMSA Step 5: Transfer, Detection, Quantification Workflow
The Scientist's Toolkit: Key Research Reagent Solutions
Table 4: Essential Materials for Step 5
| Item | Function & Rationale | Example/Specification |
|---|---|---|
| Positively Charged Nylon Membrane | Robust support for nucleic acid immobilization via electrostatic interaction after capillary or electroblotting. Essential for subsequent detection steps. | Hybond-N+, Amersham Protran |
| Semi-Dry Blotting Apparatus | Provides efficient, rapid electrophoretic transfer of complexes from gel to membrane using minimal buffer. | Bio-Rad Trans-Blot SD, Hoefer TE 77 |
| Streptavidin-HRP Conjugate | High-affinity binding to biotinylated probes. HRP enzyme catalyzes chemiluminescent reaction for sensitive, non-radioactive detection. | Thermo Fisher Scientific #21126 |
| Enhanced Chemiluminescence (ECL) Substrate | HRP substrate that produces sustained, high-intensity light emission upon oxidation, captured by film or digital imager. | SuperSignal West Dura, Clarity Max |
| Phosphorimager & Storage Screens | Digital capture of radioisotopic or luminescent signals. Offers superior linear dynamic range and quantitative accuracy over film. | GE Amersham Typhoon, Bio-Rad ChemiDoc MP |
| Image Analysis Software | Enables precise background subtraction, band volume integration, and generation of binding curves from digital images. | ImageQuant TL, ImageJ (Fiji), AIDA Image Analyzer |
| Blocking Agent (e.g., Casein) | Prevents non-specific adsorption of detection reagents (e.g., SA-HRP) to the membrane, reducing background noise. | Blocking Buffer for Fluorescent Blots, 5% Non-Fat Dry Milk |
| Crosslinker (UV Chamber) | Covalently attaches nucleic acids to the nylon membrane post-transfer, preventing loss during stringent washing steps. | UV Stratalinker 2400 |
This whitepaper details key applications of the Electrophoretic Mobility Shift Assay (EMSA) in studying protein-nucleic acid interactions, framed within the broader thesis of understanding how EMSA detects these critical molecular events. EMSA, also known as a gel shift assay, remains a cornerstone technique for verifying and quantifying interactions between proteins and DNA or RNA in vitro. Its principle relies on the observation that a protein-nucleic acid complex migrates more slowly through a non-denaturing polyacrylamide or agarose gel than the free nucleic acid probe.
Core Applications in Molecular Research
Studying Transcription Factor (TF) Binding
EMSA is the definitive assay for establishing that a purified or recombinant protein binds specifically to a putative DNA consensus sequence. It is used to confirm binding kinetics, specificity (via competition experiments), and the effects of mutations in the DNA binding site or the protein's DNA-binding domain.
Analyzing DNA-Protein Interactions in Repair
In DNA repair pathways, EMSA is employed to study the assembly of repair complexes on damaged DNA substrates. It can demonstrate the sequential binding of repair proteins (e.g., in nucleotide excision repair or base excision repair) and the conformational changes induced upon binding.
Characterizing RNA-Binding Proteins (RBPs)
For RBPs, EMSA identifies binding to specific RNA motifs, determines binding affinity and stoichiometry, and investigates the impact of RNA secondary structure on protein interaction, which is crucial for post-transcriptional regulation.
The detection hinges on the separation of free labeled nucleic acid from protein-bound complex. The shift in mobility is influenced by the molecular weight, charge, and conformational change upon binding. Supershift assays, using an antibody against the protein, provide confirmatory evidence of the protein's identity in the complex.
Table 1: Typical EMSA Experimental Parameters and Outcomes
| Parameter | Transcription Factor Study | DNA Repair Complex Study | RNA-Binding Protein Study |
|---|---|---|---|
| Typical Probe Length | 20-30 bp dsDNA | 30-100 bp dsDNA (may contain lesion) | 50-500 nt RNA |
| Gel Type | 4-6% Polyacrylamide | 3.5-5% Polyacrylamide | 2-4% Agarose or 4-6% Polyacrylamide |
| Electrophoresis Buffer | 0.5x TBE, low ionic strength | 0.5x TBE or specific repair buffer | 0.5x TBE, may include Mg2+ |
| Key Competition Control | Unlabeled specific & mutant oligonucleotide | Unlabeled damaged & undamaged DNA | Unlabeled specific & scrambled RNA |
| Quantifiable Output | Fraction of probe bound (Kd app) | Stoichiometry of complex assembly | Apparent binding affinity (Kd) |
| Detection Limit | Low nM to pM range for high-affinity TFs | Dependent on complex stability | Varies with RBP; often nM range |
Table 2: Example Binding Affinities (Kd) Determined by EMSA
| Protein Target | Nucleic Acid Probe | Reported Apparent Kd (nM)* | Biological Context |
|---|---|---|---|
| p53 Tumor Suppressor | DNA consensus site | ~1-10 nM | Transcription Factor |
| APE1 | THF Abasic Site DNA | ~0.5 nM | Base Excision Repair |
| HuR (ELAVL1) | ARE-containing RNA | ~10-50 nM | mRNA Stability Regulation |
| NF-κB p50 | κB site DNA | ~5 nM | Immune Response Transcription |
*Note: Values are illustrative from recent literature; actual Kd is condition-dependent.
Detailed Experimental Protocols
Protocol 1: Basic EMSA for Transcription Factor Binding
Materials: Purified protein, double-stranded 32P- or fluorescent-end-labeled DNA probe, binding buffer (10 mM HEPES, pH 7.9, 50 mM KCl, 1 mM DTT, 2.5 mM MgCl2, 10% glycerol, 0.1% NP-40), poly(dI:dC) nonspecific competitor, non-denaturing 5% polyacrylamide gel, 0.5x TBE running buffer.
- Binding Reaction: Combine on ice: 1-10 fmol labeled probe, 1-2 µg poly(dI:dC), protein sample (serially diluted for Kd estimation), and binding buffer to 20 µL. Include a no-protein control.
- Incubation: Incubate at room temperature or 4°C for 20-30 minutes.
- Electrophoresis: Pre-run gel in 0.5x TBE at 100V for 30-60 min at 4°C. Load samples (add loading dye without SDS) under running voltage. Run at 100-150V until dye front migrates appropriately.
- Detection: For radioactive probes, expose gel to phosphorimager screen. For fluorescent probes, use appropriate gel imaging system.
- Competition Assay: Include reactions with 50-200x molar excess of unlabeled specific or mutant competitor DNA added prior to the protein.
Protocol 2: Supershift EMSA for Complex Identification
Follow Protocol 1, but after the initial binding incubation, add 1-2 µg of a specific antibody (or control IgG) to the reaction and incubate for an additional 30-60 minutes on ice before loading the gel. A further retardation ("supershift") confirms the presence of the target protein in the complex.
Protocol 3: EMSA for RNA-Protein Interactions
Key Modifications: Use RNase-free reagents and tubes. Include RNase inhibitors (e.g., RNasin) in the binding buffer. The nonspecific competitor is often yeast tRNA or a nonspecific RNA. Gel electrophoresis is often performed at 4°C to maintain complex stability.
Visualizing EMSA Workflows and Relationships
Title: EMSA Core Workflow, Applications, and Controls
Title: EMSA Detection Logic from Thesis to Data
The Scientist's Toolkit: EMSA Research Reagent Solutions
Table 3: Essential Materials for EMSA Experiments
| Reagent/Material | Function & Importance | Key Considerations |
|---|---|---|
| Purified Protein | The protein of interest (full-length or DNA/RNA-binding domain). | Purity is critical to avoid non-specific shifts; can be recombinant or native. |
| Labeled Nucleic Acid Probe | High-specific-activity DNA or RNA for detection. | Common labels: 32P (γ-ATP), fluorescent dyes (Cy5, FAM), or biotin for chemiluminescence. |
| Non-Specific Competitor DNA/RNA | Suppresses non-specific protein-probe interactions. | Poly(dI:dC) for DNA probes; yeast tRNA or non-specific RNA for RNA probes. |
| EMSA Binding Buffer | Optimized buffer to promote specific binding. | Contains salt, buffering agent, glycerol, DTT, and often non-ionic detergent. |
| Non-Denaturing Gel Matrix | Medium for separation of complex from free probe. | Polyacrylamide (higher resolution) or agarose (for very large complexes). |
| Electrophoresis Buffer (e.g., 0.5x TBE) | Conducts current and maintains pH during run. | Low ionic strength stabilizes weak interactions; often run at 4°C. |
| Specific & Mutant Cold Competitors | Unlabeled oligonucleotides to confirm binding specificity. | >50x molar excess of specific competitor should abolish shift; mutant should not. |
| Specific Antibodies | For supershift assays to identify complex components. | Must recognize native protein epitope; control IgG is mandatory. |
| Gel Imaging System | Detects the shifted complex signal. | Phosphorimager (32P), fluorescence scanner, or chemiluminescence imager (biotin). |
Within the broader thesis on How does EMSA detect protein-nucleic acid interactions, the electrophoretic mobility shift assay (EMSA) stands as a foundational, qualitative technique. It confirms interaction through the observation of a mobility shift of a labeled nucleic acid probe upon protein binding. To transform EMSA from a simple detection tool into a powerful analytical method for identification and validation, advanced variations such as supershift and competition assays are essential. This guide details their application for definitive protein identification and rigorous specificity verification, crucial for researchers, scientists, and drug development professionals.
Core Technical Guide
The Supershift Assay: Definitive Protein Identification
A standard EMSA confirms an interaction but leaves the identity of the binding protein ambiguous. The supershift assay resolves this by introducing an antibody into the binding reaction.
Principle: An antibody specific to the suspected DNA/RNA-binding protein is pre-incubated with the protein extract before adding the labeled probe. If the suspected protein is present in the complex, the antibody binds to it, forming an even larger ternary complex (protein-nucleic acid-antibody). This results in a further reduction in electrophoretic mobility—a "supershifted" band—providing definitive identification. A control, non-specific antibody should not cause this supershift.
Detailed Protocol: Supershift Assay
- Prepare Binding Reactions: Set up standard EMSA binding reactions (detailed in base protocol) for your protein extract and labeled probe.
- Antibody Incubation: To the experimental tubes, add 1-2 µg of the specific antibody (monoclonal or affinity-purified polyclonal). To a control tube, add an equivalent amount of an isotype-matched non-specific antibody.
- Pre-incubation: Incubate the protein extract with the antibody on ice for 30-60 minutes before adding the labeled nucleic acid probe. This allows antibody-protein binding.
- Probe Addition & Completion: Add the labeled probe and complete the binding reaction as per standard EMSA (typically 20-30 minutes at room temperature).
- Electrophoresis & Detection: Load the reactions onto a non-denaturing polyacrylamide gel, run under cold conditions, and visualize the shifted complexes.
The Competition Assay: Specificity Verification
To verify that the observed protein-nucleic acid interaction is sequence- or structure-specific, competition assays are performed.
Principle: An unlabeled competitor nucleic acid is included in the binding reaction in molar excess. If the competitor is identical to the labeled probe ("specific" competitor), it will compete for binding to the protein. This leads to a decrease in the intensity of the shifted band, as the protein is titrated away from the labeled probe. If an unrelated, non-specific competitor is used, it should not diminish the shifted band. This confirms the specificity of the interaction.
Detailed Protocol: Competition Assay
- Prepare Competitors: Synthesize unlabeled oligonucleotides: one identical to the probe (specific competitor) and one with a mutated binding site or unrelated sequence (non-specific competitor).
- Set Up Reaction Series: Prepare a master binding mix containing protein extract and buffer. Aliquot into a series of tubes.
- Titrate Competitor: To the tubes, add increasing molar excesses (e.g., 5x, 25x, 125x) of either specific or non-specific unlabeled competitor. Include a no-competitor control.
- Pre-incubate: Incubate protein and competitor on ice for 15 minutes. This allows the protein to bind the unlabeled nucleic acid.
- Add Labeled Probe: Add a constant amount of the labeled probe to all tubes and complete the binding reaction.
- Electrophoresis & Quantification: Run EMSA. Quantify band intensities to generate a competition curve.
Data Presentation: Quantitative Analysis Tables
Table 1: Supershift Assay Results Interpretation
| Band Observed | Interpretation | Conclusion |
|---|---|---|
| Complete supershift | Antibody binds to protein in complex, halting all probe migration in original shifted band. | Target protein confirmed as a component of the complex. |
| Partial supershift | Antibody binds to a subset of complexes; may indicate multiple proteins or epitope masking. | Target protein is present, but other proteins may also bind. |
| No supershift, shifted band remains | Antibody did not bind to protein in complex. Protein not present or epitope inaccessible. | Target protein is not a major component of the complex. |
| Loss of all shifted bands | Antibody disrupts protein-DNA interaction or protein structure. | Inconclusive for identification; suggests antibody interferes. |
Table 2: Competition Assay Typical Data
| Competitor Type | Molar Excess (fold) | Shifted Band Intensity (% of control) | Interpretation |
|---|---|---|---|
| None (Control) | 0 | 100% | Baseline binding. |
| Specific | 5 | 40-60% | Effective competition, confirming specificity. |
| Specific | 25 | 5-20% | Nearly complete competition. |
| Specific | 125 | <5% | Total competition. |
| Non-specific | 125 | 85-110% | No competition; confirms lack of non-specific binding. |
Mandatory Visualizations
The Scientist's Toolkit: Research Reagent Solutions
Table 3: Essential Materials for Advanced EMSA Variations
| Reagent / Material | Function in Experiment | Key Considerations |
|---|---|---|
| High-Affinity, Specific Antibodies | Induces supershift for protein identification. Must recognize native protein epitope. | Use monoclonal or affinity-purified polyclonal. Test for non-disruptive binding. |
| Unlabeled Competitor Oligonucleotides | Competes for binding to verify specificity. | Specific competitor must match probe sequence. Non-specific should be scrambled or mutated. |
| Non-specific Carrier DNA (e.g., poly(dI:dC)) | Blocks non-specific protein-nucleic acid interactions. | Optimal amount must be titrated to reduce background without inhibiting specific binding. |
| Chemiluminescent or Fluorescent Nucleic Acid Labels | Enables sensitive detection of shifted complexes. | Allows for non-radioactive workflow. Fluorescent labels enable multiplexing. |
| High-Purity, Non-denaturing Gel Systems | Matrix for separation of complexes based on size/charge. | Acrylamide:bis ratio and gel porosity critical for resolving supershifted complexes. |
| Precision Pipettes & Cold Blocks | Ensures accurate reagent dispensing and maintains complex stability. | Cold blocks (4°C) are essential for incubations to prevent protein degradation. |
Optimizing Your EMSA Assay: Common Pitfalls, Solutions, and Expert Tips
Within the broader thesis on How does EMSA detect protein-nucleic acid interactions, a persistent challenge is the occurrence of weak or absent electrophoretic mobility shifts. This whitepaper provides an in-depth technical guide to systematically diagnose and rectify this issue, focusing on enhancing the fundamental binding affinity of the interaction and the subsequent signal strength of the assay.
Diagnosing the Root Cause
Weak or no shift in an EMSA can stem from issues related to the interaction itself (affinity) or the detection method (signal). The following table categorizes primary causes.
Table 1: Diagnostic Table for Weak/No EMSA Shift
| Category | Potential Cause | Key Indicator |
|---|---|---|
| Binding Affinity | Suboptimal binding buffer (pH, ions, cofactors) | Shift inconsistent across buffer conditions. |
| Protein degradation or misfolding | Shift degrades with older protein preps. | |
| Incorrect protein:nucleic acid ratio | Shift appears/disappears at extreme ratios. | |
| Nucleic acid probe issue (impurity, secondary structure) | Poor labeling efficiency or smeared free probe. | |
| Signal Strength | Insensitive detection method (low specific activity) | High background, faint bands. |
| Probe degradation or radiolabel decay | Signal decreases over time irrespective of binding. | |
| Inadequate electrophoresis conditions (pH, temp, gel porosity) | Smearing, poor complex resolution. |
Core Strategies for Enhancement
Optimizing Binding Affinity
Experimental Protocol: Comprehensive Buffer Screening
- Objective: Identify optimal ionic strength, pH, and essential cofactors.
- Methodology:
- Prepare a master mix of purified protein and labeled nucleic acid probe.
- Aliquot into tubes containing pre-mixed binding buffers. Systematically vary:
- pH: Use buffers from 6.0 to 8.5 (e.g., HEPES, Tris).
- Monovalent ions: KCl or NaCl from 0 to 200 mM.
- Divalent ions: MgCl₂ or ZnCl₂ from 0 to 10 mM.
- Cofactors: Add 1-5 mM of ATP, GTP, or other relevant nucleotides.
- Carrier/Stabilizers: Test 0-100 µg/mL BSA, 0.01-0.1% NP-40, 5-10% glycerol.
- Incubate at optimal temperature (4°C-25°C) for 20-30 minutes.
- Load all reactions on a pre-run, non-denaturing polyacrylamide gel.
- Analyze for improved complex formation and reduced non-specific binding.
Table 2: Quantitative Effects of Common Buffer Additives on Shift Intensity
| Additive | Typical Concentration Range | Primary Function | Observed Impact on Shift (Typical) |
|---|---|---|---|
| KCl | 50 - 150 mM | Modulates electrostatic interactions | Optimal range sharpens shift; >200 mM often disruptive. |
| MgCl₂ | 1 - 5 mM | Stabilizes nucleic acid structure; essential cofactor | Can be critical for shift; absence causes >80% loss in some systems. |
| DTT | 1 - 5 mM | Reductant, preserves protein cysteine residues | Prevents smear; >10 mM may reduce disulfide-dependent binding. |
| Glycerol | 5 - 10% (v/v) | Stabilizes protein; aids loading | Increases complex stability by ~20-30% in some cases. |
| Poly(dI-dC) | 0.05 - 0.2 µg/µL | Non-specific competitor DNA | Reduces non-specific background; excess (>0.5 µg/µL) can compete specific shift. |
Enhancing Signal Strength
Experimental Protocol: Probe Labeling Optimization & EMSA Sensitivity Boost
- A. High-Specific-Activity Probe Preparation (End-labeling):
- Dephosphorylate 1-10 pmol of nucleic acid probe with Antarctic Phosphatase.
- Label using T4 Polynucleotide Kinase and [γ-³²P]ATP (or γ-³²P-ATP). For non-radioactive detection, use biotin- or fluorophore-conjugated ATP.
- Purify labeled probe using a spin column (e.g., Sephadex G-25) to remove unincorporated nucleotides.
- B. EMSA with Supershifts & Cold Competition:
- Set up optimal binding reaction as determined from buffer screening.
- For supershifts, add 0.5-2 µg of specific antibody targeting the DNA-binding protein after initial complex formation. Incubate further 15-20 mins.
- For specificity confirmation, include a 50-200 fold molar excess of unlabeled, identical ("cold specific") or mutant ("cold non-specific") competitor probe.
- Run EMSA on a low-ionic-strength gel (0.5x TBE) at 4°C to stabilize weak complexes.
- For sensitive detection: Use phosphorimaging (radioactive) or chemiluminescence with streptavidin-HRP (biotin).
The Scientist's Toolkit: Research Reagent Solutions
Table 3: Essential Reagents for Robust EMSA
| Reagent / Kit | Function / Purpose |
|---|---|
| Recombinant Protein Purification System (e.g., His-tag, GST-tag) | Provides high-purity, functional protein for binding studies. |
| T4 Polynucleotide Kinase & [γ-³²P]ATP | Standard for high-sensitivity radiolabeling of nucleic acid probes. |
| Biotin 3'-End DNA Labeling Kit | Non-radioactive, safe alternative for probe labeling; detected via chemiluminescence. |
| Chemiluminescent Nucleic Acid Detection Module | For visualizing biotin-labeled probes on membranes (high sensitivity, long shelf-life). |
| Non-denaturing Polyacrylamide Gel Electrophoresis System | Matrix for separating protein-nucleic acid complexes based on size/charge. |
| Poly(dI-dC)·(dI-dC) | Inert polymeric DNA used as a non-specific competitor to reduce background. |
| Specific Antibody (for Supershift) | Confirms protein identity in complex and can stabilize shift. |
| Phosphor Storage Screens & Imager | Critical for quantitative, high-resolution detection of radioactive signals. |
Visualizing the Troubleshooting Pathway and Core EMSA Workflow
Successfully troubleshooting weak EMSA shifts requires a methodical approach that decouples binding affinity from signal detection issues. By systematically optimizing binding conditions through rigorous buffer and component screening, and subsequently employing high-sensitivity detection methodologies, researchers can reliably convert elusive interactions into robust, quantifiable shifts. This process not only validates specific protein-nucleic acid interactions but also provides quantitative insights into their biochemical nature, directly contributing to the core thesis of understanding how EMSA reveals the dynamics of molecular recognition.
Within the broader thesis investigating How does EMSA detect protein-nucleic acid interactions?, a fundamental challenge is the prevalence of non-specific binding, which can obscure the detection and analysis of specific complexes. The electrophoretic mobility shift assay (EMSA) relies on the principle that a protein-nucleic acid complex migrates more slowly than the free nucleic acid probe during non-denaturing gel electrophoresis. However, nuclear and cellular extracts contain a plethora of proteins that can bind to nucleic acids with low affinity and sequence neutrality, generating false-positive or smeared signals. This whitepaper provides an in-depth technical guide on the critical use of competitor nucleic acids, such as poly(deoxyinosinic-deoxycytidylic) acid (poly dI:dC) and sheared salmon sperm DNA (ssDNA), to resolve this issue, enabling accurate interpretation of EMSA results.
The Problem of Non-Specific Binding in EMSA
Non-specific binding refers to interactions between the protein extract and the labeled probe that are not based on the specific sequence or structure of interest. These interactions are typically characterized by high capacity, low affinity, and little sequence discrimination. In an EMSA, this manifests as:
- A high background smear across the lane.
- Complete retention of the probe in the well.
- Weak or indistinguishable specific complex bands.
The core strategy to mitigate this is the inclusion of unlabeled competitor nucleic acids in the binding reaction. These competitors saturate the non-specific binding sites, allowing only the higher-affinity, sequence-specific interactions to form with the rare, labeled probe.
Key Competitors: Mechanisms and Applications
Poly dI:dC
This synthetic double-stranded polynucleotide is the most ubiquitous competitor for EMSA experiments involving double-stranded DNA probes or transcription factors.
- Mechanism: Its irregular, alternating sequence lacks specific binding sites for most sequence-specific proteins but presents a generic anionic polymer backbone that mimics DNA. It effectively titrates out proteins that interact with DNA primarily through electrostatic interactions with the phosphate backbone or those with low-sequence specificity.
- Typical Use: Essential for experiments with crude nuclear extracts and assays for most transcription factors.
Sheared Salmon Sperm DNA (ssDNA)
This is a natural, heterogeneous mixture of DNA fragments.
- Mechanism: It provides a complex mixture of sequences, competing for both non-specific electrostatic interactions and for proteins with some sequence preference that may not be perfectly matched by poly dI:dC. It is often used in combination with poly dI:dC for more comprehensive suppression.
- Typical Use: Commonly used in combination with poly dI:dC for "dirty" extracts, or in assays where non-specific binding is particularly severe.
Specific Cold Competitors
An unlabeled oligonucleotide identical to the probe serves as the ultimate control for sequence specificity.
- Mechanism: It competes for the specific protein of interest. A successful competition (disappearance of the shifted band) confirms the specificity of the protein-DNA interaction.
- Typical Use: Critical validation step in any EMSA experimental design.
Quantitative Data on Competitor Efficacy
The optimal amount of competitor is empirical and must be titrated for each new protein extract and probe. The following table summarizes generalized starting points and effects.
Table 1: Common Competitors in EMSA: Properties and Usage
| Competitor | Typical Starting Amount per 20µL Reaction | Primary Target | Effect of Insufficient Amount | Effect of Excessive Amount |
|---|---|---|---|---|
| Poly dI:dC | 0.5 - 2.0 µg | Non-specific DNA-binding proteins | High background, smear | Dissociation of specific complex |
| Sheared ssDNA | 1.0 - 5.0 µg | Broader spectrum of nucleic-acid binding proteins | Probe retained in well | Weakening of all complexes |
| Specific Cold Probe | 10x - 100x molar excess over labeled probe | Specific protein of interest | Incomplete competition | N/A (confirms specificity) |
Table 2: Example Optimization Experiment for a Nuclear Extract EMSA
| Reaction Condition | Poly dI:dC (µg) | ssDNA (µg) | Specific Complex Intensity* | Non-Specific Background* | Interpretation |
|---|---|---|---|---|---|
| 1 | 0 | 0 | Low | Very High | Non-specific binding dominates. |
| 2 | 0.5 | 0 | Medium | High | Specific complex emerges, but background persists. |
| 3 | 1.0 | 0 | High | Low | Optimal condition for this extract/probe. |
| 4 | 2.0 | 0 | Medium | Very Low | Specific complex begins to be competed away. |
| 5 | 1.0 | 2.0 | Low | Very Low | Combined competitors are too aggressive. |
*Intensity rated qualitatively: Very High, High, Medium, Low, Very Low.
Detailed Experimental Protocol: EMSA with Competitor Titration
Objective: To establish the optimal amount of poly dI:dC competitor for detecting a specific protein-DNA complex using a nuclear extract.
Materials: (See "The Scientist's Toolkit" below for details)
- Labeled DNA probe (e.g., 32P-end-labeled)
- Nuclear protein extract
- Poly dI:dC competitor stock (1 µg/µL)
- EMSA binding buffer (10 mM HEPES, 50 mM KCl, 1 mM DTT, 2.5% Glycerol, 0.05% NP-40, pH 7.9)
- Non-denaturing polyacrylamide gel (4-6%) and TBE running buffer
Methodology:
- Prepare Binding Reactions: Set up 5-10 identical 20µL reactions on ice, each containing:
- Constant amounts of binding buffer, labeled probe (~20 fmol), and nuclear extract (2-10 µg).
- A varying amount of poly dI:dC competitor (e.g., 0, 0.25, 0.5, 1.0, 2.0, 4.0 µg) from the stock.
- Incubate: Mix gently and incubate at room temperature for 20-30 minutes.
- Electrophoresis: Load reactions directly onto a pre-run non-denaturing polyacrylamide gel in 0.5x TBE buffer. Run at 100-150 V at 4°C until the free probe has migrated ~2/3 down the gel.
- Visualization: Dry the gel and expose it to a phosphorimager screen or X-ray film.
Analysis: Identify the lane where the intensity of the discrete, shifted (specific) band is maximized while the background smear or well retention is minimized. This lane indicates the optimal competitor concentration.
The Scientist's Toolkit: Key Reagents for EMSA
Table 3: Essential Research Reagent Solutions for EMSA with Competitors
| Reagent | Function & Importance in Resolving Non-Specific Binding |
|---|---|
| Poly dI:dC | The first-line synthetic competitor; absorbs proteins that bind generically to the DNA backbone. |
| Sheared Salmon Sperm DNA | Natural DNA competitor; used alone or with poly dI:dC to quench a broader range of non-specific binders. |
| Specific Unlabeled Oligonucleotide | "Cold" probe used in competition assays to definitively prove binding specificity. |
| Non-denaturing Polyacrylamide Gel | Matrix for separating protein-DNA complexes based on size/shift without disrupting weak interactions. |
| High-Specific-Activity 32P or CY5-labeled Probe | Provides the sensitive, detectable signal for the nucleic acid of interest. Low specific activity increases noise. |
| Nuclear Extraction Kit/Buffers | To prepare protein extracts enriched for DNA-binding proteins like transcription factors. |
| EMSA Binding Buffer (10X) | Provides optimal ionic strength, pH, and carrier agents (glycerol, NP-40) for complex formation. |
Visualizing the Role of Competitors in EMSA
Diagram 1: Competitor action in an EMSA binding reaction.
Diagram 2: Key steps in an EMSA competitor optimization experiment.
This guide provides technical solutions for common Electrophoretic Mobility Shift Assay (EMSA) challenges, framed within the thesis research context: How does EMSA detect protein-nucleic acid interactions? EMSA detects interactions by observing the reduced electrophoretic mobility of a nucleic acid probe when bound by a protein. Probe degradation and unclear band patterns are primary obstacles to obtaining clean, interpretable data, directly impacting the assay's validity in characterizing these interactions.
I. Quantitative Analysis of Common EMSA Issues
Table 1: Common Sources of Probe Degradation and Impact on Band Clarity
| Issue Source | Typical Manifestation | Quantitative Impact on Signal | Suggested Mitigation |
|---|---|---|---|
| Nuclease Contamination | Smearing below the free probe band; complete loss of signal. | Can degrade >90% of probe in minutes. | Use RNase-free/DNase-free reagents; add 0.5-1.0 U/µL RNasin or 1 mM DTT for RNase inhibition. |
| Radiolysis of [³²P]-Probe | Multiple smeared bands or high background across the lane. | Significant after 2-3 half-lives (~14-21 days for ³²P). | Use probe within 2-3 days of labeling; store at -20°C with shielding. |
| Chemical Degradation (OH⁻) | Probe fragmentation, leading to a faint or missing free probe band. | High pH (>9) can hydrolyze RNA in hours. | Store probes in TE buffer (pH 7.5-8.0) at -80°C; use nuclease-free Tris-EDTA. |
| Shear Force (for long probes) | Random fragmentation, causing a smear. | More prevalent with probes >500 bp. | Avoid vigorous pipetting/vortexing; use wide-bore tips. |
Table 2: Factors Contributing to Unclear Band Patterns
| Factor | Band Pattern Symptom | Optimal Range/Condition | Adjustment Strategy |
|---|---|---|---|
| Protein Purity & Activity | Non-specific smearing, high background. | >90% purity; verify activity via independent assay. | Increase purity (affinity tag); titrate protein (0.1-10 µg/reaction). |
| Binding Buffer Ionic Strength | No shift (too high); non-specific shifts (too low). | KCl 50-100 mM; NaCl 40-100 mM. | Titrate salt (50-200 mM) to optimize specificity. |
| Non-specific Competitor DNA | High background in shifted band; trapped wells. | Poly(dI·dC): 0.05-0.1 µg/µL for nuclear extracts. | Titrate (0.01-0.2 µg/µL); use specific competitor (unlabeled probe) for confirmation. |
| Gel Percentage & Porosity | Poor resolution of complex vs. free probe. | 4-6% acrylamide:bis (29:1 or 37.5:1) for most complexes. | Increase % for small complexes; decrease % for large complexes. |
| Electrophoresis Temperature | "Breathing" of complexes, leading to diffuse bands. | 4°C is standard for labile complexes. | Pre-run and run gel in cold room (4°C) with buffer recirculation. |
| EMSA Probe Labeling Efficiency | Faint bands, poor sensitivity. | Specific activity > 1 x 10⁸ cpm/µg for ³²P. | Purify probe post-labeling (spin column/gel filtration); verify incorporation. |
II. Detailed Experimental Protocols
Protocol 1: High-Specific-Activity Probe Preparation & Cleanup (End-Labeling) Objective: Generate a non-degraded, high-specific-activity probe for EMSA.
- Phosphorylation: In a 20 µL reaction, combine: 1 µL (100 ng) of purified DNA oligo or dephosphorylated DNA fragment, 2 µL 10x T4 Polynucleotide Kinase (PNK) Buffer, 10 µL [γ-³²P]ATP (3000 Ci/mmol, 10 µCi/µL), 6 µL nuclease-free water, and 1 µL T4 PNK (10 U/µL).
- Incubation: Incubate at 37°C for 30 minutes.
- Termination: Add 2 µL of 0.5 M EDTA (pH 8.0) and heat-inactivate at 65°C for 20 minutes.
- Purification: Use a micro Bio-Spin P-30 Chromatography Column (or equivalent) pre-equilibrated with TE buffer. Load the reaction onto the column and centrifuge at 1000 x g for 4 minutes. The eluate contains the purified labeled probe.
- Quantification: Measure radioactivity of 1 µL eluate by scintillation counting. Store probe at -20°C in a shielded container; use within 3 days.
Protocol 2: Optimized EMSA Binding Reaction & Electrophoresis Objective: Achieve specific, resolvable protein-nucleic acid complexes.
- Binding Reaction: Assemble on ice (20 µL total): 4 µL 5x Binding Buffer (100 mM HEPES pH 7.9, 250 mM KCl, 25 mM MgCl₂, 5 mM EDTA, 50% Glycerol, 5 mM DTT), 1 µL Poly(dI·dC) (1 µg/µL stock), 2 µL purified protein or nuclear extract (1-10 µg), x µL unlabeled competitor DNA (if needed), and nuclease-free water to 18 µL.
- Pre-incubation: Incubate on ice for 10 minutes to allow non-specific competitor binding.
- Probe Addition: Add 2 µL of labeled probe (~20,000 cpm) and mix gently.
- Final Incubation: Incubate at room temperature (or desired temperature) for 25 minutes.
- Loading & Electrophoresis: Pre-run a 5% non-denaturing polyacrylamide gel (0.5x TBE) at 100V for 30-60 minutes at 4°C. Load samples (with 2 µL 10x loading dye without SDS) and run in 0.5x TBE buffer at 100V with buffer recirculation until the dye front migrates ⅔ of the gel length.
- Detection: Transfer gel to blotting paper, dry under vacuum, and expose to a phosphorimager screen or X-ray film.
III. Visualization of Workflows and Relationships
Title: EMSA Workflow with Key Problem Injection Points
Title: Validating Specific Interactions in EMSA
IV. The Scientist's Toolkit: Essential Research Reagent Solutions
Table 3: Key Reagents and Materials for Robust EMSA
| Reagent/Material | Function & Rationale | Key Consideration |
|---|---|---|
| T4 Polynucleotide Kinase (PNK) & [γ-³²P]ATP | End-labeling DNA/RNA probes with high-specific-activity ³²P. | Use fresh [γ-³²P]ATP; include DTT in buffer to stabilize PNK. |
| Nucleotide Removal Columns (e.g., Bio-Spin P-30) | Removes unincorporated nucleotides post-labeling, reducing background. | Essential step to purify probe and prevent smearing. |
| Poly(dI·dC) or Poly(dA·dT) | Non-specific competitor DNA that binds and titrates out non-specific nucleic acid-binding proteins. | Critical for "dirty" protein sources (e.g., nuclear extracts); requires titration. |
| RNasin Plus/SUPERasin RNase Inhibitor | Protects RNA probes from ubiquitous RNases. | Mandatory for RNA EMSA; add to all buffers and reactions. |
| Dithiothreitol (DTT) | Reducing agent that maintains protein stability and inhibits some RNases. | Use fresh stock (1M); add to binding buffer just before use. |
| High-Purity Non-denaturing Acrylamide/Bis | Forms the matrix for separation of protein-nucleic acid complexes. | Use high-purity grade to prevent free radical-induced degradation. |
| HEPES-based Binding Buffer | Provides stable pH buffering capacity during the binding reaction. | Preferable to Tris for room temperature incubation due to better pKa. |
| Specific Unlabeled Competitor Oligo | Validates binding specificity by competing for the protein's active site. | Must be identical to the probe sequence for true specificity confirmation. |
Within the broader investigation of "How does EMSA detect protein-nucleic acid interactions," the precise optimization of gel conditions is a critical, yet often underappreciated, determinant of experimental success. The Electrophoretic Mobility Shift Assay (EMSA) functions on the principle that a protein-nucleic acid complex migrates more slowly through a non-denaturing polyacrylamide or agarose gel than the free nucleic acid probe. The stability of this complex during electrophoresis is not inherent; it is profoundly influenced by the gel's electrophoretic environment—specifically its pH, ionic strength, and the run temperature. Suboptimal conditions can lead to complex dissociation (false negatives) or the promotion of non-specific interactions (false positives). This guide provides an in-depth technical framework for systematically optimizing these parameters to ensure the accurate detection of biologically relevant complexes.
Core Principles: How Gel Conditions Affect Complex Stability
- pH: The pH of the gel and running buffer influences the protonation state of amino acid residues on the protein and the phosphate groups on the nucleic acid. This directly affects the charge distribution and the network of ionic bonds (salt bridges) that often stabilize the interaction. Deviations from the optimal pH can reduce binding affinity or alter complex conformation.
- Ionic Strength: EMSA is typically performed in low-ionic-strength buffers (e.g., 0.5x TBE or a specific binding buffer). High ionic strength can shield the electrostatic attractions between the positively charged protein residues and the negatively charged nucleic acid backbone, leading to complex dissociation. However, a certain minimal ionic strength is required to maintain protein solubility and buffer capacity.
- Temperature: Electrophoresis temperature governs the kinetics and thermodynamics of the complex. Running gels at 4°C (cold room) is common to stabilize weak complexes by slowing dissociation kinetics. For some complexes, particularly those with large conformational changes, room temperature or higher may be necessary to observe the shift. Temperature also affects gel polymerization and porosity.
Quantitative Optimization Data
Table 1: Effect of Buffer pH on Complex Stability and Migration
| Buffer System | Typical pH Range | Optimal pH for Most EMSA | Effect on Complex | Notes |
|---|---|---|---|---|
| Tris-Glycine | 8.3 - 9.5 | 8.5 | Provides sharp bands; high pH may denature some complexes. | Common for native PAGE. High pH can deprotonate nucleic acids. |
| Tris-Borate-EDTA (TBE) | 8.0 - 8.5 | 8.3 | Standard, robust buffering. Borate can interact with some sugars. | Most common for DNA-protein EMSA. Use 0.5x concentration. |
| Tris-Acetate-EDTA (TAE) | 7.5 - 8.0 | 7.8 | Lower ionic strength than TBE. | Can be used for very large complexes or to reduce heat. |
| HEPES-KOH | 7.0 - 7.5 | 7.2 | Mimics physiological pH for sensitive complexes. | Useful for protein-RNA complexes sensitive to alkaline pH. |
Table 2: Effect of Ionic Strength (Buffer Concentration) on EMSA Resolution
| Buffer | Common Working Conc. | Conductivity/Heat Generation | Impact on Specific vs. Non-specific Binding | Recommended Use Case |
|---|---|---|---|---|
| 0.5x TBE | 44.5 mM Tris, 44.5 mM Boric Acid, 1 mM EDTA | Moderate | Good suppression of non-specific binding. | Standard for DNA-protein EMSA. Optimal sharpness for most applications. |
| 1x TBE | 89 mM Tris, 89 mM Boric Acid, 2 mM EDTA | High (can cause overheating) | May disrupt weak specific complexes. | Avoid for standard EMSA; used for dsDNA analysis. |
| 6x Native Gel Buffer* | Proprietary (e.g., Novex) | Low | Optimized for protein stability. | Commercial pre-cast gels for sensitive protein complexes. |
| Low-Ionic Hepes Buffer | e.g., 10 mM HEPES, 1 mM MgCl₂ | Very Low | Maximizes electrostatic interactions; high non-specific risk. | Used in in vitro binding buffers, not typically for running gel. |
*Commercial formulations often contain stabilizing agents.
Table 3: Effect of Temperature on Complex Detection
| Temperature | Effect on Complex Kinetics | Effect on Gel Polymerization & Porosity | Typical Application |
|---|---|---|---|
| 4°C (Cold Room) | Slows dissociation rate (k_off), stabilizing weak complexes. | Can lead to slightly tighter gel matrix. Slower run. | Standard for labile or weak complexes. Reduces gel heating. |
| Room Temp (20-25°C) | Represents standard assay conditions. Moderate k_off. | Consistent, reproducible polymerization and run time. | General use for robust complexes. Convenient. |
| 30-37°C | Increases dissociation rate; may prevent detection of weak complexes. | Faster run; risk of buffer overheating and gel distortion. | Used to test thermal stability of a known complex or for thermophilic proteins. |
Experimental Protocol for Systematic Optimization
Title: A Stepwise EMSA Gel Condition Optimization Protocol
Objective: To empirically determine the optimal pH, ionic strength, and temperature for detecting a specific protein-nucleic acid complex.
Materials: Purified protein, end-labeled nucleic acid probe, polyacrylamide gel electrophoresis system, materials for 10% non-denaturing polyacrylamide gel, varying running buffers, temperature-controlled chamber or cold room.
Procedure:
Prepare Probe-Protein Complexes: In separate tubes, incubate a constant amount of labeled nucleic acid probe with your protein of interest in a standardized binding buffer (containing carrier DNA, DTT, glycerol, etc.) for 20 minutes at the binding temperature (e.g., 25°C).
Prepare Gel Matrix: Cast multiple 6-8% non-denaturing polyacrylamide gels. For pH/ionic strength tests, vary the running buffer used to cast the gel and fill the tank.
- pH Test: Cast gels with 0.5x TBE (pH 8.3), 0.5x TAE (pH ~7.8), and a Tris-Glycine system (pH 9.0).
- Ionic Strength Test: Cast gels with 0.25x, 0.5x, and 1x TBE.
- Temperature Test: Use the optimal buffer from above, and run identical gels at 4°C, 25°C (using a cooling coil if necessary), and 30°C.
Pre-run Gels: Pre-electrophorese each gel in its corresponding running buffer for 30-60 minutes at the intended run voltage (e.g., 100V) to establish equilibrium and remove APS radicals.
Load and Run: Load the pre-formed complexes onto the gels alongside a free probe control. Run electrophoresis at a constant voltage (e.g., 100V) until the dye front migrates an appropriate distance.
Visualize and Analyze: Transfer gels to imaging plates (for radioactivity) or use standard staining (SYBR Gold, Ethidium Bromide). Analyze the gel images for:
- Shifted Band Intensity: A stronger shifted band indicates more stable complex under those conditions.
- Band Sharpness: Sharp, discrete bands indicate homogeneous complex and good gel resolution.
- Absence of Smearing: Smearing suggests complex dissociation during the run or non-specific binding.
- Free Probe Migration: Artifacts like "bent" free probe lanes indicate buffer/gel inconsistencies.
Visualizing the Optimization Workflow
Title: EMSA Gel Condition Optimization Decision Pathway
The Scientist's Toolkit: Essential Reagents & Materials
Table 4: Key Research Reagent Solutions for EMSA Optimization
| Item | Function in Optimization | Critical Notes |
|---|---|---|
| Non-denaturing PAGE Gel Kit | Provides consistent acrylamide/bis-acrylamide, buffers, and catalysts for gel matrix formation. | Use high-purity reagents to avoid artifacts. Pre-cast gradient gels can help screen conditions. |
| 10x TBE & 50x TAE Buffers | Stock solutions for preparing running buffers at precise ionic strengths (0.25x, 0.5x, 1x). | Dilute with nuclease-free water. Check pH of final working solution. |
| HEPES-KOH (1M, pH 7.2) | For creating or supplementing running buffers at near-physiological pH. | Filter sterilize. More expensive than Tris but superior buffering at pH 7-8. |
| Temperature-Controlled Electrophoresis Unit | Allows precise regulation of run temperature (4°C to 37°C). | Essential for rigorous temperature optimization. A cold room is a minimum requirement. |
| SYBR Gold Nucleic Acid Gel Stain | Ultra-sensitive fluorescent stain for detecting free and bound nucleic acid probe in optimization gels. | Safer and faster than ethidium bromide; allows quantitation of band intensity. |
| Non-specific Competitor DNA (poly[dI-dC]) | Suppresses non-specific protein-probe interactions. The optimal amount is condition-dependent. | Titration (0.1-100 µg/mL) is required for each new buffer condition. |
| Glycerol (Ultra-pure) | Added to binding reactions and sometimes gel matrix to stabilize complexes and aid loading. | Typically used at 2.5-10% v/v in binding reactions. |
| Precision Plus Protein Native Marker | Provides size standards for native PAGE, helping monitor run consistency across conditions. | Does not provide precise complex size but indicates run progress and gel integrity. |
Quantification Challenges and Best Practices for Reproducible, Publication-Ready Data
Within the broader thesis on How does EMSA detect protein-nucleic acid interactions, the need for rigorous quantification is paramount. The Electrophoretic Mobility Shift Assay (EMSA) is a cornerstone technique for visualizing these interactions, but generating reproducible, publication-ready quantitative data from gel shifts presents significant challenges. This guide details these challenges and outlines best practices to transform qualitative EMSA results into robust, quantitative datasets.
Core Quantification Challenges in EMSA
The transition from a gel image to a quantified binding curve involves multiple steps where error and variability can be introduced.
Table 1: Primary Quantification Challenges in EMSA
| Challenge Category | Specific Issue | Impact on Reproducibility & Quantification |
|---|---|---|
| Signal Linearity | Non-linear response of imaging systems (film or digital) at high signal intensities. | Leads to underestimation of band intensity, distorting fractional binding calculations. |
| Background Subtraction | Inconsistent methods for correcting lane background noise (local vs. global). | Introduces variability in calculated band volumes, affecting KD and cooperativity estimates. |
| Complex Stability | Complex dissociation during electrophoresis (non-equilibrium conditions). | Measured KD does not reflect the true solution equilibrium binding constant. |
| Multiple Species | Overlapping bands from super-shifts, non-specific complexes, or multiple protein complexes. | Difficult to accurately resolve and quantify individual species, leading to misassignment. |
| Sample Loading | Inconsistent loading of total nucleic acid probe across lanes. | Normalization becomes error-prone, compromising comparison between binding reactions. |
| Data Transformation | Inappropriate fitting models (e.g., assuming 1:1 stoichiometry incorrectly). | Derived thermodynamic parameters are inaccurate and not comparable across studies. |
Best Practices for Reproducible EMSA Quantification
Experimental Protocol for Quantifiable EMSA
A detailed, optimized protocol is the foundation for quantification.
Protocol: EMSA for Quantitative Analysis
- Probe Labeling: Use 5' end-labeling with T4 Polynucleotide Kinase and [γ-³²P]ATP (or equivalent non-radioactive tag). Purify labeled probe via native PAGE or spin column to remove unincorporated nucleotide.
- Binding Reaction:
- Maintain a constant, low concentration of labeled probe (typically 0.1-1 nM for high-affinity interactions) to approximate "tracer" conditions.
- Vary the concentration of purified protein across a series of reactions (e.g., 0.1 nM to 1 µM, serial dilutions).
- Include a large excess of non-specific competitor DNA (e.g., poly(dI-dC)) to suppress non-specific binding.
- Use a consistent buffer system (e.g., 10 mM HEPES, pH 7.5, 50 mM KCl, 1 mM DTT, 0.1 mg/mL BSA, 10% glycerol), incubation time (20-30 min), and temperature (25°C or 4°C).
- Electrophoresis:
- Pre-run native polyacrylamide gel (4-6%) in 0.5x TBE buffer at 100V for 30-60 min to establish equilibrium.
- Load reactions directly onto the running gel.
- Run at low voltage (8-10 V/cm) with cooling to minimize complex dissociation during electrophoresis.
- Imaging & Acquisition:
- For radioisotopes, use a phosphorimager. For fluorescent/chemiluminescent probes, use a CCD-based imager.
- Critical: Acquire multiple exposures to ensure bands of interest are within the linear dynamic range of the imaging system. Avoid saturated pixels.
Image Analysis & Data Processing Workflow
This standardized workflow minimizes subjective analysis.
Title: EMSA Quantification Image Analysis Workflow
Data Normalization and Curve Fitting
The core of quantification involves transforming intensity data into binding parameters.
Data Calculation:
- For each lane (i), measure the intensity of the free probe (Fᵢ) and the complex(es) (Cᵢ).
- Fraction Bound (θᵢ) = Cᵢ / (Cᵢ + Fᵢ), after background subtraction and normalization for total lane signal.
- Plot θ vs. total protein concentration [P]ₜₒₜₐₗ.
Fitting Models:
- Simple 1:1 Binding: θ = ([P]ₜₒₜₐₗ + [N]ₜₒₜₐₗ + Kᴅ) - sqrt(([P]ₜₒₜₐₗ + [N]ₜₒₜₐₗ + Kᴅ)² - 4[P]ₜₒₜₐₗ[N]ₜₒₜₐₗ) / (2[N]ₜₒₜₐₗ)
- Where [N]ₜₒₜₐₗ is the constant, total probe concentration.
- Cooperative Binding: Fit to Hill equation: θ = ([P]ₜₒₜₐₗ)ⁿʰ / (Kᴅⁿʰ + ([P]ₜₒₜₐₗ)ⁿʰ)
Table 2: Common Data Normalization Strategies
| Strategy | Method | Advantage | Disadvantage |
|---|---|---|---|
| Total Lane Normalization | Fraction Bound = Cᵢ / (Cᵢ + Fᵢ). | Accounts for loading differences. | Assumes no signal loss or smearing. |
| Spiked Internal Control | Add a differently labeled, non-binding control probe to each reaction. | Directly corrects for loading and transfer variability. | Requires dual-channel imaging. |
| Reference Lane | Express all Cᵢ values relative to a control lane (e.g., no protein). | Simple. | Amplifies error if reference lane is anomalous. |
The Scientist's Toolkit: EMSA Research Reagent Solutions
Table 3: Essential Reagents and Materials for Quantitative EMSA
| Item | Function & Importance for Quantification |
|---|---|
| High-Specific-Activity Labeled Probe (³²P or fluorescent) | Ensures a strong signal with low probe concentration, maintaining "tracer" conditions for accurate Kᴅ measurement. |
| Ultra-Pure, Recombinant Protein | Minimizes non-specific binding and degradation of probe, ensuring that observed shifts are due to the protein of interest. |
| Non-Specific Competitor DNA (e.g., poly(dI-dC), sheared salmon sperm DNA) | Suppresses binding to non-specific sites, sharpening specific complex bands and reducing background. |
| Chemically-Defined Binding Buffer (w/ BSA & glycerol) | Reduces protein adhesion to tubes; glycerol aids loading. Consistency is key for reproducibility across trials. |
| Native PAGE Gel System (Pre-cast or hand-cast) | Provides the matrix for separation. Consistent acrylamide percentage and cross-linking are vital for run-to-run reproducibility. |
| Phosphorimager or High-Dynamic-Range Digital Imager | Captures data within a linear response range, which is an absolute prerequisite for any quantification. |
| Quantification Software (e.g., ImageQuant, SAFA, custom ImageJ scripts) | Enables consistent background subtraction, ROI definition, and intensity measurement across all gel images. |
| Curve-Fitting Software (e.g., Prism, KaleidaGraph, R) | Allows fitting of binding data to appropriate thermodynamic models to extract Kᴅ and cooperativity values. |
Reliable quantification must be planned from the initial experimental design, not applied as an afterthought to a gel image. By understanding the inherent challenges—from maintaining equilibrium to ensuring linear detection—and implementing the best practices outlined for protocol execution, image analysis, and data modeling, researchers can produce EMSA data that is both publication-ready and fundamentally reproducible. This rigor elevates EMSA from a simple interaction assay to a powerful tool for determining the precise thermodynamic and kinetic parameters that are essential for advancing our thesis on protein-nucleic acid interactions in mechanistic and drug discovery contexts.
Beyond EMSA: Validation Strategies and Comparative Analysis with Modern Techniques
1. Introduction: The Need for Validation in the Context of EMSA Research
The Electrophoretic Mobility Shift Assay (EMSA) is a cornerstone technique for detecting in vitro protein-nucleic acid interactions, forming the core of many theses on molecular recognition. Its principle is based on the reduced electrophoretic mobility of a nucleic acid probe when bound by a protein. However, EMSA has inherent limitations: it is performed under non-physiological conditions (on naked DNA/RNA in a gel), cannot map binding sites at single-nucleotide resolution, and provides no evidence for in vivo relevance. Therefore, validation using complementary methods is essential to translate an in vitro observation into a biologically meaningful finding. This guide details two critical validation methods: Chromatin Immunoprecipitation (ChIP) for in vivo context and DNase I Footprinting for in vitro binding site resolution.
2. Chromatin Immunoprecipitation (ChIP): Establishing In Vivo Relevance
ChIP validates whether the interaction observed by EMSA occurs in living cells within the context of chromatin.
2.1 Detailed Protocol: Cross-Linking ChIP (X-ChIP)
- Cross-linking: Treat cells with 1% formaldehyde for 8-10 minutes at room temperature to covalently link proteins to DNA.
- Cell Lysis: Lyse cells in a buffer containing SDS or Triton X-100 to isolate nuclei.
- Chromatin Shearing: Sonicate cross-linked chromatin to shear DNA into fragments of 200-1000 bp. Efficiency must be verified by gel electrophoresis.
- Immunoprecipitation: Incubate sheared chromatin with a validated, high-specificity antibody against the protein of interest. Include a control IgG. Use protein A/G beads to capture antibody-protein-DNA complexes.
- Washes: Wash beads stringently with a series of buffers (e.g., low salt, high salt, LiCl, TE) to reduce non-specific binding.
- Elution & Reverse Cross-Linking: Elute complexes from beads and reverse cross-links by heating at 65°C overnight with high salt.
- DNA Purification: Digest RNA with RNase A and proteins with Proteinase K, followed by DNA purification (phenol-chloroform or columns).
- Analysis: Analyze the purified DNA by quantitative PCR (qPCR) at genomic loci of interest or by next-generation sequencing (ChIP-seq) for genome-wide mapping.
2.2 Data Presentation: Typical ChIP-qPCR Results
Table 1: Example ChIP-qPCR Data for Validating an EMSA-Identified Transcription Factor Binding Site
| Sample | Target Locus (CT Value) | Control Locus (CT Value) | % Input (2^ΔΔCT) | Enrichment vs. IgG |
|---|---|---|---|---|
| Anti-TF Antibody | 24.5 | 30.1 | 5.2% | 12.5-fold |
| Control IgG | 30.8 | 30.5 | 0.42% | 1.0-fold |
3. DNase I Footprinting: Mapping the Exact Binding Site In Vitro
DNase I Footprinting provides nucleotide-level resolution of the protein-binding site identified by EMSA.
3.1 Detailed Protocol: Traditional DNase I Footprinting
- End-Labeling: A DNA fragment containing the suspected binding site is labeled at one 5' or 3' end with [γ-³²P]ATP or a fluorescent tag.
- Binding Reaction: Incubate the labeled DNA with the purified protein of interest (used in EMSA) in an appropriate binding buffer with non-specific competitor DNA (e.g., poly(dI-dC)).
- DNase I Digestion: Add a dilute solution of DNase I for a limited time (e.g., 1 minute). The concentration is titrated to produce, on average, one cleavage per DNA molecule.
- Reaction Stop: Stop digestion with EDTA and precipitate DNA.
- Electrophoresis: Denature DNA and resolve fragments on a high-resolution polyacrylamide sequencing gel alongside a sequencing ladder (e.g., Sanger sequencing reactions) of the same DNA fragment.
- Detection: Visualize by autoradiography (radioactive) or fluorescence imaging. A protected region (a "footprint") where no cleavage occurs indicates protein binding.
3.2 Data Presentation: Footprinting Analysis Metrics
Table 2: Key Parameters for DNase I Footprinting Experiment
| Parameter | Typical Range / Value | Function / Note |
|---|---|---|
| DNA Probe Length | 100-500 bp | Must contain binding site ~centered. |
| Protein Amount | 0-1000 nM | Titrated to observe dose-dependent protection. |
| DNase I Concentration | 0.001-0.1 U/µL | Requires careful titration for each new batch. |
| Digestion Time | 1-5 minutes | Must be optimized. |
| Gel Resolution | 6-8% Polyacrylamide, 7-8 M Urea | For separation of single-nucleotide differences. |
| Protection Region | 8-30 bp | Corresponds to the protein's physical occlusion of DNA. |
4. The Scientist's Toolkit: Essential Reagents & Materials
Table 3: Research Reagent Solutions for Validation Experiments
| Reagent / Material | Function / Application | Key Considerations |
|---|---|---|
| High-Specificity ChIP-Grade Antibody | Immunoprecipitation of the protein-DNA complex in ChIP. | Validation in KO cells or with tagged proteins is critical. Avoid cross-reactivity. |
| Protein A/G Magnetic Beads | Capture of antibody-protein-DNA complexes in ChIP. | Improve wash efficiency and reduce background vs. agarose beads. |
| Formaldehyde (1%) | Reversible cross-linking of proteins to DNA in live cells for ChIP. | Cross-linking time must be optimized to balance signal and antigen masking. |
| DNase I (RNase-free) | Enzymatic cleavage of DNA backbone in footprinting. | Requires precise activity titration for each experiment. |
| [γ-³²P]ATP or Fluorescent Dye Terminators | End-labeling of DNA for footprinting detection. | Radioactive offers high sensitivity; fluorescent is safer and more modern. |
| Sequencing Gel Electrophoresis System | High-resolution separation of DNA fragments differing by a single nucleotide. | Requires glass plates, spacers, and a power supply capable of ~2000V. |
| Poly(dI-dC) or Sheared Salmon Sperm DNA | Non-specific competitor DNA in EMSA, Footprinting, and ChIP. | Quenches non-specific DNA-binding proteins to reduce background. |
5. Visualizing Method Relationships and Workflows
Diagram 1: Decision Pathway for Validating EMSA Results
Diagram 2: Chromatin Immunoprecipitation (ChIP) Core Workflow
Diagram 3: DNase I Footprinting Experimental Procedure
This analysis is framed within the broader thesis question: "How does EMSA detect protein-nucleic acid interactions?" Electrophoretic Mobility Shift Assay (EMSA) and Surface Plasmon Resonance (SPR) are two pivotal techniques employed in the study of biomolecular interactions. EMSA is a foundational, semi-quantitative method primarily used for the detection and confirmation of specific protein-nucleic acid complexes. In contrast, SPR is a label-free, real-time biosensor technology that provides detailed quantitative data on binding kinetics (association/dissociation rates) and affinity. This whitepaper provides an in-depth technical comparison, highlighting how EMSA serves as a tool for simple, accessible detection, while SPR delivers sophisticated kinetic profiling.
Core Principle and Information Output
EMSA (Gel Shift Assay):
- Principle: Based on the retardation in electrophoretic mobility of a nucleic acid probe when bound by a protein. The complex migrates more slowly through a non-denaturing gel than the free probe.
- Primary Output: A binary or semi-quantitative "yes/no" for binding occurrence, with limited information on affinity (via titration) and specificity (via competition). It provides no direct kinetic rate constants.
Surface Plasmon Resonance (SPR):
- Principle: Measures changes in the refractive index on a thin gold sensor surface upon biomolecular binding. One interactant (ligand) is immobilized on the sensor chip, and the other (analyte) flows over it in solution.
- Primary Output: Real-time sensorgrams providing quantitative data: association rate constant (ka), dissociation rate constant (kd), and equilibrium dissociation constant (KD = kd/ka).
Quantitative Data Comparison
Table 1: Technical Specifications and Performance Metrics
| Parameter | EMSA | Surface Plasmon Resonance (SPR) |
|---|---|---|
| Detection Limit | ~1-10 nM (for protein) | ~0.1-10 nM (analyte dependent) |
| Throughput | Low to Medium (manual gel-based) | Medium to High (automated, multi-channel) |
| Assay Time | 4-8 hours (gel run + detection) | 15 mins - 2 hours per cycle (real-time) |
| Sample Consumption | Moderate (µg of protein) | Low (ng-µg of analyte) |
| Label Required? | Typically yes (radiolabel or chemiluminescence) | No (label-free) |
| Affinity Range (KD) | mM - nM (semi-quantitative) | pM - µM (precise quantification) |
| Kinetic Data? | No | Yes (ka, kd) |
| Key Advantage | Simple, accessible, confirms complex formation. | Label-free, real-time kinetics. |
| Key Limitation | Low throughput, end-point, semi-quantitative. | Immobilization chemistry challenges, potential non-specific binding. |
Table 2: Typical Quantitative Output Examples for a Protein-DNA Interaction
| Assay | Measured Parameter | Example Result | Notes |
|---|---|---|---|
| EMSA | Apparent KD (from titration) | ~ 5 x 10⁻⁹ M | Derived from band intensity; assumes equilibrium during loading. |
| SPR | Association Rate (ka) | 1.2 x 10⁵ M-1s-1 | Direct measurement from binding slope. |
| SPR | Dissociation Rate (kd) | 3.8 x 10⁻⁴ s-1 | Direct measurement from dissociation phase. |
| SPR | Equilibrium KD (kd/ka) | 3.2 x 10⁻⁹ M | Calculated from kinetic rates. |
| SPR | Equilibrium KD (Steady-state) | 4.1 x 10⁻⁹ M | Derived from equilibrium response vs. concentration. |
Experimental Protocols
Detailed EMSA Protocol for Protein-Nucleic Acid Detection
Objective: To detect and verify the specific binding of a transcription factor to its cognate DNA sequence.
Key Reagents & Materials: See The Scientist's Toolkit below.
Procedure:
- Probe Preparation: A 20-40 bp double-stranded DNA oligonucleotide containing the predicted protein-binding site is prepared. It is typically labeled at the 5' ends with [γ-32P] ATP via T4 Polynucleotide Kinase or with a biotin tag for chemiluminescent detection.
- Binding Reaction: The reaction is assembled in a low-salt binding buffer (e.g., 10 mM Tris, 50 mM KCl, 1 mM DTT, 5% glycerol, 0.05% NP-40, 100 µg/mL BSA, 1 µg/mL poly(dI-dC) as non-specific competitor). Components are added in this order: water, buffer, protein extract/recombinant protein, unlabeled competitor DNA (for specificity tests), and finally the labeled probe (2-10 fmol). The mixture (10-20 µL total) is incubated at room temperature or 4°C for 20-30 minutes.
- Non-denaturing Gel Electrophoresis: A 4-6% polyacrylamide gel (29:1 acrylamide:bis) is pre-run in 0.5X TBE buffer at 100 V for 30-60 mins to achieve a low, constant temperature. After incubation, a non-ionic loading dye is added to the binding reactions, which are then loaded onto the gel. Electrophoresis is performed at constant voltage (100-150 V) in a cold room or with cooling until the free probe has migrated ~2/3 of the gel length.
- Detection:
- Radioactive: The gel is transferred to filter paper, dried, and exposed to a phosphorimager screen or X-ray film.
- Chemiluminescent: The gel is electroblotted onto a positively charged nylon membrane. The biotin-labeled DNA is crosslinked to the membrane and detected using a Streptavidin-Horseradish Peroxidase (HRP) conjugate and a chemiluminescent substrate.
Detailed SPR Protocol for Binding Kinetics
Objective: To determine the kinetic rate constants and affinity of a DNA-binding protein for its target sequence.
Procedure:
- Surface Preparation: A sensor chip (e.g., streptavidin-SA, or NTA for His-tagged proteins) is docked in the instrument. The system is primed with running buffer (e.g., HBS-EP+: 10 mM HEPES, 150 mM NaCl, 3 mM EDTA, 0.05% surfactant P20, pH 7.4).
- Ligand Immobilization: For DNA immobilization, a 5'-biotinylated dsDNA oligo is captured onto a streptavidin chip surface to a desired response level (~50-100 Response Units, RU). A reference flow cell is prepared with a non-specific DNA sequence or left blank.
- Kinetic Experiment:
- A series of analyte (protein) concentrations (e.g., 0.5, 1, 2, 4, 8 nM) are prepared in running buffer.
- Using the instrument's automated fluidics, each sample is injected over the ligand and reference surfaces at a constant flow rate (e.g., 30 µL/min) for an association phase (e.g., 120 s).
- The flow is switched back to running buffer for a dissociation phase (e.g., 180-300 s).
- The surface is regenerated between cycles by a short injection of a regeneration solution (e.g., 10 mM Glycine-HCl, pH 2.0) to remove all bound analyte without damaging the immobilized ligand.
- Data Analysis: The reference cell data is subtracted from the ligand cell data to yield specific binding sensorgrams. This data is fitted globally to a 1:1 binding model using the instrument's software to extract ka, kd, and KD.
Visualizations
Title: EMSA and SPR Experimental Workflows Compared
Title: SPR Sensorgram Parameter Extraction Guide
The Scientist's Toolkit: Key Reagent Solutions
Table 3: Essential Materials for Protein-Nucleic Acid Interaction Studies
| Category | Item | Function/Benefit |
|---|---|---|
| EMSA Core | Non-denaturing Polyacrylamide Gel | Matrix for separation based on size/charge of protein-nucleic acid complexes. |
| Labeled DNA Probe (³²P or Biotin) | Enables sensitive detection of free and bound nucleic acid. | |
| Carrier DNA (poly(dI-dC)) | Competes for non-specific protein binding, reducing background. | |
| EMSA Binding Buffer (Low Ionic Strength) | Maintains native protein structure and promotes specific interaction. | |
| SPR Core | Sensor Chips (SA, NTA, CM5) | Functionalized gold surfaces for covalent or high-affinity ligand capture. |
| High-Purity Running Buffer (e.g., HBS-EP+) | Provides stable baseline; additives like P20 minimize non-specific binding. | |
| Regeneration Solution (e.g., Glycine pH 2.0) | Removes bound analyte without damaging the immobilized ligand for chip re-use. | |
| Common | Recombinant Purified Protein | Ensures defined composition for accurate quantification and kinetics. |
| Specific & Mutant DNA Oligonucleotides | Serve as target ligand and critical controls for binding specificity. | |
| Mobility Shift/Kinetics Analysis Software | For densitometry (EMSA) or global curve fitting (SPR) to extract quantitative data. |
This whitepaper provides a technical comparison of two fundamental techniques for studying protein-nucleic acid interactions: the traditional Electrophoretic Mobility Shift Assay (EMSA) and the solution-based Fluorescence Polarization (FP) assay. Within the broader thesis on "How does EMSA detect protein-nucleic acid interactions?", this analysis situates EMSA as the foundational, gel-based method that separates bound from unbound complexes. It contrasts this with FP, a homogeneous, solution-phase technique that measures molecular rotation, thereby offering a complementary perspective on interaction dynamics without separation steps.
Core Principle & Workflow Comparison
Electrophoretic Mobility Shift Assay (EMSA): Also known as a gel shift assay, EMSA detects interactions based on the reduced electrophoretic mobility of a protein-nucleic acid complex compared to the free nucleic acid probe in a native polyacrylamide or agarose gel. The separation creates a visual "shift."
Fluorescence Polarization Assay (FP): FP measures the change in the rotational speed of a small fluorescently-labeled nucleic acid probe upon binding to a much larger protein. Binding increases the molecular weight, slowing rotation and increasing the emitted polarized light.
Experimental Workflow Diagrams:
Diagram Title: EMSA Experimental Workflow Steps
Diagram Title: FP Assay Experimental Workflow Steps
Quantitative Comparison of Key Assay Parameters
Table 1: Direct Comparison of EMSA and FP Assay Characteristics
| Parameter | EMSA (Gel-Shift) | Fluorescence Polarization (FP) |
|---|---|---|
| Assay Format | Heterogeneous (gel-based, separation required) | Homogeneous (solution-based, no separation) |
| Detection Principle | Mobility shift via electrophoresis | Change in molecular rotation |
| Throughput | Low to medium (gel-limited) | High (96/384-well plate compatible) |
| Assay Time | 4-8 hours (incubation + run + imaging) | 1-2 hours (incubation + read) |
| Sample Consumption | Moderate to High (µg of protein) | Low (ng-pg of protein) |
| Quantitative Accuracy | Semi-quantitative (band intensity) | Highly quantitative (direct Kd calculation) |
| Real-time Kinetics | No (endpoint only) | Yes (continuous monitoring possible) |
| Key Readout | Band shift position | Millipolarization (mP) units |
| Primary Application | Detection, complex stoichiometry, supershift | Binding affinity (Kd), competition, kinetics |
| Probe Labeling | Radioactive (³²P) or fluorescent | Fluorescent only (TAMRA, FITC, Cy dyes) |
Table 2: Typical Experimental Data Output
| Metric | EMSA Output | FP Assay Output |
|---|---|---|
| Binding Affinity (Kd) | Estimated from titration series | Directly calculated from fitted binding curve |
| Typical Kd Range | ~ nM - µM | pM - µM (depends on probe size/affinity) |
| Precision (CV) | 15-25% | 5-10% |
| Z'-Factor (HTS) | Not applicable | >0.5 (Excellent for HTS) |
Detailed Experimental Protocols
Protocol A: Standard EMSA for Protein-DNA Interaction
- Probe Preparation: Generate a 20-50 bp dsDNA probe by annealing complementary oligonucleotides. Label the probe at the 5' end using [γ-³²P] ATP and T4 polynucleotide kinase or with a fluorophore.
- Binding Reaction: Assemble a 20 µL reaction containing:
- 10-20 mM HEPES or Tris buffer (pH 7.5-8.0)
- 50-100 mM KCl or NaCl
- 1 mM DTT
- 0.1-0.2 µg/µL BSA or nonspecific carrier (e.g., poly(dI-dC))
- 10% glycerol
- 0.1% NP-40 (optional)
- 0.5-2 nM labeled DNA probe
- 0-500 nM purified protein (titrated)
- Incubate at 25°C for 20-30 minutes.
- Gel Electrophoresis:
- Pre-run a 4-10% native polyacrylamide gel (29:1 acrylamide:bis) in 0.5X TBE buffer at 100V for 30-60 minutes at 4°C.
- Load binding reactions (add loading dye without SDS/bromophenol blue).
- Run gel at 100-150 V, constant voltage, 4°C until dye front migrates appropriately (1-2 hours).
- Detection: For radioactive probes, dry gel and expose to a phosphorimager screen. For fluorescent probes, image using a gel documentation system with appropriate excitation/emission filters.
Protocol B: FP Assay for Kd Determination
- Probe Preparation: Obtain a target-specific, fluorescently-labeled nucleic acid probe (e.g., 5'-FAM or TAMRA). Perform a probe optimization experiment to determine the optimal concentration (typically 1-5 nM) that maximizes the polarization window (ΔmP).
- Assay Plate Setup:
- In a black 96- or 384-well low-volume plate, prepare a 2X serial dilution of the protein across the desired concentration range (e.g., 0.1 nM to 10 µM) in assay buffer (e.g., 20 mM Tris, 100 mM NaCl, 1 mM DTT, 0.01% Tween-20, pH 7.5).
- Add an equal volume of the 2X concentrated probe solution to each well. Final volume: 20-50 µL.
- Include controls: probe-only (minimal mP) and a high-concentration protein control (maximal mP).
- Incubation & Measurement:
- Seal plate, incubate at room temperature for 15-60 minutes to reach equilibrium.
- Measure fluorescence polarization (mP) using a plate reader equipped with FP optics (excitation/emission filters appropriate for the fluorophore).
- Data Analysis:
- Subtract background from blank wells.
- Plot mP vs. log[Protein]. Fit data to a one-site specific binding model to calculate the dissociation constant (Kd).
The Scientist's Toolkit: Key Research Reagent Solutions
Table 3: Essential Materials for EMSA and FP Assays
| Reagent/Material | Function | Typical Example/Supplier |
|---|---|---|
| Purified Protein | The binding partner of interest; requires functional activity. | Recombinant transcription factor, RNA-binding protein. |
| Labeled Nucleic Acid Probe | The detectable binding target; sequence-specificity is critical. | ³²P-ATP (PerkinElmer), 5'-FAM-labeled oligonucleotide (IDT). |
| Non-specific Competitor DNA | (EMSA) Reduces non-specific protein-probe binding. | Poly(dI-dC) (Sigma-Aldrich), sheared salmon sperm DNA. |
| Native Gel System | (EMSA) Matrix for electrophoretic separation of complexes. | Mini-PROTEAN TGX Precast Gels (Bio-Rad). |
| FP-Optimized Assay Buffer | (FP) Maintains protein stability & interaction, minimizes background. | Commercial FP buffer kits (Thermo Fisher, Cisbio). |
| Black Low-Binding Microplates | (FP) Minimizes light scattering and analyte adsorption. | Corning 384-well Low Flange Black Polystyrene Plate. |
| Fluorescence Polarization Plate Reader | (FP) Instrument for high-throughput mP measurement. | SpectraMax i3x (Molecular Devices), CLARIOstar Plus (BMG Labtech). |
| Electrophoresis & Imaging System | (EMSA) For running and visualizing gels. | Mini gel tank (Thermo Fisher), Typhoon Phosphorimager (Cytiva). |
EMSA remains indispensable for visualizing discrete complexes, assessing stoichiometry, and performing "supershift" experiments with specific antibodies. Its strength lies in its direct visual evidence. In contrast, FP assays excel at providing precise, solution-phase thermodynamic and kinetic data with high throughput and minimal material, making them ideal for drug discovery screening and detailed mechanistic studies. The choice between them is dictated by the specific research question: use EMSA for qualitative complex analysis and FP for quantitative binding analysis.
EMSA vs. Microscale Thermophoresis (MST) & Isothermal Titration Calorimetry (ITC)
This whitepaper serves as a technical guide comparing Electrophoretic Mobility Shift Assay (EMSA) with Microscale Thermophoresis (MST) and Isothermal Titration Calorimetry (ITC) for the study of protein-nucleic acid interactions. Within the broader thesis on "How does EMSA detect protein-nucleic acid interactions," this comparison is crucial. While EMSA is a cornerstone, gold-standard technique for detecting such interactions based on mobility shifts in a gel matrix, MST and ITC provide complementary, solution-based data on binding affinity and thermodynamics. Understanding the capabilities and limitations of each method is essential for designing robust experimental strategies to dissect molecular recognition in gene regulation, drug discovery, and virology.
EMSA separates protein-nucleic acid complexes from free nucleic acid via non-denaturing gel electrophoresis. The retardation of mobility indicates binding. It is qualitative/semi-quantitative, excellent for detecting binding events and complex composition.
MST measures the directed movement of molecules in a microscopic temperature gradient. Binding-induced changes in size, charge, or hydration shell alter the thermophoretic movement, allowing precise quantification of binding affinities (Kd) in solution.
ITC directly measures the heat released or absorbed upon binding during titrations. It provides a complete thermodynamic profile—binding constant (Ka/Kd), enthalpy (ΔH), entropy (ΔS), and stoichiometry (n)—in a single experiment.
The table below summarizes the key comparative metrics.
Table 1: Comparative Overview of EMSA, MST, and ITC
| Parameter | EMSA | MST | ITC |
|---|---|---|---|
| Measured Parameter | Mobility shift (complex formation) | Thermophoresis + fluorescence change | Heat change (μcal/sec) |
| Primary Output | Detection of binding, complex supershift, stoichiometry hint | Binding affinity (Kd), dissociation curves, binding kinetics hint | Thermodynamic profile (Kd, ΔH, ΔS, n) |
| Sample Consumption | Low (fmol-pmol) | Very Low (fmol, typically 4-20 µL of nM concentration) | High (nmol, typically 200-300 µL of ~10-100 µM) |
| Throughput | Medium (multiple samples per gel) | High (capillary-based, rapid titration series) | Low (single experiment per cell, 1-2 hours) |
| Labeling Requirement | Typically non-labeled or end-labeled nucleic acid | One component must be fluorescently labeled | No labeling required |
| Buffer Compatibility | Can be restrictive (low salt for electrophoresis) | High (tolerates diverse buffers, detergents, even crude lysates) | Moderate (high salt/buffers can cause large dilution heats) |
| Quantitative Rigor | Semi-quantitative; qualitative detection | Highly quantitative (nM-pM Kd range) | Highly quantitative |
| Key Advantage | Visual proof of complex, antibody supershift capability | Minimal consumption, works in complex buffers, broad Kd range | Complete thermodynamic profile, no labeling |
| Key Limitation | Non-equilibrium, gel artifacts, poor for weak affinities | Requires fluorescent labeling, sensitive to environmental changes | High sample consumption, low throughput, requires significant heat signal |
Detailed Methodologies
Electrophoretic Mobility Shift Assay (EMSA) Protocol
Principle: A native polyacrylamide or agarose gel retards protein-nucleic acid complexes relative to free nucleic acid due to increased mass and altered charge.
Protocol:
- Binding Reaction: Combine in a 10-20 µL volume:
- Labeled nucleic acid probe (5-20 fmol, 32P, Cy5, or biotin).
- Purified protein or nuclear extract (varying amounts).
- Binding Buffer (10-20 mM HEPES, 50-100 mM KCl, 1 mM DTT, 0.1-0.5 µg/µL BSA/carrier DNA, 5-10% glycerol, 0.1% NP-40).
- Specific competitor (unlabeled probe) or non-specific competitor (e.g., poly(dI-dC)) to assess specificity.
- Incubation: Incubate at room temperature or 4°C for 20-30 minutes.
- Electrophoresis: Load reaction onto a pre-run non-denaturing polyacrylamide gel (4-6%) in 0.5x TBE or similar low-ionic-strength buffer. Run at 4-10°C (to prevent complex dissociation) at constant voltage (80-120 V) until dye front migrates appropriately.
- Detection: For radioactive probes, dry gel and expose to a phosphorimager screen. For fluorescent/biotinylated probes, use appropriate imaging systems.
Microscale Thermophoresis (MST) Protocol
Principle: An IR laser creates a localized temperature gradient. Fluorescence is monitored to track molecule movement. Binding changes the molecule's thermophoretic properties, altering the fluorescence trace.
Protocol:
- Labeling: Fluorescently label the target (protein) or ligand (nucleic acid) using amine-, cysteine-, or click-chemistry tags (e.g., NHS-Cy5, maleimide-dyes). Nucleic acids can be purchased with internal or terminal dyes.
- Sample Preparation:
- Prepare a constant concentration of the fluorescent molecule (e.g., 10 nM labeled protein) in assay buffer.
- Prepare a serial dilution (typically 1:1) of the unlabeled binding partner (nucleic acid) in the same buffer, covering a concentration range 3 orders of magnitude above and below the expected Kd.
- Loading & Measurement: Fill standard or premium capillaries with each dilution mixed 1:1 with the constant fluorescent molecule. Place capillaries in the MST instrument. The instrument measures initial fluorescence (F initial), then applies the IR laser, inducing thermophoresis (T-Jump phase), followed by a return to equilibrium (Diffusion phase).
- Data Analysis: Normalized fluorescence (F norm = F hot / F cold) is plotted against ligand concentration. The binding curve is fitted using the law of mass action to extract Kd.
Isothermal Titration Calorimetry (ITC) Protocol
Principle: Measures the heat change when a ligand is titrated into a sample cell containing the macromolecule. Integrated heat peaks yield a binding isotherm.
Protocol:
- Sample Preparation:
- Cell: Highly purified protein (typically 10-100 µM) in dialysis buffer.
- Syringe: Nucleic acid ligand at 10-20 times higher concentration than the cell content, in the identical dialysis buffer. Careful buffer matching is critical.
- Both solutions must be thoroughly degassed to prevent bubbles.
- Instrument Setup: Fill the sample cell with protein solution and the syringe with ligand solution. Set reference cell with water or dialysis buffer. Set temperature (typically 25°C or 37°C).
- Titration Experiment: Program an injection sequence (e.g., 19 injections of 2 µL each, spaced 150-180 seconds apart). The instrument injects ligand, stirs the cell, and measures the differential power needed to maintain the sample cell at the same temperature as the reference cell.
- Data Analysis: Integrate each heat peak. Plot the amount of heat per injection (kcal/mol of injectant) against the molar ratio. Fit the binding isotherm model to derive n (stoichiometry), Ka (association constant = 1/Kd), and ΔH. Calculate ΔG (ΔG = -RTlnKa) and TΔS (ΔG = ΔH - TΔS).
Visualization of Workflows
Diagram 1: EMSA Experimental Workflow
Diagram 2: MST Experimental Workflow
Diagram 3: ITC Experimental Workflow
The Scientist's Toolkit: Essential Research Reagents & Materials
Table 2: Key Reagent Solutions for Protein-Nucleic Acid Interaction Studies
| Item | Typical Use | Function |
|---|---|---|
| Non-denaturing Polyacrylamide Gel (4-8%) | EMSA | Matrix for separation of complex vs. free probe based on size/shape, not denatured state. |
| 32P-ATP / γ-32P-ATP or Cy5/Biotin-NTPs | EMSA Probe Labeling | Radioactive or fluorescent isotopes for end-labeling nucleic acid probes via kinase or polymerase reactions. |
| Poly(dI-dC) or sheared salmon sperm DNA | EMSA | Non-specific competitor DNA to reduce non-specific protein binding to the probe. |
| HEPES/Tris-based Binding Buffer | EMSA, MST, ITC | Maintains physiological pH and ionic strength for native interaction. |
| MST Capillaries | MST | Hold nanoliter-scale samples for measurement in the temperature gradient. |
| NHS-Ester or Maleimide Fluorescent Dyes (e.g., Cy5, Alexa647) | MST Labeling | Chemically conjugate fluorophores to proteins via amines or cysteines. |
| Dye-labeled oligonucleotides | MST | Commercially synthesized nucleic acids with internal/terminal fluorophores for direct use. |
| High-Purity Dialysis Buffer | ITC | Ensures perfect chemical matching between cell and syringe solutions to avoid injection artifacts. |
| ITC Sample Cell & Syringe | ITC | Holds the macromolecule and allows precise, automated injection of ligand. |
| Specific Antibodies | EMSA Supershift | Binds to the protein in the complex, causing a further mobility shift to confirm protein identity. |
Table 3: Quantitative Performance Comparison
| Metric | EMSA | MST | ITC |
|---|---|---|---|
| Typical Kd Range | > 10 nM (semi-quantitative) | 1 pM - 100 µM | 100 nM - 10 µM (optimal) |
| Sample Volume per Data Point | 5-20 µL (entire gel) | 4-10 µL | 200-300 µL (entire experiment) |
| Amount of Protein Required | ~1-100 pmol (per gel lane) | ~10 fmol - 1 pmol (total) | 10-100 nmol (total) |
| Assay Time | 3-6 hours (gel run + detection) | 10-30 minutes (measurement + setup) | 1-2 hours (per titration) |
| Stoichiometry (n) Determination | Indirect, qualitative | Possible from binding curve shape | Direct, precise readout from isotherm |
| Kinetics (kon/koff) Access | No | Limited (via time-resolved MST) | Limited (if coupled to slow processes) |
| Heat Signal (ITC only) | N/A | N/A | Typically 1-50 µcal per injection |
Within the thesis investigating EMSA's detection mechanism, this comparison highlights EMSA's unique role as a direct, visual, and versatile qualitative tool, especially for complex formation analysis and supershift experiments. However, for a comprehensive quantitative understanding of protein-nucleic acid interactions, MST and ITC are indispensable. MST excels in efficiency and minimal sample consumption across a vast affinity range, while ITC remains the gold standard for obtaining a full thermodynamic signature without labeling. The choice of technique depends on the specific research question, required information (detection vs. affinity vs. thermodynamics), and available sample quantity and quality. An integrated approach, often starting with EMSA for detection and moving to MST or ITC for quantification, provides the most robust analysis.
Within the broader thesis context of "How does EMSA detect protein-nucleic acid interactions?", this guide delineates the strategic application of the Electrophoretic Mobility Shift Assay (EMSA) as either a high-throughput screening tool or a component of in-depth mechanistic studies. Understanding this distinction is critical for efficient experimental design in molecular biology, biochemistry, and drug development.
The Fundamental Principle of EMSA
EMSA detects interactions based on the reduction in electrophoretic mobility of a nucleic acid probe (DNA or RNA) when bound by a protein. The complex migrates more slowly through a non-denaturing gel than the free probe. The core measurable output is the fraction of probe shifted, which can be quantified.
EMSA as a Primary Screening Tool
Screening applications prioritize speed, throughput, and cost-effectiveness to identify binding events from numerous candidates.
Primary Use Cases:
- Identifying DNA-binding specificity of a transcription factor from a panel of mutant probes.
- Screening compound libraries for inhibitors of a critical viral protein-RNA interaction.
- Confirming successful protein purification by testing binding activity.
- Mapping rough binding regions via mutagenesis or truncation series.
Key Characteristics:
- Throughput: Medium to High (multiple conditions per gel).
- Data Depth: Qualitative or semi-quantitative (yes/no binding; relative affinity).
- Experimental Speed: Fast (standard protocols, often with pre-cast gels).
- Sample Consumption: Low (small reaction volumes).
- Labeling: Typically uses a single, constant probe label (e.g., Cy5, FITC, or (^{32})P).
Table 1: Quantitative Parameters for EMSA Screening
| Parameter | Typical Range for Screening | Notes |
|---|---|---|
| Protein Amount | 0.1-10 ng per reaction | Often used in excess to ensure detection. |
| Probe Concentration | 0.1-1 nM (labeled) | Low to approximate (K_d) conditions. |
| Incubation Time | 15-30 minutes | Room temperature or 4°C. |
| Gel Electrophoresis | 60-90 minutes, 4°C | Non-denaturing polyacrylamide (4-10%). |
| Detection Limit ((K_d)) | ~1 nM - 10 µM | Suitable for moderate-to-high affinity interactions. |
Screening Protocol Summary:
- Probe Preparation: Label a single, specific nucleic acid probe (e.g., a consensus sequence) at the 5' or 3' end with a fluorophore or radioisotope.
- Binding Reaction: Combine in a 10-20 µL volume: labeled probe (0.5 nM), purified protein (varying amounts or fixed excess), binding buffer (10 mM HEPES, 50 mM KCl, 1 mM DTT, 0.1% NP-40, 2.5% glycerol, 100 µg/mL BSA), and nonspecific competitor DNA (e.g., 1 µg poly(dI-dC)).
- Incubation: 20 minutes at room temperature.
- Electrophoresis: Load reaction directly onto a pre-run 6% non-denaturing polyacrylamide gel in 0.5x TBE at 100V for 60-70 minutes at 4°C.
- Detection: Image gel using appropriate fluorescence/phosphorimager scanner.
EMSA in Detailed Mechanistic Studies
For mechanistic studies, EMSA is adapted to yield precise quantitative data and is often combined with complementary techniques.
Primary Use Cases:
- Determining absolute binding affinity ((K_d)) and stoichiometry.
- Analyzing binding cooperativity.
- Characterizing ternary complex formation (e.g., protein-protein-nucleic acid).
- Assessing binding kinetics (when combined with stopped-flow or other methods).
Key Characteristics:
- Throughput: Low (focused, replicate-intensive).
- Data Depth: Highly quantitative.
- Experimental Rigor: Includes full competition and titration series.
- Combination with other techniques: Essential (e.g., footprinting, crosslinking, FRET).
Table 2: Quantitative Parameters for Mechanistic EMSA
| Parameter | Typical Range for Mechanistic Studies | Notes |
|---|---|---|
| Protein Titration | 0.01 nM - 1 µM (serial dilution) | To generate a full saturation binding curve. |
| Probe Concentration | Must be << (K_d) (often 10-50 pM) | Critical for accurate (K_d) determination. |
| Competition EMSA | Cold competitor from 1x to 1000x molar excess | Used to determine IC(_{50}) and relative affinity. |
| Replicates | ≥3 independent experiments | For statistical significance. |
| Data Analysis | Non-linear curve fitting to binding models | Yields (K_d), Hill coefficient (n). |
Mechanistic (K_d) Determination Protocol:
- Probe Preparation: Use precisely quantified, labeled probe. Concentration must be kept significantly below the expected (K_d) to maintain pseudo-first-order kinetics.
- Protein Serial Dilution: Prepare a 2-fold serial dilution of purified protein across 12-16 points in binding buffer (without BSA if quantifying).
- Binding Reaction: Mix a constant, low concentration of probe (e.g., 50 pM) with each protein dilution. Include negative control (no protein).
- Equilibrium Incubation: Incubate at constant temperature (e.g., 25°C) for a time confirmed to reach equilibrium (> 5 x estimated (k_{off}^{-1})).
- Separation & Quantification: Run gel as in screening. Quantify the fraction of bound probe ((θ)) for each lane using image analysis software (e.g., ImageQuant).
- Data Fitting: Plot (θ) vs. log[Protein] and fit data to a standard Langmuir binding isotherm: (θ = [P]/(Kd + [P])), where [P] is free protein concentration (often approximated by total protein concentration when [Probe] << (Kd)).
The Scientist's Toolkit: EMSA Research Reagent Solutions
Table 3: Essential Materials for EMSA Experiments
| Item | Function & Key Characteristics |
|---|---|
| Non-denaturing Polyacrylamide Gel | Matrix for separation. 4-10% acrylamide:bis (29:1 or 37.5:1) in 0.5x TBE. Low ionic strength preserves complexes. |
| Labeled Nucleic Acid Probe | The binding target. Chemically synthesized oligos with 5' end-label using [γ-(^{32})P] ATP & T4 PNK or fluorescent dye (Cy5, FITC). |
| Purified Protein | The binding partner. Recombinantly expressed and purified; activity and concentration must be accurately determined. |
| Non-specific Competitor DNA | Suppresses weak, non-specific binding. Poly(dI-dC) or sheared salmon sperm DNA are common. Concentration is optimized empirically. |
| Binding Buffer | Maintains pH, ionic strength, and protein stability. Typically contains HEPES/Tris, KCl/NaCl, Mg(^{2+}), DTT, glycerol (for stability), and non-ionic detergent. |
| Gel Shift Buffer (Running Buffer) | 0.5x TBE (Tris-Borate-EDTA) or 0.5x TAE. Low ionic strength and pH stability are crucial. Running at 4°C minimizes complex dissociation. |
| Electrophoresis System | Standard vertical gel apparatus with temperature control (cold room or circulator). Pre-casting gels can improve reproducibility. |
| Detection System | Radioactive: Phosphorimager. Fluorescent: Scanner with appropriate excitation/emission filters (e.g., Typhoon, Azure). |
| Image Analysis Software | For quantification (e.g., ImageLab, ImageQuant, Fiji). Used to measure pixel intensity of free and bound probe bands. |
Strategic Decision Workflow
Title: EMSA Application Decision Flowchart
Complementary Techniques & Pathway Integration
EMSA is rarely the endpoint in mechanistic studies. It integrates into broader workflows.
Title: EMSA Integration with Complementary Assays
The decision to employ EMSA for screening or mechanistic analysis hinges on the research question's scope. Screening leverages EMSA's simplicity and moderate throughput for discovery. Mechanistic studies exploit its capacity for quantification but require rigorous experimental design, precise reagent control, and integration with orthogonal biophysical methods. Within the thesis on how EMSA detects interactions, this duality underscores that the assay is both a versatile detector and a foundational tool upon which detailed biochemical understanding is built.
Conclusion
The Electrophoretic Mobility Shift Assay remains a cornerstone technique for directly visualizing and quantifying protein-nucleic acid interactions, offering a unique blend of simplicity, versatility, and direct evidence of complex formation. From its foundational principles to optimized protocols and robust validation, EMSA is indispensable for characterizing transcription factors, understanding gene regulatory networks, and screening drug candidates that modulate these interactions. While newer label-free and solution-based methods provide advanced kinetic data, EMSA's visual proof and adaptability ensure its continued relevance. Future integration with high-throughput automation and quantitative digital analysis will further solidify its role in accelerating discovery in molecular biology, functional genomics, and targeted therapeutic development.